. 2024 Feb 7;14(1):3108.
doi: 10.1038/s41598-024-53658-0.

A new bio imagery user-friendly tool for automatic morphometry measurement on muscle cell cultures and histological sections

Affiliations

A new bio imagery user-friendly tool for automatic morphometry measurement on muscle cell cultures and histological sections

Aurélien Brun et al. Sci Rep. .

Abstract

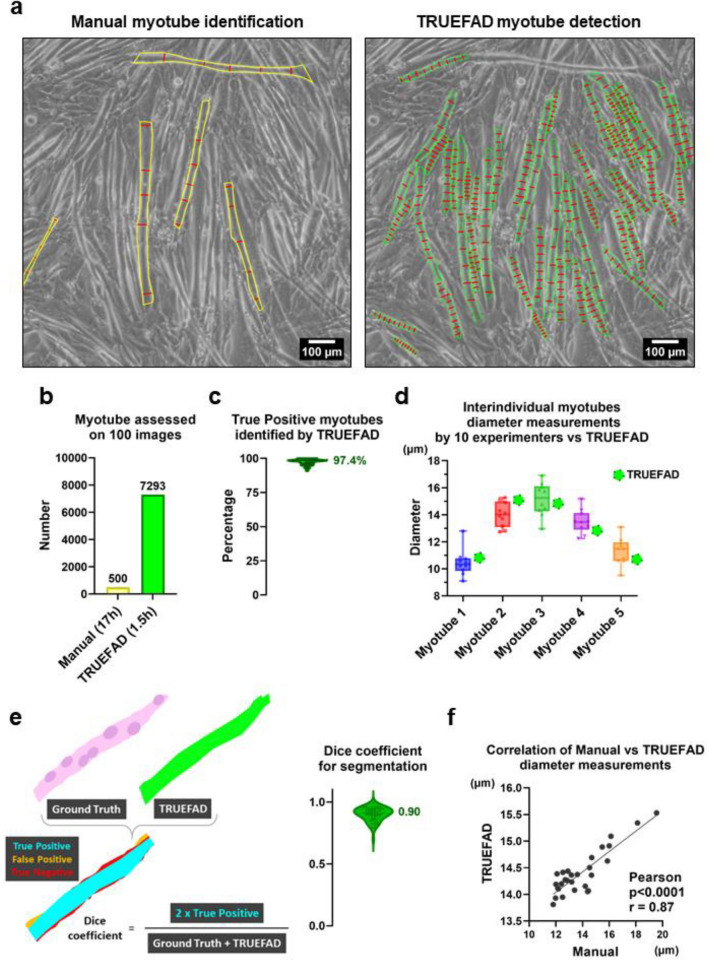
TRUEFAD (TRUE Fiber Atrophy Distinction) is a bioimagery user-friendly tool developed to allow consistent and automatic measurement of myotube diameter in vitro, muscle fiber size and type using rodents and human muscle biopsies. This TRUEFAD package was set up to standardize and dynamize muscle research via easy-to-obtain images run on an open-source plugin for FIJI. We showed here both the robustness and the performance of our pipelines to correctly segment muscle cells and fibers. We evaluated our pipeline on real experiment image sets and showed consistent reliability across images and conditions. TRUEFAD development makes possible systematical and rapid screening of substances impacting muscle morphology for helping scientists focus on their hypothesis rather than image analysis.


Conflict of interest statement

The authors declare no competing interests.

Figures

Figure 1
Figure 1
TRUEFAD Cells workflow. (a), Scaling image to 512 × 512 pixels from native 8-bit phase contrast images. (b), Deep Learning (DL) prediction obtained with DeepImageJ from the scaling image. (c), Post-processing steps apply to the DL prediction image. (d), ROIs and measurement export obtained at the end of the post-processing step.
Figure 2
Figure 2
TRUEFAD Cells metrics. (a), Five manually measured diameters commonly done on five C2C12 myotubes per image (left panel) compare to nine systematically made diameters by TRUEFAD Cells on each detected myotube. (b), Number of myotubes detected by TRUEFAD Cells on 100 images or following a conventional manual analysis. (c), Percentage of correct myotube’s identification by TRUEFAD Cells (Violin plot with median, n = 7293 myotubes assessed on 100 Images). (d), Variability in mean diameter measurement across 10 experimenters for five selected myotubes compared to TRUEFAD Cells, the center line of boxplot indicates the median value. (e), Assessment of Dice coefficient quality of TRUEFAD Cells segmentation versus Ground Truth (Violin plot with median, n = 50 myotubes). (f), Correlation between mean manual and TRUEFAD diameters measurements on images from 28 experiments.
Figure 3
Figure 3
Application of TRUEFAD Cells to study myotube morphology during differentiation and upon exposure to IGF-1 or dexamethasone. (a), Myotubes detected by TRUEFAD Cells during differentiation of C2C12 cells (n = 10 images per day on n = 6 technical replicates). (b), Number of detected and (c), myotubes mean myotube diameter at day 2 (D2), 3 (D3), 4 (D4) and 5 (D5) of cell differentiation. The centerline of the boxplot indicates the median value (n = 6 replicates). (d), Heatmap representation of the distribution of C2C12 myotube diameters after exposure to Dexamethasone (DEXA) at 10−6 M for 48 h (s.e.m. ± 0.12, n = 9 independent experiments on a total of 2998 and 3559 myotubes in CTRL and DEXA condition respectively, ***p < 0.001). (e), Heatmap representation of the distribution of C2C12 myotube diameters after treatment with IGF1 at 50 nM for 48 h (s.e.m. ± 0.12, n = 8 independent experiments on a total of 1610 and 1646 myotubes in CTRL and IGF1 condition respectively, *p < 0.05). One-way ANOVA with multiple comparisons was performed in (b) and (c), with statistical differences identified with different letters. Paired student t test was performed in (d) and (e).
Figure 4
Figure 4
Workflow of TRUEFAD Histo. (a) Representative laminin immunostaining image. (b), Laminin segmentation processing using directional filters followed by local contrast adjustment and marker-imposed watershed segmentation. (c), Representatives images of fiber type I and IIA immunostaining and the ROI composite map export generated by TRUEFAD histo. (d), Quantification of gray value intensity for each fiber on each immunostaining images and fiber type classification (Type I, Type IIA and Type IIB + IIX).
Figure 5
Figure 5
TRUEFAD Histo reliability. (a) Representative results of laminin segmentation from SMASH, OpenCSAM, Muscle J, Cellpose, and TRUEFAD tools from the same raw original image. (b) TRUEFAD Histo reliability in scale-down images. (c) Percentage of fibers incorrectly segmented according to image resolution (n = 15 images). (d) Number of fibers identified by TRUEFAD Histo and manually-supervised open-CSAM. (e) Quantification of TRUEFAD Histo segmentation errors on 117 images (n = 25 muscles for a total of 50,483 fibers, left panel) and percentage of correct assignment of fiber type among the 48,918 identified fibers (right panel). (f) Correlation between manually supervised open-CSAM cross-sectional area (CSA) measurement according to type and TRUEFAD results. Error bars in (d) and (e), are s.e.m. One-way ANOVA with multiple comparisons were performed on resolution data shown as boxplots in c, with different letters indicating statistical differences. Pearson correlation test in (f) was calculated with each point corresponding to a single individual (sum of data from 5 to 7 different fields).

References

    1. Baracos, V. E., Martin, L., Korc, M., Guttridge, D. C. & Fearon, K. C. H. Cancer-associated cachexia. Nat. Rev. Dis. Primer4, 17105 (2018).10.1038/nrdp.2017.105 - DOI - PubMed
    1. Loosen, S. H. et al. Skeletal muscle composition predicts outcome in critically Ill patients. Crit. Care Explor.2, e0171 (2020). 10.1097/CCE.0000000000000171 - DOI - PMC - PubMed
    1. Pinto, F. C. S. et al. Function over mass: A meta-analysis on the importance of skeletal muscle quality in COVID-19 patients. Front. Nutr.9, 837719 (2022). 10.3389/fnut.2022.837719 - DOI - PMC - PubMed
    1. Stewart, G. J. The Skeletal and Muscular Systems (Facts on File, Incorporated, 2009).
    1. Mukund, K. & Subramaniam, S. Skeletal muscle: A review of molecular structure and function, in health and disease. Wiley Interdiscip. Rev. Syst. Biol. Med.12, e1462 (2020). 10.1002/wsbm.1462 - DOI - PMC - PubMed

LinkOut - more resources