. 2024 Feb 7;14(1):3151.
doi: 10.1038/s41598-024-53578-z.

Embryo-endometrial interaction associated with the location of the embryo during the mobility phase in mares

Affiliations

Embryo-endometrial interaction associated with the location of the embryo during the mobility phase in mares

Thadeu de Castro et al. Sci Rep. .

Abstract

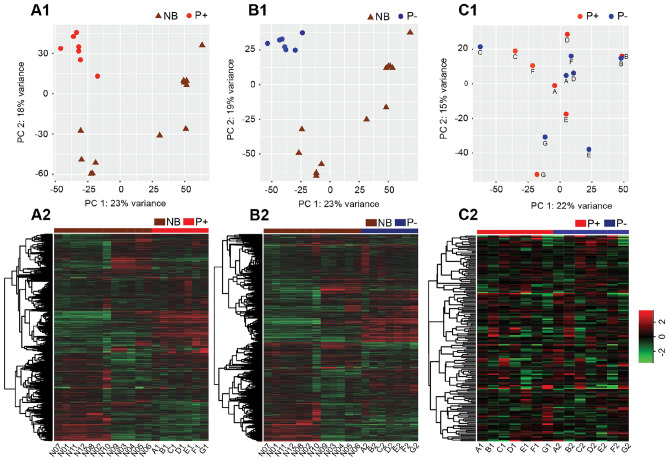
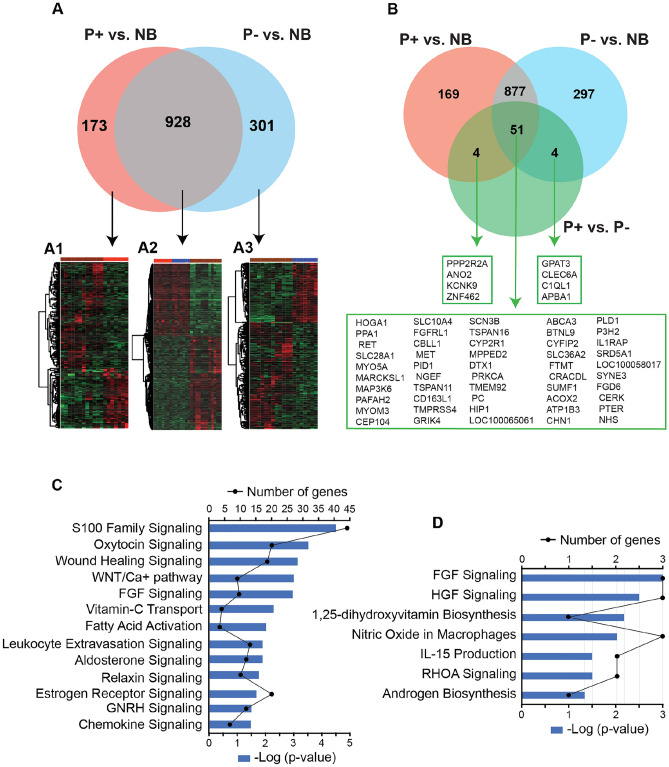
Embryo-maternal crosstalk is essential to establish pregnancy, with the equine embryo moving throughout the uterus on days 9-15 (ovulation = day 0) as part of this interaction. We hypothesized that the presence of a mobile embryo induces local changes in the gene expression of the endometrium. On Day 12, the endometrial transcripts were compared among three groups: uterine horn with an embryo (P+, n = 7), without an embryo (P-, n = 7) in pregnant mares, and both uterine horns of nonbred mares (NB, n = 6). We identified 1,101 differentially expressed genes (DEGs) between P+ vs. NB and 1,229 DEGs between P- vs. NB. The genes upregulated in both P+ and P- relative to NB were involved in growth factor pathway and fatty acid activation, while downregulated genes were associated with oxytocin signaling pathway and estrogen receptor signaling. Comparing the transcriptome of P+ to that of P-, we found 59 DEGs, of which 30 genes had a higher expression in P+. These genes are associated with regulating vascular growth factors and the immune system, all known to be essential in early pregnancy. Overall, this study suggests that the mobile embryo influences the endometrial gene expression locally.


Conflict of interest statement

The authors declare no competing interests.

Figures

Figure 1
Figure 1
Principal component analysis (PCA) and heatmap. (A1) PCA and (A2) heatmap in P+ vs. NB; (B1) PCA and (B2) heatmap in P− vs. NB; (C1) PCA and (C2) heatmap in P+ vs. P−. There is a clear clustering between pregnant (P+ and P−) and NB groups. P+, uterine horn with the embryo; P−, uterine horn without the embryo; NB, nonbred. Each letter (A-G) in PCA and Heatmap corresponds to each mare. Graphs were generated using the ggplot2 package in R.
Figure 2
Figure 2
Volcano plot and the most significant upregulated and downregulated canonical pathways in P+ vs. NB and P− vs. NB. The red dots represent the DEGs genes with adjusted p-value < 0.05 and log2 fold change; The green dots represent the genes with adjusted p-value > 0.05 and log2 fold change; The blue dots represent the genes with adjusted p-value < 0.05 and log2 fold change; The gray dots represent the genes with adjusted p-value > 0.05 and log2 fold change. P+, uterine horn with the embryo; P−, uterine horn without the embryo; NB, nonbred. The pathways originated in the Ingenuity Pathway Analysis (IPA) software (Qiagen).
Figure 3
Figure 3
Venn diagram displaying the overlapping DEGs. (A) overlapping DEGs among P+ vs. NB and P− vs. NB; (A1) Heatmap from 173 genes only expressed P+ vs. NB; (A2) Heatmap from the 928 common genes between P+ vs. NB and P− vs. NB; (A3) Heatmap from 301 genes only expressed in P− vs. NB; (B) overlapping DEGs among P+ vs. NB, P− vs. NB, and P+ vs. P− [heatmaps were generated using the ggplot2 package in R]; (C) The most significant canonical pathways from the 928 genes common between P+ vs. NB and P− vs. NB; (D) The most significant canonical pathways from the 50 genes common among P+ vs. NB, P− vs. NB, and P+ vs. P−. P+, uterine horn with the embryo; P−, uterine horn without the embryo; NB, nonbred.
Figure 4
Figure 4
The oxytocin canonical pathway originates in the Ingenuity Pathway Analysis (IPA) software (Qiagen). The green arrows indicate the downregulation of the genes in both pregnant groups relative to the nonbred group (P+ vs. NB and P− vs. NB). The blue color indicates the prediction of downregulation of the genes (KCNT2, EGFR, and PTGS2) or inhibition of the hormone (PGF2α). OXTR, oxytocin receptor; KCNT2, potassium sodium-activated channel subfamily T member 2; EGFR, epidermal growth factor receptor; PTGFR, prostaglandin F receptor; PLCB1, phospholipase C beta 1; PLA2G2A, phospholipase A2 group IIA; PLA2G2D, phospholipase A2 group IID; MAPK12, mitogen-activated protein kinase 12; GNG3, G protein subunit gamma 3; GNG4, G protein subunit gamma; SHC, SHC adaptor protein; SHC3, adaptor protein 3; PTGS2, prostaglandin-endoperoxide synthase 2; PGF2α, prostaglandin F2α.

References

    1. Neely, D. P., Liu, I. K. & Hillman, R. B. Equine Reproduction. (Hoffmann-La Roche Inc., New Jersey., 1983).
    1. Douglas RH, Ginther OJ. Concentration of prostaglandins F in uterine venous plasma of anesthetized mares during the estrous cycle and early pregnancy. Prostaglandins. 1976;11:251–260. doi: 10.1016/0090-6980(76)90148-9. - DOI - PubMed
    1. Hershman L, Douglas RH. The critical period for the maternal recognition of pregnancy in pony mares. J. Reprod. Fertil. Suppl. 1979;1:395–401. - PubMed
    1. Stout TAE. Embryo-maternal communication during the first 4 weeks of equine pregnancy. Theriogenology. 2016;86:349–354. doi: 10.1016/j.theriogenology.2016.04.048. - DOI - PubMed
    1. Jacob JC, et al. Effect of embryo age and recipient asynchrony on pregnancy rates in a commercial equine embryo transfer program. Theriogenology. 2012;77:1159–1166. doi: 10.1016/j.theriogenology.2011.10.022. - DOI - PubMed