. 2024 Feb 7;14(1):3134.
doi: 10.1038/s41598-024-53591-2.

Into the Holocene, anatomy of the Younger Dryas cold reversal and preboreal oscillation

Affiliations

Into the Holocene, anatomy of the Younger Dryas cold reversal and preboreal oscillation

Jesse Velay-Vitow et al. Sci Rep. .

Abstract

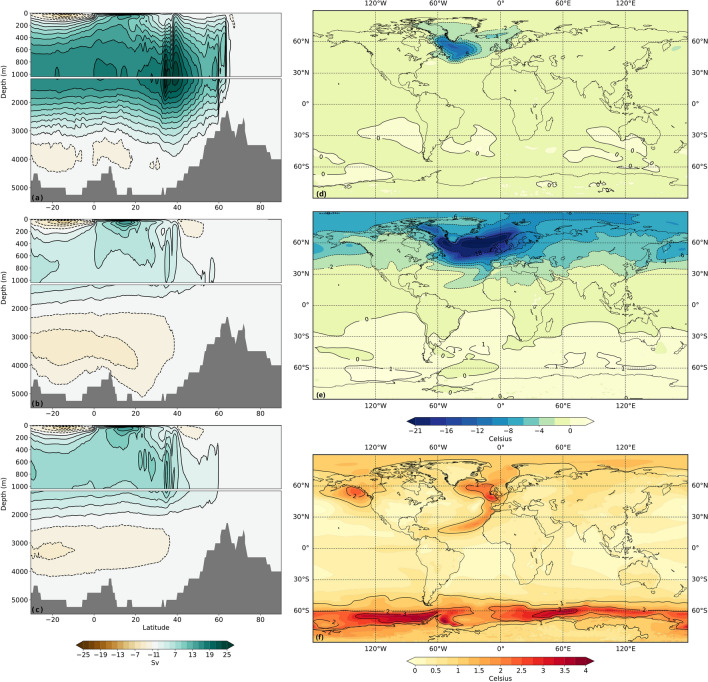
During the most recent deglaciation, the upwards trend of warmer Northern Hemisphere (NH) temperatures was punctuated by a rapid and intense return to glacial conditions: the Younger Dryas (YD). The end of this event marks the beginning of the Holocene. Using the University of Toronto version of CCSM4, a model of the climate prior to the YD was created with correct boundary conditions. Various amounts of freshwater forcing were then applied to the Beaufort Gyre for forcing intervals ranging from 1 to 125 years. In several cases, this was sufficient to collapse the Atlantic Meridional Overturning Circulation (AMOC) and cause significant cooling over the NH. Crucially, after the forcing was ceased, the AMOC stayed in an off state for approximately a millennium before mounting a rapid recover to pre-YD levels. This recovery, which permanently reduced the extent of NH sea ice, occurred through the mechanism of a Polynya opening in the Irminger Sea during winter and led to a pronounced "overshoot" of the AMOC, during which NH temperatures were higher than before the YD.


Conflict of interest statement

The authors declare no competing interests.

Figures

Figure 1
Figure 1
The rapid onset of and recovery from the YD is depicted by the time series of AMOC strength. The recovery occurs in precisely the same manner as in the recovery from cold stadial to warm interstadial conditions in a Dansgaard–Oeschger oscillation. Shown here in panel (a), the sea ice is at its maximum extent after the AMOC has collapsed following the injection of fresh water over the Beaufort Gyre. In panels (bd) a polynya is seen to open rapidly in the Irminger Sea Basin. Finally, in panel (e), the sea ice extent is seen to be dramatically reduced after AMOC recovery. Terrestrial ice thickness is shown alongside sea ice percentage and, where applicable, mixed layer depth. Panel (f) shows the strength of the AMOC with dashed red lines indicating the times of the previously described panels. In panel (g) the comparison of model surface temperature and surface temperature inferred from the NGRIP ice core is presented. We show both the HF0.2_100 (solid red) and HF0.125_115 (dashed magenta) to illustrate that under different conditions our model is able to collapse at variable rates, but regardless of when collapse occurs, the duration for which the AMOC remains in a collapsed state is the same. In this figure, we move HF0.2_100 forward by 100 years to align the collapse with that of HF0.125_115. Image generated with Matlab 2020b.
Figure 2
Figure 2
AMOC strengths (a,b), northern hemisphere sea ice areas (c,d) and global mean surface temperatures (e,f) in selected YD models with different forcing scenarios. The left column shows the response of our climate model in the ‘Low and Slow’ forcing scenario to a 0.05 Sv and 0.1 Sv forcing applied for 800 years. The right column shows the response in the ‘Hard and Fast’ scenario when either a 0.15 Sv or 0.2 Sv forcing is applied for 100 years. The forcing intervals are highlighted in blue. Panel (g) shows the AMOC response in all our ‘Hard and Fast’ forcing simulations that result in a collapse of the AMOC. In all simulations, the freshwater forcing was applied in the Beaufort Sea with strength and duration as indicated in the simulation name in the legend and in Table 1. After collapsing all simulations seem to follow an identical trajectory towards AMOC recovery that is characterized by the opening of a polynya in the Irminger Sea and a sharp increase in the AMOC strength.
Figure 3
Figure 3
AMOC streamfunctions in (a) LS0.1 (years 2501–2700), and in HF0.2_100 (b) immediately after the termination of freshwater forcing (years 2401–2600) and (c) immediately before the transition from the off-state to the on state (years 3101–3300). In the HF0.2_100, and in other HF simulations that collapse, the NADW formation comes to a halt leading to the disappearance of the top overturning cell. A shallow residual overturning circulation remains that largely arises from the surface wind forcing and the counter-clockwise rotation of a now stronger and expansive bottom cell. Over the  1000-year shut-down of the AMOC, the top cell begins to strengthen. Temperature anomalies with the pre-industrial are also shown for (d) LS0.1 (years 2501–2700) and (e) HF0.2_100 (years 2401–2600). (f) shows the temperature anomaly between years 3101–3300 and 2401–2600 of HF0.2_100. Image generated with Panoply 5.0.5.
Figure 4
Figure 4
In panels (A) through (D), the strength of the AMOC is shown before collapse (model year 2301), after collapse (model year 2400), during peak overshoot (model year 3400), and after recovery (model year 3900). In panels (E) through (H) the surface temperature is shown at the same points as the first part of the figure. Image generated with Panoply 5.0.5.

References

    1. Peteet, D. Global Younger Dryas?. Quatern. Int.28, 93–104. 10.1016/1040-6182(95)00049-o (1995).10.1016/1040-6182(95)00049-o - DOI
    1. Hartz, N. & Milthers, V. Det senglaciale ler i Allerod Teglvaerksgrav. Meddelelser Danmarks Geol. Forening8, 31–59 (1901).
    1. Fairbanks, R. G. A 17,000-year glacio-eustatic sea level record: Influence of glacial melting rates on the Younger Dryas event and deep-ocean circulation. Nature342, 637–642. 10.1038/342637a0 (1989).10.1038/342637a0 - DOI
    1. Peltier, W. R. & Fairbanks, R. G. Global glacial ice volume and Last Glacial Maximum duration from an extended Barbados sea level record. Quatern. Sci. Rev.25, 3322–3337. 10.1016/j.quascirev.2006.04.010 (2006).10.1016/j.quascirev.2006.04.010 - DOI
    1. Bard, E., Hamelin, B. & Delanghe-Sabatier, D. Deglacial meltwater pulse 1B and Younger Dryas sea levels revisited with Boreholes at Tahiti. Science327, 1235–1237. 10.1126/science.1180557 (2010). 10.1126/science.1180557 - DOI - PubMed

LinkOut - more resources