. 2024 Mar;9(3):751-762.
doi: 10.1038/s41564-023-01589-3. Epub 2024 Feb 7.

Genome-wide association study identifies human genetic variants associated with fatal outcome from Lassa fever

Dylan Kotliar #  1   2   3 Siddharth Raju #  4   5 Shervin Tabrizi #  4   6   7 Ikponmwosa Odia #  8 Augustine Goba  9 Mambu Momoh  9   10 John Demby Sandi  9 Parvathy Nair  11 Eric Phelan  12 Ridhi Tariyal  13 Philomena E Eromon  8   14 Samar Mehta  15 Refugio Robles-Sikisaka  16 Katherine J Siddle  4 Matt Stremlau  17 Simbirie Jalloh  9 Stephen K Gire  13 Sarah Winnicki  4 Bridget Chak  18 Stephen F Schaffner  4   19   20 Matthias Pauthner  21 Elinor K Karlsson  4   22   23 Sarah R Chapin  4 Sharon G Kennedy  4   24 Luis M Branco  25 Lansana Kanneh  26 Joseph J Vitti  4 Nisha Broodie  27 Adrianne Gladden-Young  28 Omowunmi Omoniwa  29 Pan-Pan Jiang  30 Nathan Yozwiak  31 Shannon Heuklom  32 Lina M Moses  33 George O Akpede  8   34 Danny A Asogun  35 Kathleen Rubins  36 Susan Kales  37 Anise N Happi  14 Christopher O Iruolagbe  38 Mercy Dic-Ijiewere  38 Kelly Iraoyah  38 Omoregie O Osazuwa  38 Alexander K Okonkwo  38 Stefan Kunz  39 Joseph B McCormick  40 S Humarr Khan  9 Anna N Honko  41 Eric S Lander  4   5   42 Michael B A Oldstone  16 Lisa Hensley  43 Onikepe A Folarin  14   44 Sylvanus A Okogbenin  8 Stephan Günther  45 Hanna M Ollila  4   46   47   48 Ryan Tewhey  37 Peter O Okokhere  8   34   38 John S Schieffelin  49 Kristian G Andersen  16 Steven K Reilly  50 Donald S Grant  9   26 Robert F Garry  51 Kayla G Barnes  4   20   52   53 Christian T Happi  54   55   56 Pardis C Sabeti  57   58   59   60   61   62
Affiliations

Genome-wide association study identifies human genetic variants associated with fatal outcome from Lassa fever

Dylan Kotliar et al. Nat Microbiol. 2024 Mar.

Abstract

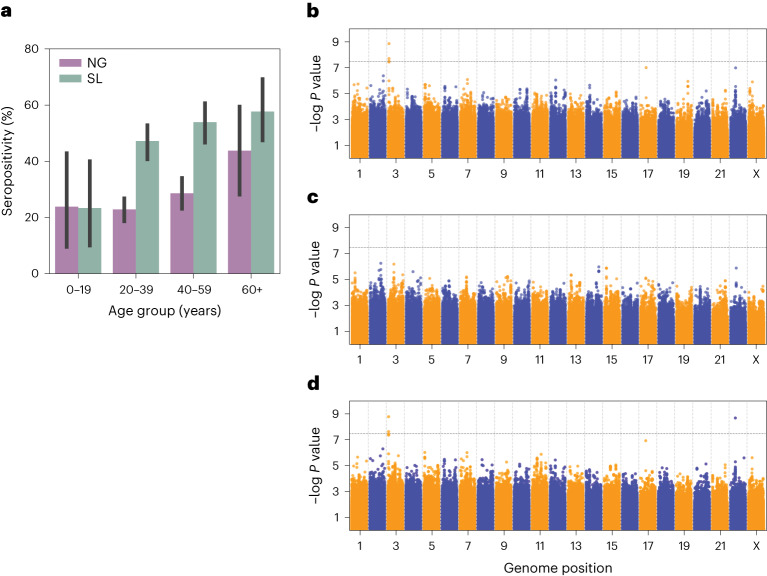
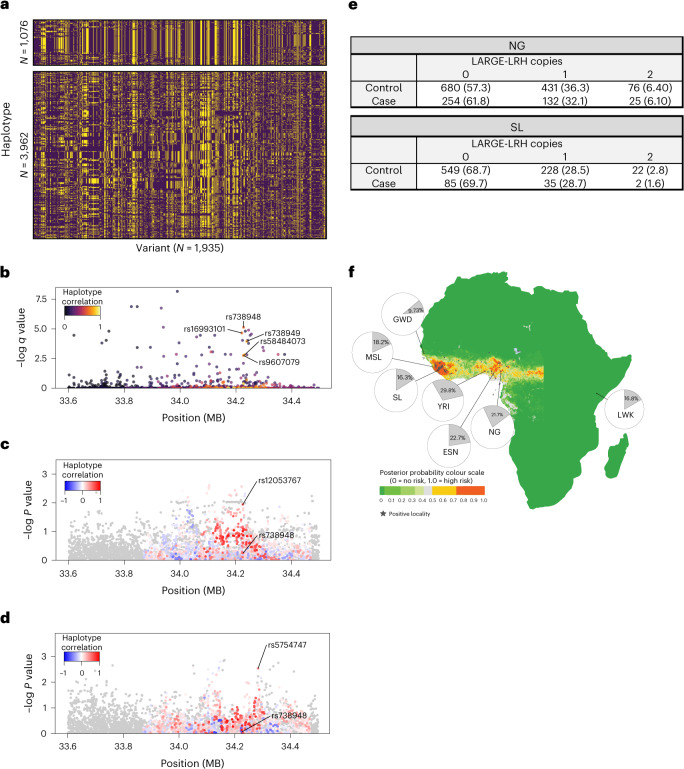
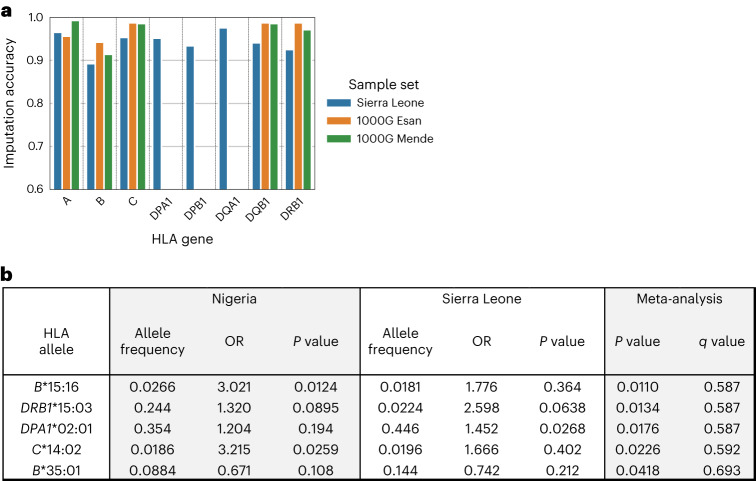
Infection with Lassa virus (LASV) can cause Lassa fever, a haemorrhagic illness with an estimated fatality rate of 29.7%, but causes no or mild symptoms in many individuals. Here, to investigate whether human genetic variation underlies the heterogeneity of LASV infection, we carried out genome-wide association studies (GWAS) as well as seroprevalence surveys, human leukocyte antigen typing and high-throughput variant functional characterization assays. We analysed Lassa fever susceptibility and fatal outcomes in 533 cases of Lassa fever and 1,986 population controls recruited over a 7 year period in Nigeria and Sierra Leone. We detected genome-wide significant variant associations with Lassa fever fatal outcomes near GRM7 and LIF in the Nigerian cohort. We also show that a haplotype bearing signatures of positive selection and overlapping LARGE1, a required LASV entry factor, is associated with decreased risk of Lassa fever in the Nigerian cohort but not in the Sierra Leone cohort. Overall, we identified variants and genes that may impact the risk of severe Lassa fever, demonstrating how GWAS can provide insight into viral pathogenesis.


Conflict of interest statement

P.C.S., R. Tewhey and S.K.R. are inventors on patents related to massively parallel reporter assays. P.C.S. is a co-founder of, shareholder in and consultant to Sherlock Biosciences, Inc. and Delve Bio, as well as a Board member of and shareholder in Danaher Corporation. The other authors declare no competing interests.

Figures

Fig. 1
Fig. 1. Overview of hypothesized mechanism of positive selection for resistance to Lassa fever mediated by LARGE1.
a, Statistical evidence for positive selection at the LARGE1 locus, adapted from Andersen et al.. The y axis shows the composite likelihood score which integrates evidence of positive selection based on population differentiation (fixation index), long haplotype (integrated haplotype score, delta integrated haplotype score, cross-population extended haplotype homozygosity) and derived allele frequency. On the figure, p refers to the short arm of the chromosome, while q refers to the long arm. See Andersen et al. for details. b, Hypothesized mechanism by which decreased activity of LARGE1 increases resistance to LASV infection and Lassa fever.
Fig. 2
Fig. 2. GWAS of Lassa fever clinical outcome.
a, Immunoglobulin G seropositivity rate in Nigerian (NG) and Sierra Leonean (SL) controls stratified by age. Error bars represent 95% bootstrap confidence intervals. NG: N of 24 in 0–19 years, 424 in 20–39 years, 269 in 40–59 years and 34 in 60+ years. SL: N of 33 in 0–19 years, 282 in 20–39 years, 191 in 40–59 years and 83 in 60+ years. bd, Manhattan plots showing the −log P value for each genomic variant for the Lassa fever outcome association for Nigeria (b), Sierra Leone (c) and meta-analysis (d). P values for b and c are based on SAIGE, while P values for d are derived from meta-analysis (METAL) of P values shown in b and c.
Fig. 3
Fig. 3. Association of the LARGE-LRH haplotype with susceptibility to Lassa fever.
a, K-means clustering of haplotypes in the LARGE1 region. Rows are phased haplotypes; columns are individual variants with reference alleles shown in purple, alternate alleles shown in yellow and K-means clusters separated. b, Scatter plot of q values for allelic skew in the MPRA, coloured by the absolute value of the Pearson correlation with the haplotype. c,d, Scatter plot of GWAS association P values over the LARGE1 region for Nigeria (c) and Sierra Leone (d) coloured by Pearson correlation of the protective allele in the GWAS with the LARGE-LRH. P values in c and d are based on SAIGE. e, Contingency table of LARGE-LRH genotype counts in cases and controls for Nigeria (NG, top) and Sierra Leone (SL, bottom). f, Ecologically estimated Lassa fever prevalence from Fichet-Calvet et al. with pie charts indicating the frequency of the LARGE1 haplotype in 1000 Genomes populations (YRI, Yoruba; ESN, Esan; MSL, Mende; LWK, Luhya; GWD, Gambian Mandinka) or our GWAS cohorts (NG, SL). Stars indicate towns, villages or hospitals that encountered outbreaks as detailed in Fichet-Calvet et al..
Fig. 4
Fig. 4. Association of HLA variation with Lassa fever susceptibility.
a, Imputation accuracy of four-digit HLA calls compared to sequencing-based ground truth sets from our Sierra Leone cohort, as well as Esan and Mende individuals from 1000 Genomes. b, Table of HLA alleles with the strongest association with Lassa fever susceptibility, ordered by meta-analysis of the NG and SL cohorts. P values are based on SAIGE, while meta-analysis P values are derived from meta-analysis (METAL) of P values generated from each cohort. ORs are computed from Firth logistic regression.
Extended Data Fig. 1
Extended Data Fig. 1. Timeline of cohort recruitment in each country.
Breakdown of enrolled patients by country, cohort, and disease status.
Extended Data Fig. 2
Extended Data Fig. 2. Quality control analyses for the susceptibility GWAS.
(A) Histogram of ages in the Nigeria and Sierra Leone cohorts, separated by case/control status. (B) Histogram of the maximum relatedness coefficient between each individual and all other individuals in the Nigerian (NG) and Sierra Leonean (SL) cohorts. (C) Principal component analysis (PCA) of the NG and SL cohorts, colored by case-control status. PCs were computed on unrelated individuals and then all individuals were projected onto those components (Methods). (D) Quantile-quantile plots of -log10 P-values from the susceptibility GWAS against expected quantiles. (E) Manhattan plots showing the -log10 P-value for each genomic variant for the LF susceptibility associations. P-values in D and E are based on saddlepoint-approximated score tests (SAIGE), while meta-analysis P-values are derived from meta-analysis (METAL) of P-values generated from each cohort.
Extended Data Fig. 3
Extended Data Fig. 3. Quality control analyses for the GWAS of LF clinical outcome.
(A) Principal component analysis (PCA) of the NG and SL cohorts, colored by clinical outcome. PCs were computed on unrelated individuals, and then all individuals were projected onto those components. (B) Quantile-quantile plots of -log10 P-values from the outcome GWAS against expected quantiles. (C) Comparison of the outcome GWAS lead variants with and without inclusion of age as a covariate. P-values in B and C are based on saddlepoint-approximated score tests (SAIGE), while meta-analysis P-values are derived from meta-analysis (METAL) of P-values generated from each cohort. Odds ratios are computed from Firth logistic regression.
Extended Data Fig. 4
Extended Data Fig. 4. MPRA analyses of the susceptibility and outcome GWAS peaks.
(A) Scatter plot of lead susceptibility GWAS loci described in the main text showing chromosomal position against -log10 association P-value. Variants are colored by the linkage disequilibrium (LD) coefficient of determination R2 between each variant and the most significant ‘lead’ variant in the locus. (B) Same as A but for the lead variants in the fatal outcome GWAS. (CF) Same as A and B but colored by whether the variant showed statistically significant skew (q-value < 0.05) in the massively parallel reporter assay in the K562 cell line (C and E) or HepG2 cell line (D and F). P-values are based on saddlepoint-approximated score tests (SAIGE), while meta-analysis P-values are derived from meta-analysis (METAL) of P-values generated from each cohort.
Extended Data Fig. 5
Extended Data Fig. 5. LARGE1 haplotype association by recruitment period.
(A, B) Frequencies of the long-range LARGE1 haplotype by the period of recruitment as well as by case-control status for Nigeria (A) and Sierra Leone (B). P-values are from mixed logistic models association testing within the indicated recruitment period. Error bars represent 95% bootstrap confidence intervals for allele frequency. N for each cohort within each country is defined in Table S2.

References

    1. Merson L, et al. Clinical characterization of Lassa fever: a systematic review of clinical reports and research to inform clinical trial design. PLoS Negl. Trop. Dis. 2021;15:e0009788. doi: 10.1371/journal.pntd.0009788. - DOI - PMC - PubMed
    1. Kenmoe S, et al. Systematic review and meta-analysis of the epidemiology of Lassa virus in humans, rodents and other mammals in sub-Saharan Africa. PLoS Negl. Trop. Dis. 2020;14:e0008589. doi: 10.1371/journal.pntd.0008589. - DOI - PMC - PubMed
    1. McCormick JB, Fisher-Hoch SP. Lassa fever. Curr. Top. Microbiol. Immunol. 2002;262:75–109. - PubMed
    1. Okogbenin S, et al. Retrospective cohort study of Lassa fever in pregnancy, southern Nigeria. Emerg. Infect. Dis. 2019;25:1494–1500. doi: 10.3201/eid2508.181299. - DOI - PMC - PubMed
    1. Happi AN, et al. Increased prevalence of Lassa fever virus-positive rodents and diversity of infected species found during human Lassa fever epidemics in Nigeria. Microbiol. Spectr. 2022;10:e0036622. doi: 10.1128/spectrum.00366-22. - DOI - PMC - PubMed