. 2024 Feb;626(8000):859-863.
doi: 10.1038/s41586-023-06990-w. Epub 2024 Feb 7.

Bile salt hydrolase catalyses formation of amine-conjugated bile acids

Affiliations

Bile salt hydrolase catalyses formation of amine-conjugated bile acids

Bipin Rimal et al. Nature. 2024 Feb.

Abstract

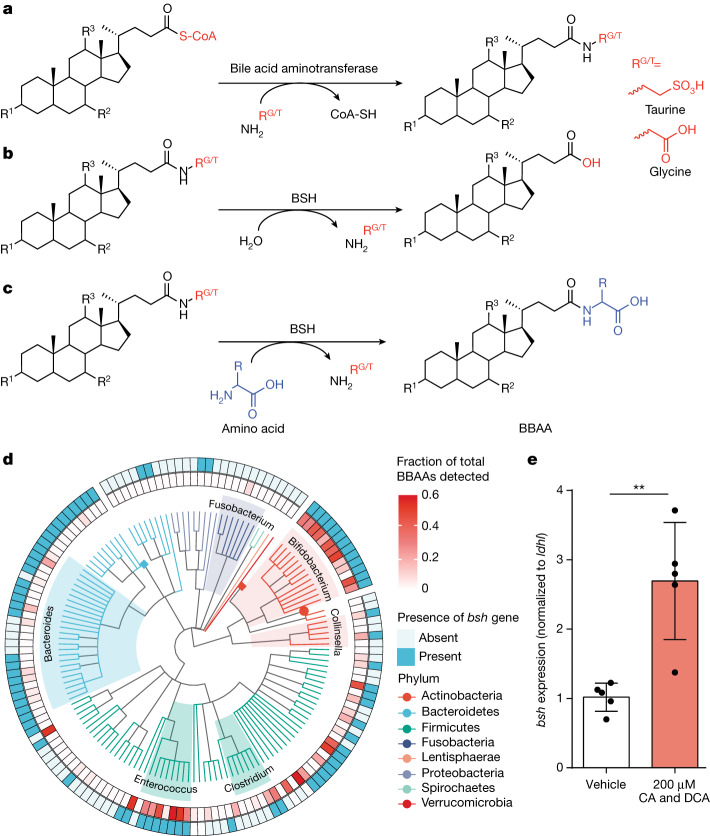
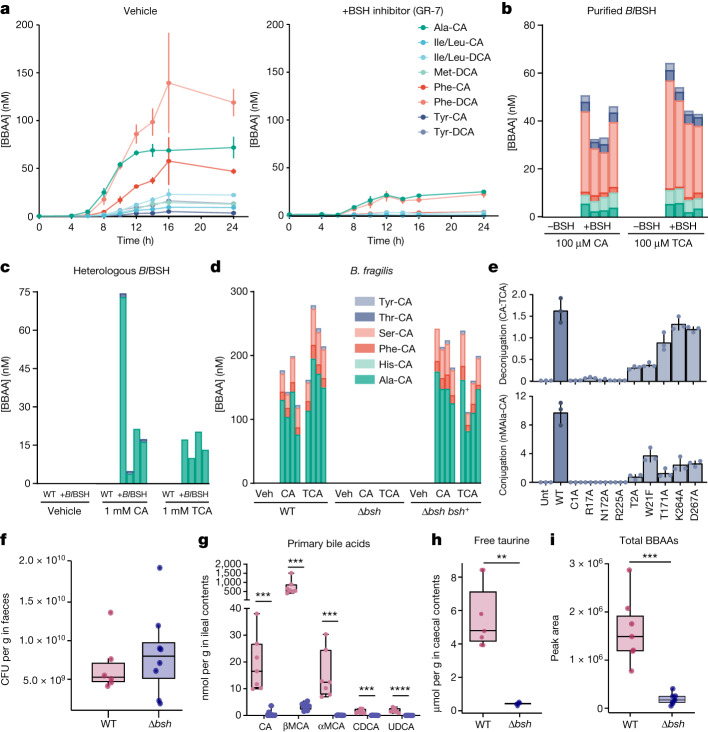
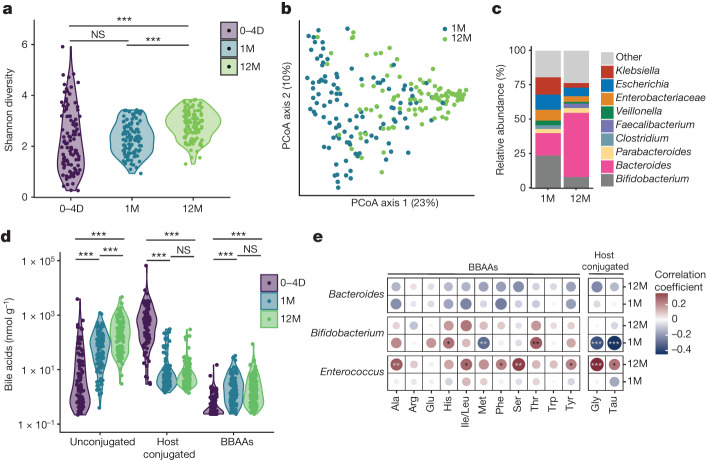
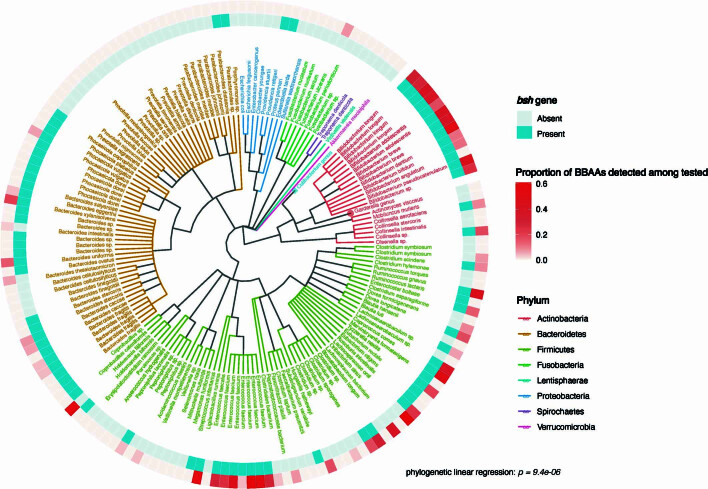
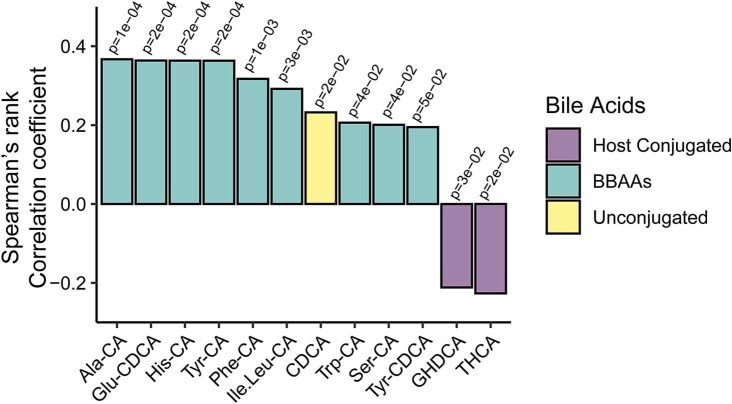
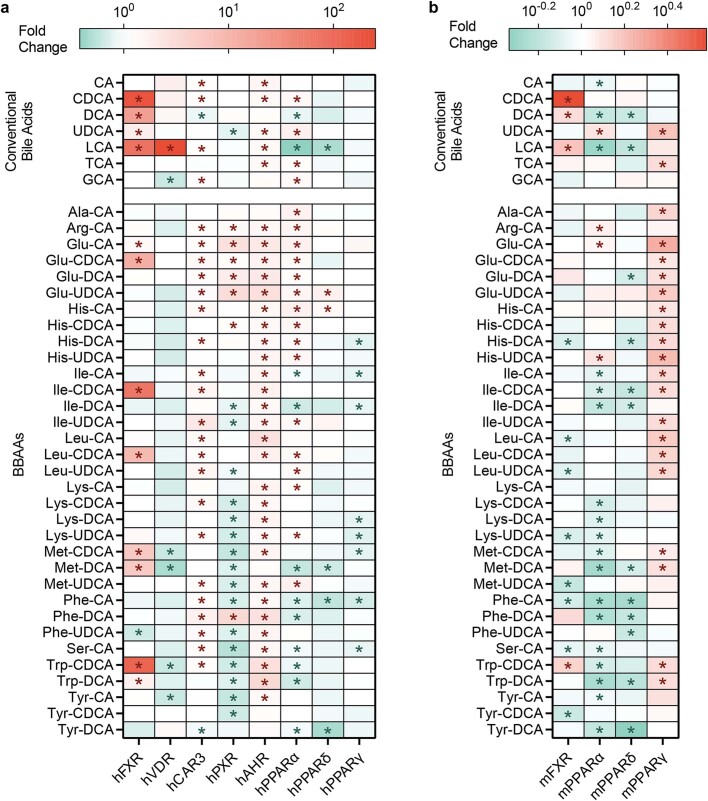
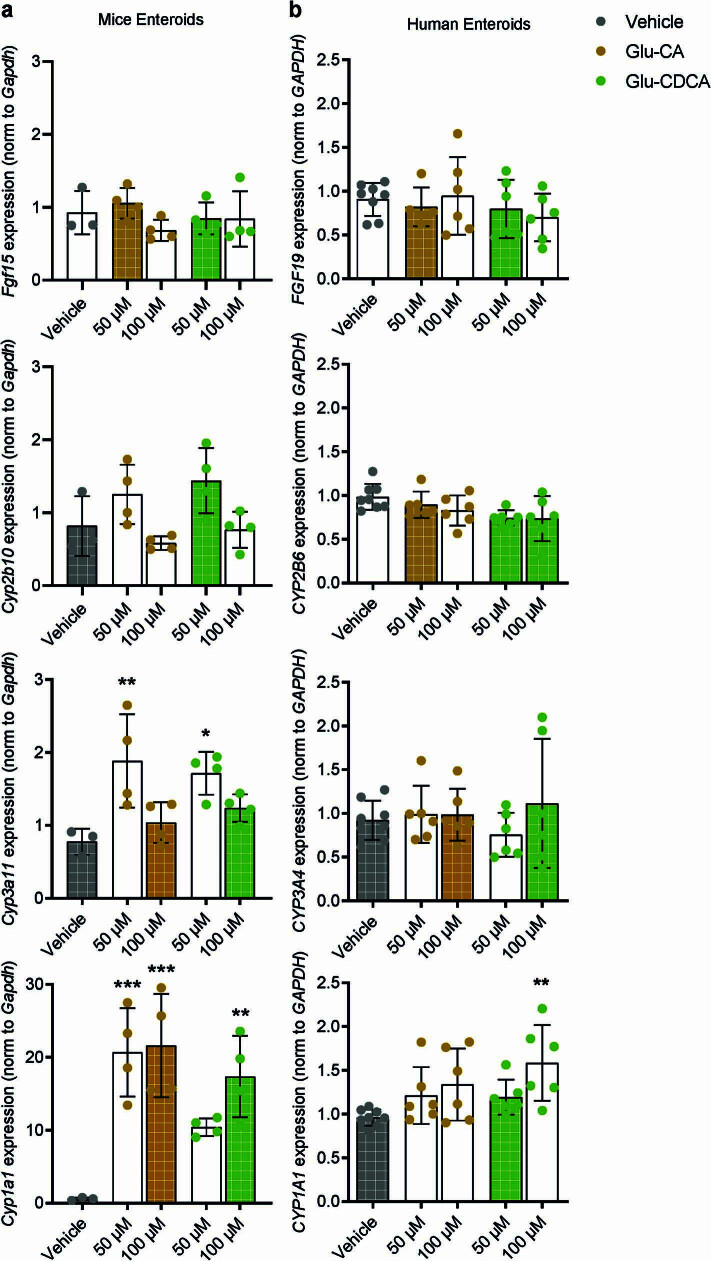
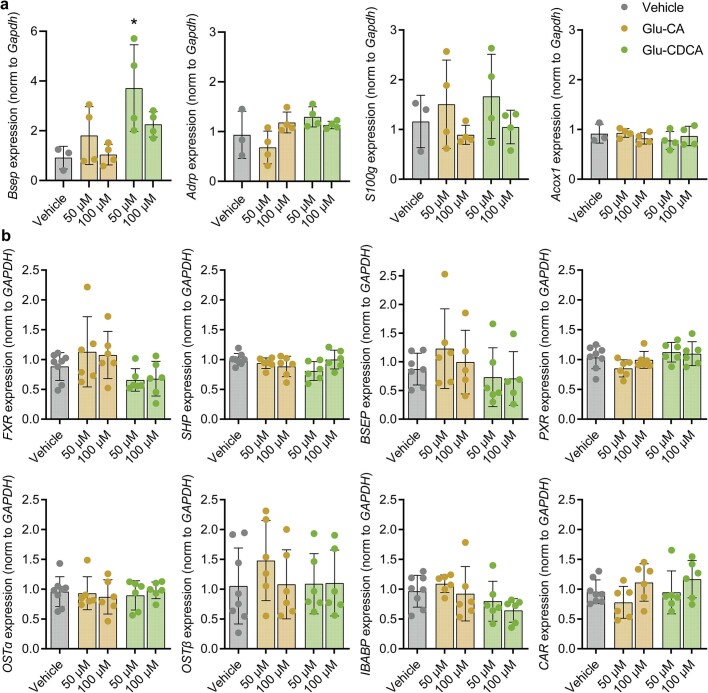
Bacteria in the gastrointestinal tract produce amino acid bile acid amidates that can affect host-mediated metabolic processes1-6; however, the bacterial gene(s) responsible for their production remain unknown. Herein, we report that bile salt hydrolase (BSH) possesses dual functions in bile acid metabolism. Specifically, we identified a previously unknown role for BSH as an amine N-acyltransferase that conjugates amines to bile acids, thus forming bacterial bile acid amidates (BBAAs). To characterize this amine N-acyltransferase BSH activity, we used pharmacological inhibition of BSH, heterologous expression of bsh and mutants in Escherichia coli and bsh knockout and complementation in Bacteroides fragilis to demonstrate that BSH generates BBAAs. We further show in a human infant cohort that BBAA production is positively correlated with the colonization of bsh-expressing bacteria. Lastly, we report that in cell culture models, BBAAs activate host ligand-activated transcription factors including the pregnane X receptor and the aryl hydrocarbon receptor. These findings enhance our understanding of how gut bacteria, through the promiscuous actions of BSH, have a significant role in regulating the bile acid metabolic network.


Conflict of interest statement

P.C.D. is an advisor to and holds equity in Cybele and is a scientific cofounder of, is an advisor to and holds equity in Ometa, Armome and Enveda, with previous approval by the University of California San Diego. J.V.H. is cofounder and chief scientific officer of INDIGO Biosciences, Inc., with previous approval from Penn State University. The other authors declare no competing interests.

Figures

Fig. 1
Fig. 1. Amidation and de-amidation reactions of bile acids are associated with bacterial bsh.
a, Bile acid–CoA:amino acid N-acyltransferase activity with the substrate depicted as a general bile acid structure modified with CoA. b, Deconjugation reaction by bacterial BSH of host-derived GCA or TCA. c, The BSH amino acid N-acyltransferase activity characterized in this study, with the conjugated bile acids GCA and TCA as examples. This activity leads to the biosynthesis of BBAAs. ac, R1–R3 represent potential sites of backbone hydroxylation; RG/T represents glycine and taurine. d, Correlation between presence or absence of the bsh gene with the ability of various bacterial taxa to produce BBAAs. e, RT-qPCR of B. longum NCTC 11818 supplemented with 200 μM each of CA and DCA. Expression of bsh was compared to vehicle using the 2∆∆Ct method normalized to the reference gene ldhl, and significance was determined using a two-tailed t-test (P = 0.0026**). Bar plots designate the mean ± s.d., n = 5. Source Data
Fig. 2
Fig. 2. Bacterial BSH has bile acid amine N-acyltransferase activity.
a, The pan-BSH inhibitor GR-7 attenuates conjugated bile acid production in B. longum NCTC 11818 cultures. Mean BBAA concentrations, quantified by targeted liquid chromatography with tandem mass spectrometry (LC–MS/MS), are shown with vertical lines indicating s.d. (n = 3 biologically independent bacterial cultures per treatment group). b, Purified BlBSH enzyme synthesizes BBAAs from 100 µM CA or TCA in vitro. c, E. coli transformed with a BlBSH expression vector produces BBAAs from 1 mM CA or TCA. d, BSH knockout in B. fragilis ablates the aminotransferase activity observed in wild-type (WT) B. fragilis NCTC 9343 with 1 mM CA or 1 mM TCA supplementation. Bars in bd represent individual biological replicates (n = 4), with heights indicating BBAA concentrations. e, E. coli BL21(DE3) expressing mutated BlBSH at key active site residues exhibited altered deconjugation and conjugation activities. Deconjugation, indicated by the CA:TCA ratio, was assessed in M9 media with 1 mM TCA. Conjugation, measured through Ala-CA production, was evaluated in Luria–Bertani media with 1 mM TCA using LC–MS/MS. Controls included untransformed E. coli (Unt) and E. coli expressing unmutated BlBSH (WT). Bars represent mean values ± s.d. (n = 3 biologically independent bacterial cultures). fi, Bile acid profile of germ-free C57BL/6 J mice monocolonized with B. fragilis WT or Δbsh strains (n = 7 for WT, n = 8 for Δbsh groups). CFUs per gram of B. fragilis in faeces after 7 days (f). Ileal contents primary bile acids quantified by LC–MS/MS (CA P = 2.3 × 10−4***, βMCA P = 1.3 × 10−4***, αMCA P = 3.7 × 10−4***, CDCA P = 1.1 × 10−4, UDCA P = 2.7 × 10−5****) (g). Free taurine levels in caecal contents quantified using 1H nuclear magnetic resonance (NMR) (P = 4.27 × 10−4***) (h). Sum of peak areas for all BBAAs in ileal contents measured by LC–MS/MS (P = 3.1 × 10−4***) (i). fi, box plots depict first quartile and third quartile with median as centre and min–max values for whiskers, except for outliers calculated as data points ±1.5× interquartile range. Significant differences (P < 0.001***, P < 0.0001****) were determined by two-tailed t-tests. MCA, muricholic acid; UDCA, ursodeoxycholic acid. Source Data
Fig. 3
Fig. 3. BBAA production increases with infant microbiota development.
a, Microbiota diversity measured by Shannon diversity index of infant faecal samples acquired at 0–4 days (0–4D), one month (1M) and 12 months (12M) after birth, n = 108. Significant differences between time points were determined by linear mixed effects model (0–4D versus 12M P = 4.4 × 10−7***, 1M versus 12M P = 2 × 10−5***). b, Principal coordinate analysis plot of the Bray–Curtis dissimilarity of infants 1M and 12M old. Significant differences were determined by permutational multivariate analysis of variance (PERMANOVA) test on Bray–Curtis distances (P = 0.001***). c, Barplot depicting faecal microbiota composition of 1M and 12M infants, including all genera greater than 5% mean relative abundance in either time point. d, Faecal concentrations of total unconjugated, host glycine and taurine-conjugated and BBAAs from 0–4D to 12M, quantified using LC–MS/MS. Significant differences between time points were determined by linear mixed effects models, with log(bile acids) as outcomes, time as predictor and subject information as random effect (P < 0.001***). Several comparisons were adjusted using the Benjamini–Hochberg method. e, Associations of BBAAs and glycine-/taurine-conjugated BAs with relative Enterococcus, Bifidobacterium and Bacteroides abundances using Spearman correlation (P < 0.05*, P < 0.01**, P < 0.001***). NS, not significant. Source Data
Extended Data Fig. 1
Extended Data Fig. 1. An extended version of correlation plot.
Plot of bsh presence in human-associated bacteria and BBAA production showing all the taxa names. Taxa-names are trimmed for readability. Two species of genera, Cutibacterium and Gardnerella, are condensed to their parent genus group.
Extended Data Fig. 2
Extended Data Fig. 2. Differential gene expression analysis of Bifidobacterium longum NCTC 11818 supplemented with 200 μM each of CA and DCA.
Genes with absolute log2 fold-change of 1 and FDR-adjusted p ≤ 0.05 are represented in red (based on two-sided Wald tests as implemented in DESeq2); n = 5. Source Data
Extended Data Fig. 3
Extended Data Fig. 3. Colony-forming units of Bifidobacterium longum NCTC 11818 with or without GR-7.
The bounds of the box plot represent Q1–Q3 with median as center and min-max values for whiskers. n = 4 biologically independent bacterial cultures per group. Source Data
Extended Data Fig. 4
Extended Data Fig. 4. Heterologous protein expression of BlBSH with active site residue substitutions.
SDS-PAGE from single experimental replicates showing BlBSH expression at ~35 kDa, 4 h post-induction, in (a) LB media or (b) M9 minimal media. (c) Structure of B. longum BSH (PDB: 2HF0) highlighting active site residues mutated in this study in grey. Cholate and taurine (green) were fit using Discovery Studio software from the structure of Clostridium perfringens BSH (PDB: 2BJF) to demonstrate ligand binding location.
Extended Data Fig. 5
Extended Data Fig. 5. Body weights and ileal bile acid concentrations in B. fragilis monocolonized mice.
(a) Body weights relative to weight at inoculation on day 0. Data are presented as mean values ± SD. Ileal concentrations of (b) secondary, (c) glycine-conjugated, and (d) taurine-conjugated bile acids. Significant differences were determined by two-tailed t-test between WT (pink) and Δbsh (blue) colonized mice (HDCA p = 5.2e-6****, 3αOH-KetoLCA p = 1.1e-7****, MuroCA p = 1.4e-4***). For (b-d), the bounds of the box plots represent Q1–Q3 with median as center and min-max values for whiskers. Biological replicates were n = 7 for WT and n = 8 for Δbsh. Source Data
Extended Data Fig. 6
Extended Data Fig. 6. Levels of BBAAs correlate with the time elapsed after birth until sample collection within 0–4 day sampling group.
Spearman’s rank correlation was used to calculate significant correlations between individual bile acids quantified by LC-MS/MS and hours after birth the initial sampling occurred. Source Data
Extended Data Fig. 7
Extended Data Fig. 7. Regulation of human and murine ligand-activated transcription factors by bile acids.
(a) Luciferase reporter assays for activation of human transcription factors FXR, VDR, CAR3, PXR, AHR, and PPARα, β/δ, and γ by a 50 µM dose of conventional and bacterially conjugated bile acids. (b) Luciferase reporter assays for activation of mouse nuclear receptors FXR and PPARα, β/δ, and γ by a 50 µM dose of conventional and bacterially conjugated bile acids. Differences between treatments and vehicle-treated control were determined using ANOVA with Dunnett’s post-hoc test (p < 0.05*), n = 3 per group. Color gradient is on a log scale. Source Data
Extended Data Fig. 8
Extended Data Fig. 8. Regulation of ligand-activated transcription factors by BBAAs in organoids.
RT-qPCR of target genes for FXR (Fgf15/FGF19), CAR3 (Cyp2b10/CYP2B6), PXR (Cyp3a11/CYP3A4), and AHR (Cyp1a1/CYP1A1) in (a) mouse and (b) human small intestinal organoids treated with Glu-CA or Glu-CDCA. Expression was calculated using the 2−ΔΔCt method, normalized to Gapdh/GAPDH. Error bars represent SD. (a) Biological replicates were n = 3 for vehicle and n = 4 for treatments (Cyp3a11 p = 4.8e-3**, p = 1.5e-2*, Cyp1a1 Glu-CA-50 p = 4.7e-4***, Glu-CA-100 p = 3.3e-4***, Glu-CDCA-100 p = 2.3e-3). (b) Biological replicates were n = 8 for vehicle and n = 6 for treatments across two independent experiments (p = 3.3e-3**). All significant differences between treatments and vehicle were determined using one-way ANOVA with Dunnett’s post-hoc test. Source Data
Extended Data Fig. 9
Extended Data Fig. 9. RT-qPCR of additional receptor target genes in organoids.
(a) Relative mRNA expression of Bsep, Adrp, S100g, and Acox1 in mouse intestinal organoids. Biological replicates were n = 3 for vehicle and n = 4 for treatments. (b) Relative mRNA expression of FXR, PXR, CAR, and the FXR target genes short heterodimeric partner (SHP), bile salt export protein (BSEP), organic solute transporter-α (OSTα) and -β (OSTβ), and ileal bile acid binding protein (IBABP) in human intestinal organoids. Biological replicates were n = 8 for vehicle and n = 6 for treatments. Differences between treatments and vehicle were determined using one-way ANOVA with Dunnett’s post-hoc test (p = 0.011*). Source Data

References

    1. Quinn RA, et al. Global chemical effects of the microbiome include new bile-acid conjugations. Nature. 2020;579:123–129. doi: 10.1038/s41586-020-2047-9. - DOI - PMC - PubMed
    1. Lucas LN, et al. Dominant bacterial phyla from the human gut show widespread ability to transform and conjugate bile acids. mSystems. 2021;6:e00805–e00821. doi: 10.1128/mSystems.00805-21. - DOI - PubMed
    1. Gentry, E. C. et al. Reverse metabolomics for the discovery of chemical structures from humans. Nature10.1038/s41586-023-06906-8 (2023). - PMC - PubMed
    1. Hoffmann MA, et al. High-confidence structural annotation of metabolites absent from spectral libraries. Nat. Biotechnol. 2022;40:411–421. doi: 10.1038/s41587-021-01045-9. - DOI - PMC - PubMed
    1. Funabashi M, et al. A metabolic pathway for bile acid dehydroxylation by the gut microbiome. Nature. 2020;582:566–570. doi: 10.1038/s41586-020-2396-4. - DOI - PMC - PubMed

MeSH terms

LinkOut - more resources