. 2024 Feb;626(8001):1066-1072.
doi: 10.1038/s41586-023-07008-1. Epub 2024 Feb 7.

A distinct cortical code for socially learned threat

Affiliations

A distinct cortical code for socially learned threat

Shana E Silverstein et al. Nature. 2024 Feb.

Abstract

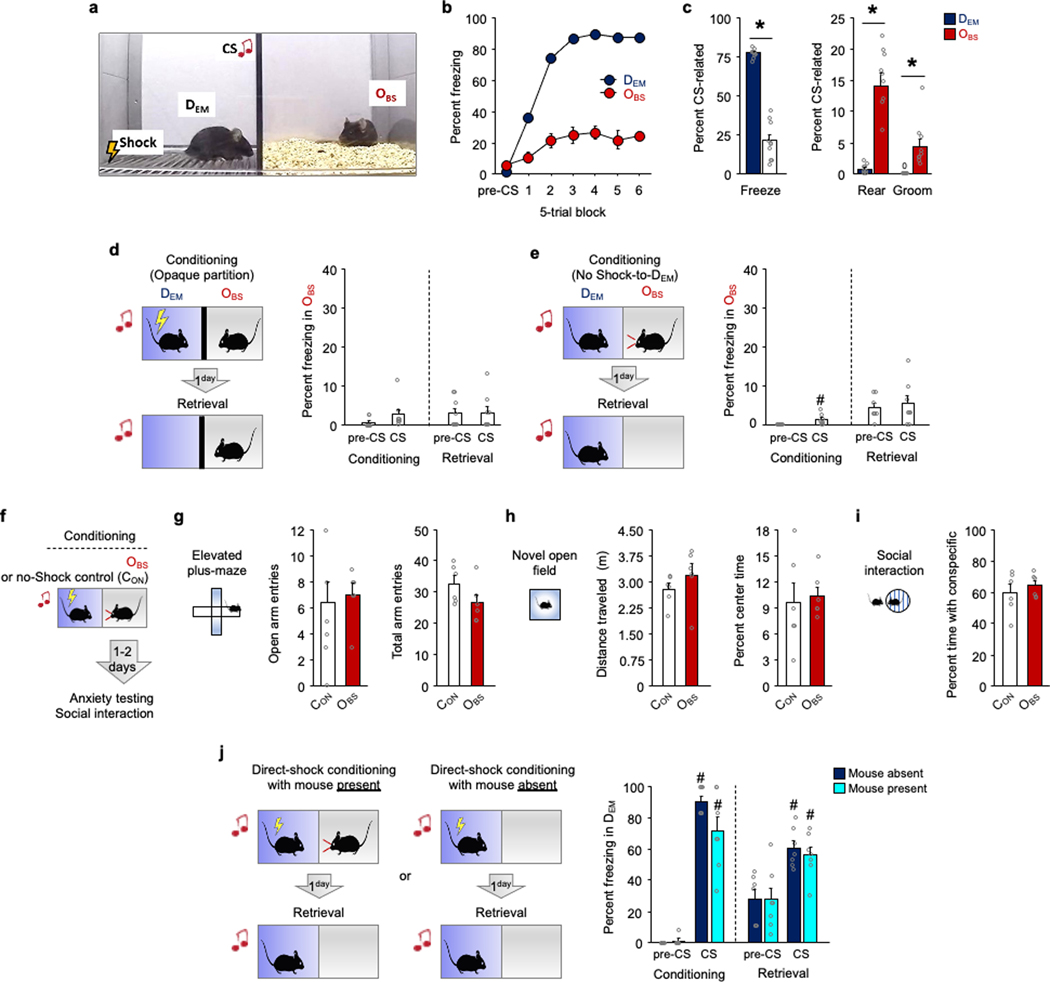
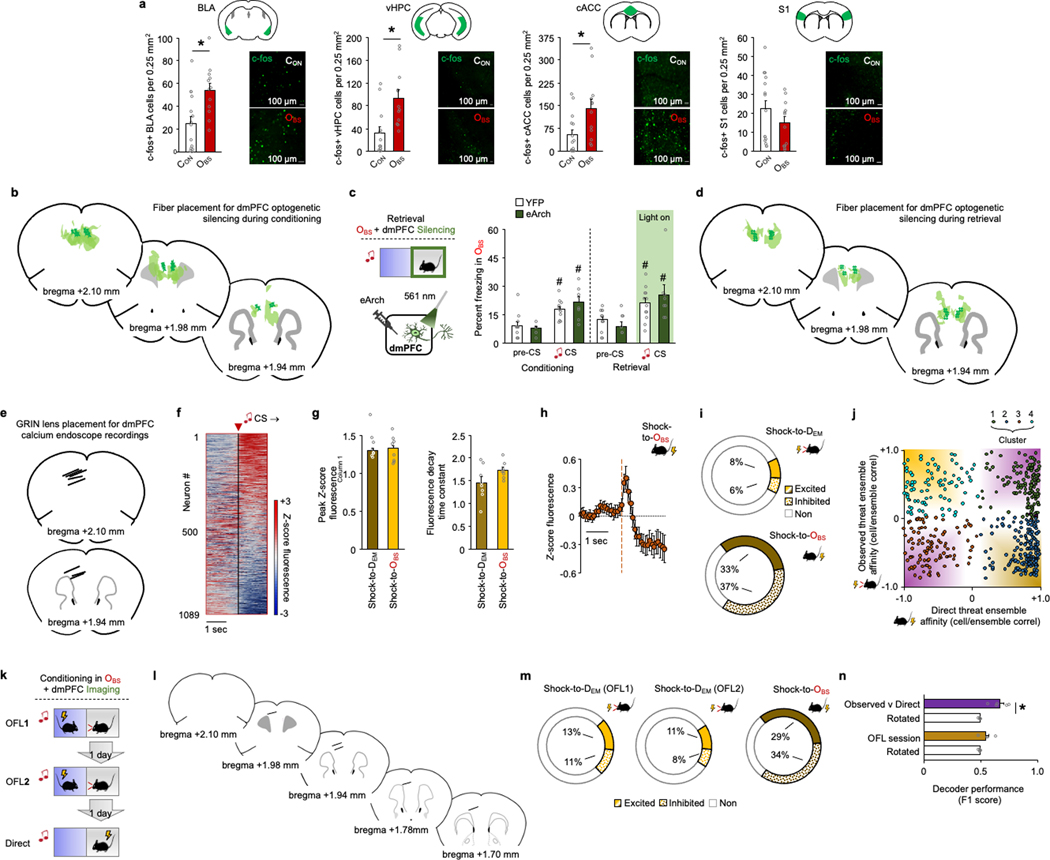
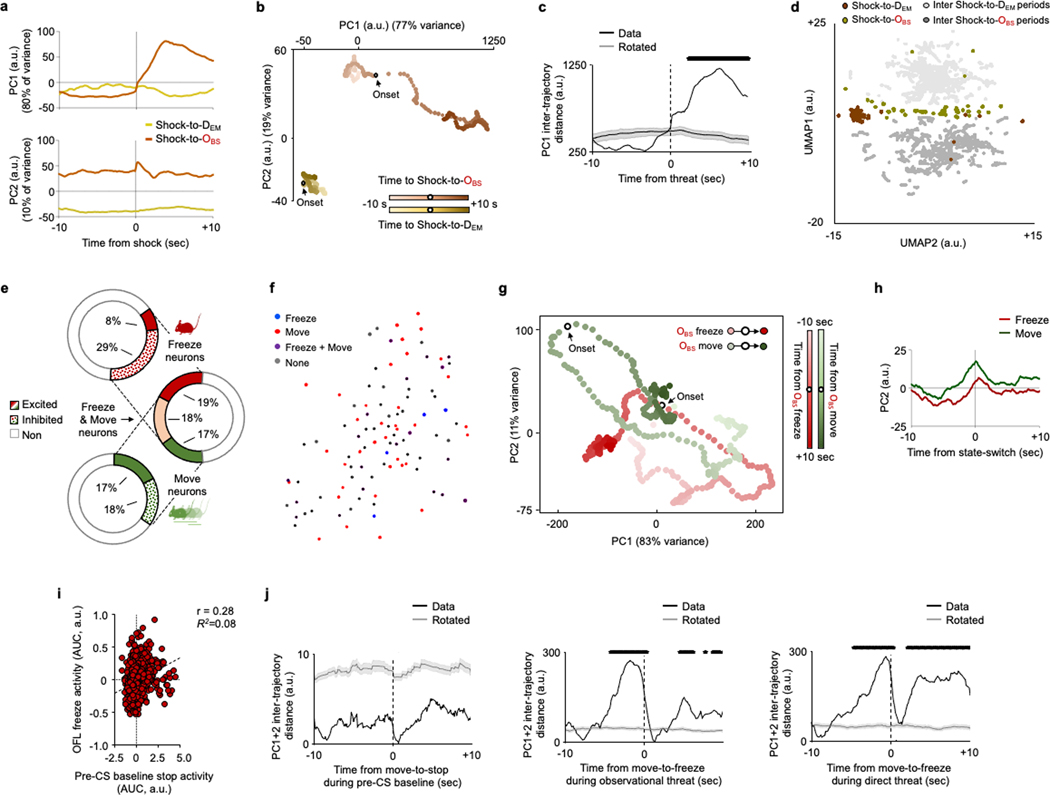
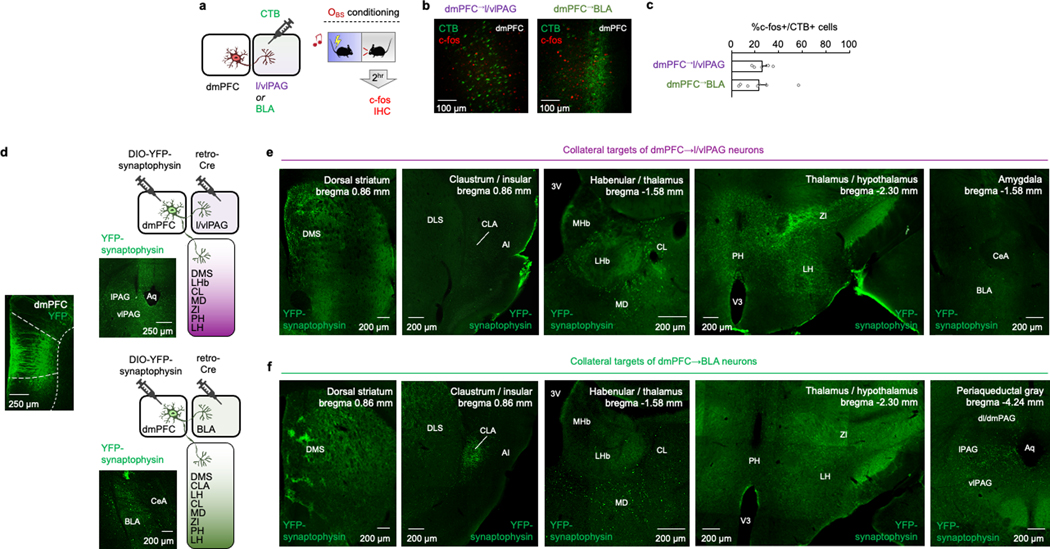
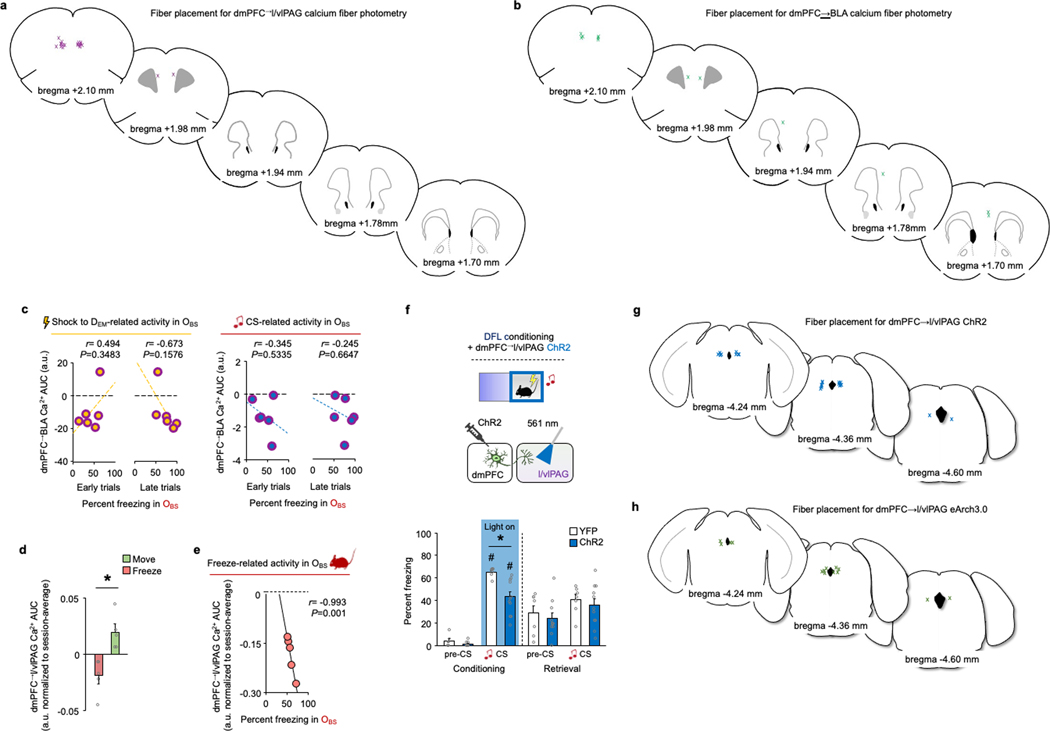
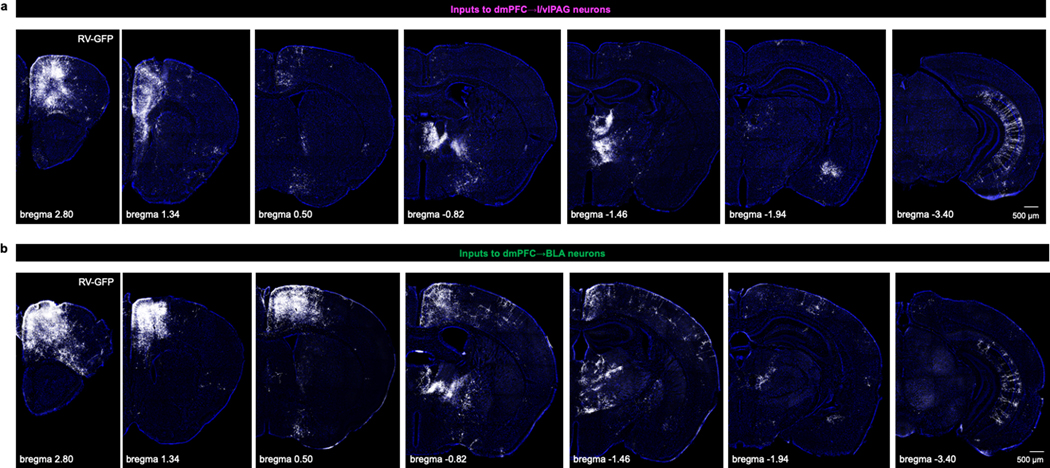
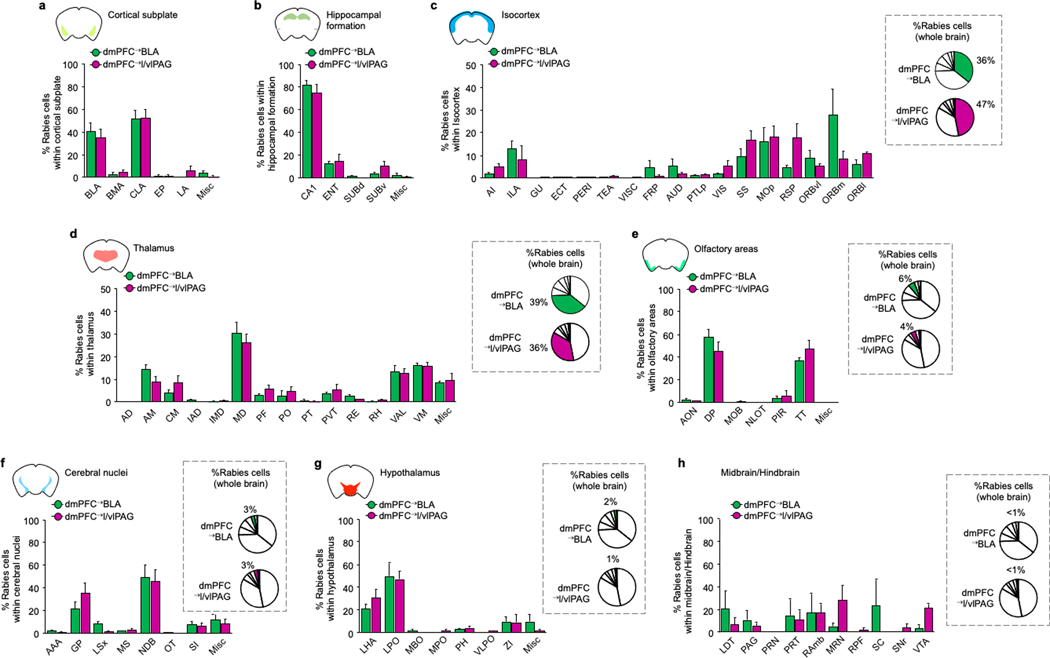
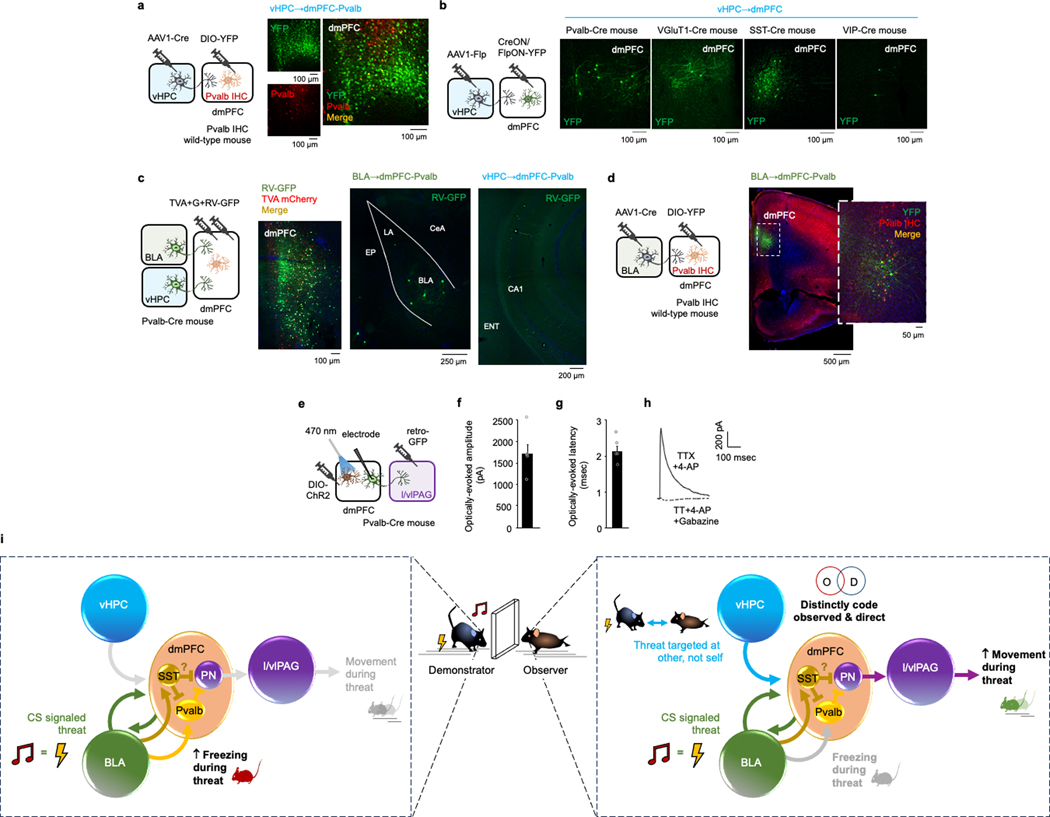
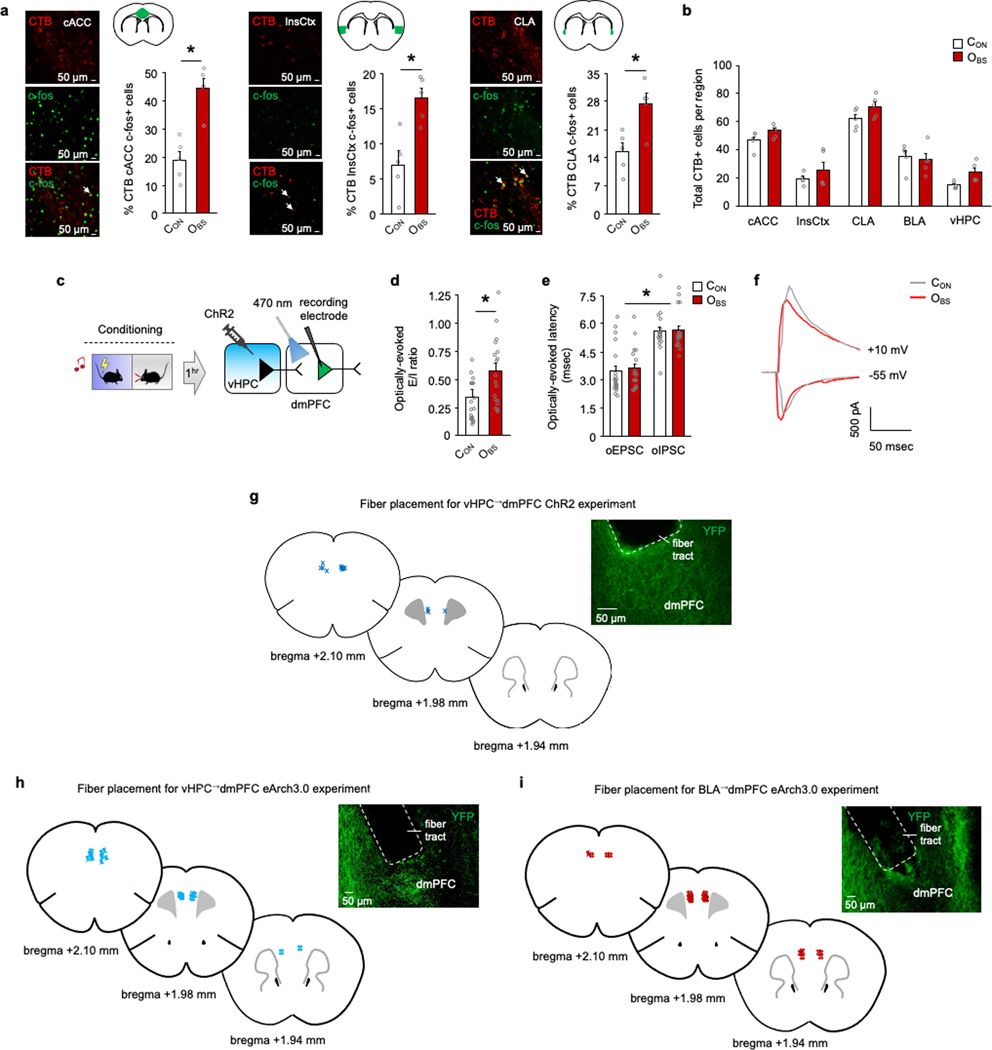
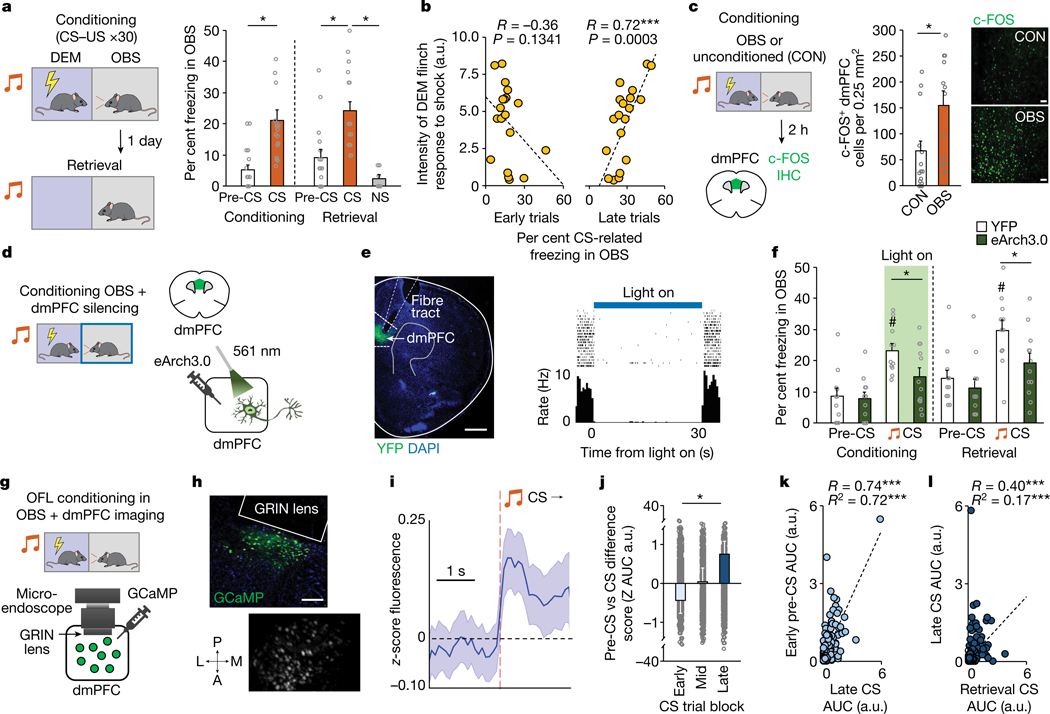
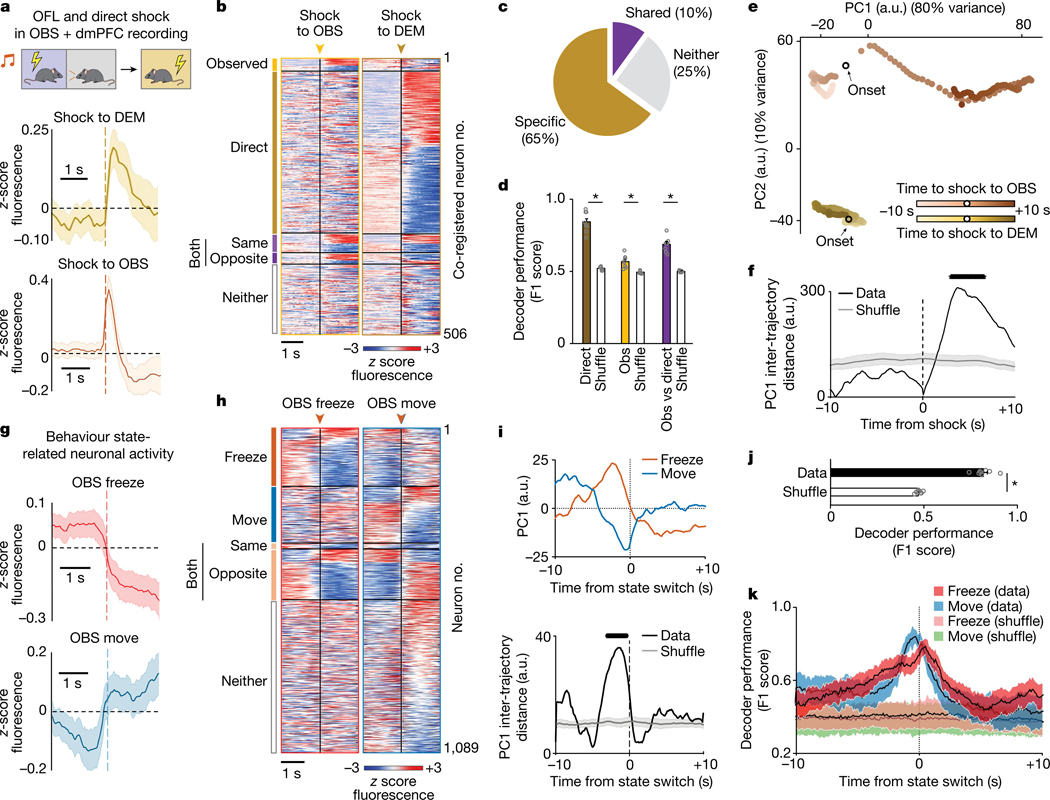
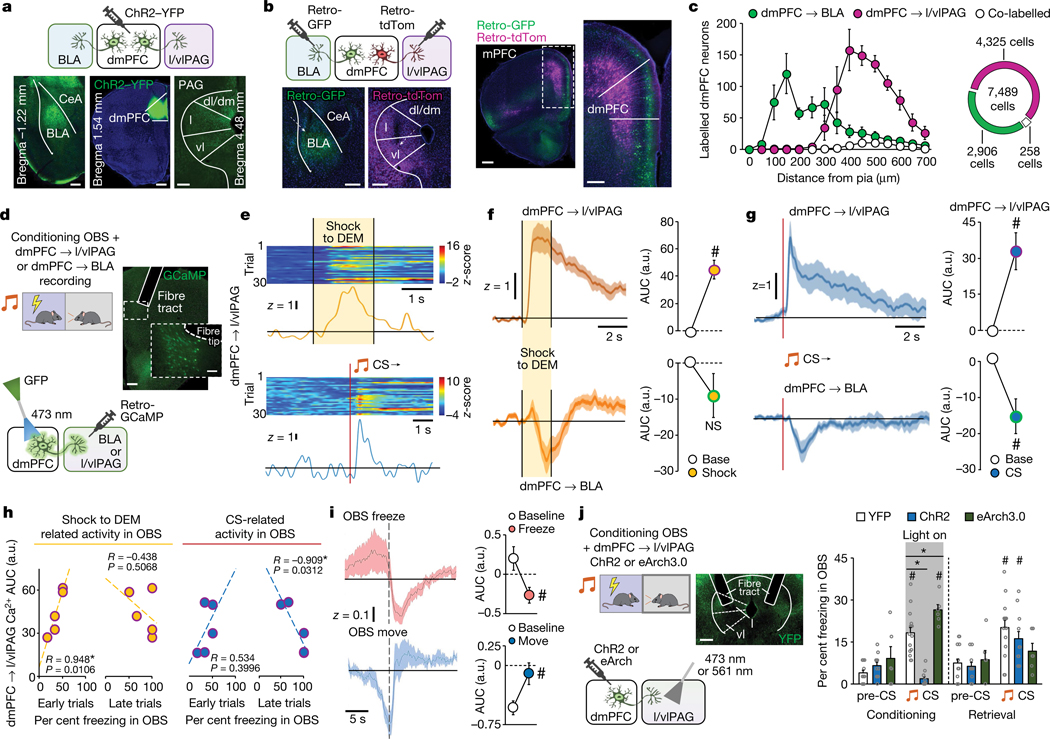
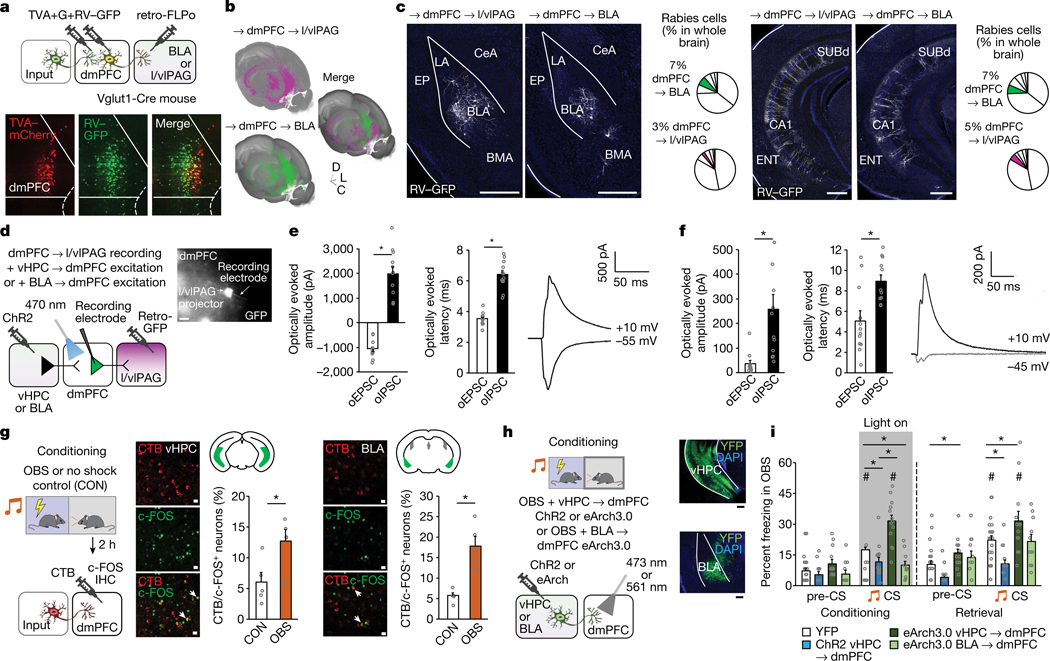
Animals can learn about sources of danger while minimizing their own risk by observing how others respond to threats. However, the distinct neural mechanisms by which threats are learned through social observation (known as observational fear learning1-4 (OFL)) to generate behavioural responses specific to such threats remain poorly understood. The dorsomedial prefrontal cortex (dmPFC) performs several key functions that may underlie OFL, including processing of social information and disambiguation of threat cues5-11. Here we show that dmPFC is recruited and required for OFL in mice. Using cellular-resolution microendoscopic calcium imaging, we demonstrate that dmPFC neurons code for observational fear and do so in a manner that is distinct from direct experience. We find that dmPFC neuronal activity predicts upcoming switches between freezing and moving state elicited by threat. By combining neuronal circuit mapping, calcium imaging, electrophysiological recordings and optogenetics, we show that dmPFC projections to the midbrain periaqueductal grey (PAG) constrain observer freezing, and that amygdalar and hippocampal inputs to dmPFC opposingly modulate observer freezing. Together our findings reveal that dmPFC neurons compute a distinct code for observational fear and coordinate long-range neural circuits to select behavioural responses.


Figures

Extended Data Fig. 1 |
OFL-related behavioural experiments
Extended Data Fig. 2 |
OFL-related neuronal activation and in vivo optogenetic manipulations
Extended Data Fig. 3 |
In vivo single cell resolution calcium recordings in dmPFC during OFL
Extended Data Fig. 4 |
OFL-related neuronal activation, dmPFC“M/vlPAG or dmPFC-^BLA collaterals
Extended Data Fig. 5 |
Fibre photometry calcium recordings and optogenetic manipulations
Extended Data Fig. 6 |
Rabies virus labelling of inputs to dmPFC neurons
Extended Data Fig. 7 |
Quantification of rabies virus-labelling of inputs to dmPFC neurons
Extended Data Fig. 8 |
Rabies virus control experiments
Extended Data Fig. 9 |
Input-Output analysis of dmPFC-Pvalb neurons
Extended Data Fig. S10 |
Analyses of dmPFC inputs
Fig. 1 |
Fig. 1 |. Prefrontal mediation of observational fear.
a, Higher OBS CS-related freezing relative to pre-CS during conditioning (*P = 0.0002, n = 17 mice) and relative to pre-CS (*P = 0.0001, n = 17 mice) and a neutral stimulus (*P = 0.0110, n = 7 mice) during retrieval. P values from paired t-tests. NS, novel stimulus. b, DEM shock-induced flinching correlates (Pearson’s r) with OBS freezing on late (last 10), not early (first 10), OFL conditioning trials. n = 17 mice. a.u., arbitrary units. c, There are increased numbers of c-FOS-positive neurons in dmPFC in OBS mice than in CON mice (*P = 0.0077). P value from Bonferroni post hoc tests following mixed-model ANOVA. n = 12–16 mice per group. See Extended Data Fig. 2 for c-FOS-positive neurons in other brain regions. IHC, immunohistochemistry. Scale bars, 100 μm. d, Optogenetic manipulation of dmPFC neurons via eArch3.0 during OFL conditioning. e, Left, eArch3.0–YFP expression and optic fibre tract. Right, effect of eArch3.0 on in vivo dmPFC single-unit activity. Scale bar, 500 μm. f, Optogenetic manipulation of dmPFC neurons during conditioning reduces CS-related OBS freezing relative to YFP controls during conditioning (*P = 0.0351) and light-free retrieval (*P = 0.0399); higher freezing to CS than pre-CS during conditioning (#P = 0.0005) and retrieval (#P = 0.0023) in the YFP group. P values from Bonferroni post hoc tests following mixed-model ANOVA. n = 11 or 12 mice per group. g, Microendoscope dmPFC neuronal calcium imaging during OFL. h, GCaMP7f expression post mortem (top) and in GRIN lens field of-view in vivo (bottom). A, anterior; L, lateral; M, medial; P, posterior. Scale bar, 100 μm. i, Increased dmPFC population calcium activity during CS. n = 8 mice. j, Progressively increasing CS-related calcium activity across early, mid and late OFL conditioning trial blocks (*P = 0.0467). P value from Bonferroni post hoc tests following ANOVA. n = 8 mice. k, Pre-CS calcium activity on Early OFL conditioning trials is related (Pearson’s r ***P < 0.0001, linear regression adjusted R2 ***P < 0.0001) to CS-related activity on late trials. n = 8 mice. l, CS-related activity on late conditioning trials is related (Pearson’s r ***P < 0.0001, linear regression adjusted R2 ***P < 0.0001) to CS-related activity on retrieval. n = 8 mice. Two-tailed statistical tests were used. Data shown as mean ± s.e.m. AUC, area under the curve.
Fig. 2 |
Fig. 2 |. Prefrontal coding of observed and direct fear.
a, Top, microendoscope imaging of dmPFC neuronal calcium in OBS mice during OFL and direct shock. Increased population calcium activity during observation of shock to the DEM (middle) and direct shock to the OBS (bottom). b, Heat map of calcium activity aligned to shock to the OBS (Observed), Shock to the DEM (Direct), both (same or opposite direction), or neither. c, The percentage of neurons that are responsive to Observed and Direct shock, both, or neither. d, Decoding Observed (Obs) (*P = 0.0014) and Direct (*P = 0.0001) and Observed versus Direct (*P = 0.0001) shock. P values from paired t-tests versus rotated. e, Observed and Direct shock-related activity trajectories occupy distinct places in low-dimensional state space following PCA. f, PC1 trajectory distance aligned to Observed and Direct experience (black line indicates significant difference from shuffle). g, Increased and decreased calcium activity during freeze (top) and move (bottom), respectively. h, Heat map of calcium activity aligned to freeze, move or both (same or opposite direction). i, Top, PC1 neuronal trajectories differentially anticipate upcoming switches to freeze or move state. PC1 trajectory distance is aligned to state switch. j, Decoding freeze and move state (Data) (*P = 0.0001 versus rotated, paired t-test). k, Decoding freeze and move state as a function of time from state switch. P = 0.0001, mixed-model time × group interaction effect. Data shown as mean (e,f,i), mean ± s.e.m. (a,d,g,j) or mean ± s.d. (k). The black line (f,i) denotes a period significantly different from rotated data (Benjamini–Hochberg corrected permutation tests). Two-tailed statistical tests were used. ak, n = 8 mice.
Fig. 3 |
Fig. 3 |. Prefrontal–midbrain circuit modulation of observational fear.
a, ChR2-labelled dmPFC axons in BLA and l/vlPAG. CeA, central amygdala; dm, dorsomedial PAG; dl, dorsolateral PAG; l, lateral PAG; vl, ventrolateral PAG. Scale bars, 200 μm, 500 μm and 200 μm (left to right). b, Retrograde virus-labelled dmPFC neuronal projections to BLA and l/vlPAG (arrows depict injector tip). mPFC, medial prefrontal cortex. Scale bars, 200 μm, 200 μm, 500 μm and 100 μm (left to right). c, Non-overlapping dmPFC neuronal projections. P = 0.0001 mixed-model time × group interaction effect. n = 5 mice. d, Right, fibre photometry calcium imaging of dmPFC→BLA or dmPFC→l/vlPAG neurons. Left, GCaMP expression and fibre tip and tract position. Scale bars, 200 μm (main image) and 50 μm (magnified view).e, Example trace and heat map of dmPFC→l/vlPAG neuronal activity during shock to DEM (top) and CS presentation (bottom). f, Differential shock to DEM population calcium activity in dmPFC→l/vlPAG (#P = 0.0037, paired t-test, n = 5 mice) and dmPFC→BLA neurons (n = 6 mice). g, Differential CS-related population calcium activity in dmPFC→l/vlPAG (#P = 0.0202, n = 5 mice) and dmPFC→BLA neurons (#P < 0.0307, n = 6 mice). P values from paired t-tests. h, Left, shock to DEM activity correlates (Pearson’s r) with OBS freezing on early (first 5) OFL conditioning trials. Right, CS-related activity correlates (Pearson’s r) with OBS freezing on late (last 5) trials. i, Differential freeze (#P = 0.0035) and move (#P = 0.0344) population calcium activity in dmPFC→l/vlPAG neurons. P values from paired t-tests. n = 5 mice. j, Optogenetic manipulation of dmPFC→l/vlPAG axons bidirectionally alters CS-related OBS freezing during conditioning (ChR2 *P < 0.0001, n = 11; eArch3.0, *P = 0.0088, n = 6), versus YFP controls (n = 15). Higher CS-related freezing versus pre-CS during conditioning in YFP (#P < 0.0001) and eArch3.0 (#P = 0.0040), and lower freezing in ChR2 (#P = 0.0056). Higher CS-related freezing versus pre-CS during light-free retrieval in YFP (#P = 0.0341) and ChR2 (#P = 0.0053), but not eArch3.0. P values from Bonferroni post hoc tests following mixed-model ANOVA. Two-tailed statistical tests were used. Data shown as mean ± s.e.m. Scale bar, 200 μm.
Fig. 4 |
Fig. 4 |. In vitro and in vivo analyses of vHPC and BLA inputs to dmPFC→l/vlPAG neurons.
a, Top, intersectional rabies virus (RV) labelling of transynaptic inputs to dmPFC→l/vlPAG and dmPFC→BLA neurons. Bottom, TVA–mCherry (TVA) and RV–GFP expression. G, glycoprotein. b, Three-dimensional pseudocoloured depiction of RV expression in dmPFC→l/vlPAG and dmPFC→BLA neurons. C, caudal; D, dorsal; L, lateral. c, RV labelling and whole-brain percentage of RV-labelled neurons in BLA and vHPC. n = 5–7 mice per group. BMA, basomedial amygdala; ENT, entorhinal cortex; EP, endopiriform; LA, lateral amygdala; SUBd, subiculum dorsal part. Scale bars, 500 μm. d, Left, ChR2-assisted mapping of vHPC or BLA inputs to dmPFC→l/vlPAG neurons. Right, GFP-labelled dmPFC→l/vlPAG neuron proximal to recording electrode. Scale bar, 10 μm e, Optically evoked vHPC-mediated inhibitory postsynaptic current (oIPSC) and excitatory postsynaptic current (oEPSC) amplitude (*P = 0.0001) and latency (*P = 0.0001) in dmPFC→l/vlPAG neurons, with example traces. P values from paired t-tests. n = 12 cells, N = 5 mice. f, Optically evoked BLA-mediated oIPSC and oEPSC amplitude (P = 0.0021) and latency (P = 0.0021) in dmPFC→l/vlPAG neurons, with example traces. P values from paired t-tests. n = 12 cells, N = 5 mice. g, Increased number of c-FOS-positive neurons after OFL relative to CON in dmPFC-projecting vHPC (*P = 0.0244) and BLA (*P = 0.0010) cells. P values from paired t-tests. n = 5 mice per group. Scale bars, 50 μm. h, Left, optogenetic manipulation of vHPC→dmPFC (ChR2 and eArch3.0) or BLA→dmPFC (eArch3.0) axons. Right, virus expression. Scale bars, 200 μm. i, Optogenetic manipulation of vHPC→dmPFC axons bidirectionally alters CS-related freezing (right) during conditioning (ChR2 *P = 0.0241, eArch3.0 *P < 0.0001) and retrieval (ChR2 *P = 0.0033, eArch3.0 *P = 0.0095); eArch3.0 manipulation of BLA→dmPFC decreases CS-related freezing during conditioning (*P = 0.0135), versus YFP controls. Higher CS-related freezing versus pre-CS in vHPC→dmPFC-eArch3.0 group (conditioning, #P < 0.0001, retrieval #P = 0.0052) and YFP controls (conditioning, #P < 0.0001, retrieval #P < 0.0001) but not in vHPC→dmPFC-ChR2 or BLA→dmPFC-eArch3.0 group. P values from Bonferroni post hoc tests following mixed-model ANOVA. n = 7–32 mice per group. Two-tailed statistical tests were used. Data shown as mean ± s.e.m.

Similar articles

Cited by

References

    1. Kondrakiewicz K, Kostecki M, Szadzinska W & Knapska E. Ecological validity of social interaction tests in rats and mice. Genes Brain Behav. 18, e12525 (2019). - PubMed
    1. Olsson A, Knapska E. & Lindstrom B. The neural and computational systems of social learning. Nat. Rev. Neurosci 21, 197–212 (2020). - PubMed
    1. Burgos-Robles A, Gothard KM, Monfils MH, Morozov A. & Vicentic A. Conserved features of anterior cingulate networks support observational learning across species. Neurosci. Biobehav. Rev 107, 215–228 (2019). - PMC - PubMed
    1. Keum S. & Shin HS Rodent models for studying empathy. Neurobiol. Learn. Mem 135, 22–26 (2016). - PubMed
    1. Blanchard DC, Griebel G, Pobbe R. & Blanchard RJ Risk assessment as an evolved threat detection and analysis process. Neurosci. Biobehav. Rev 35, 991–998 (2011). - PubMed

LinkOut - more resources