An official website of the United States government
The .gov means it’s official.
Federal government websites often end in .gov or .mil. Before
sharing sensitive information, make sure you’re on a federal
government site.
The site is secure.
The https:// ensures that you are connecting to the
official website and that any information you provide is encrypted
and transmitted securely.
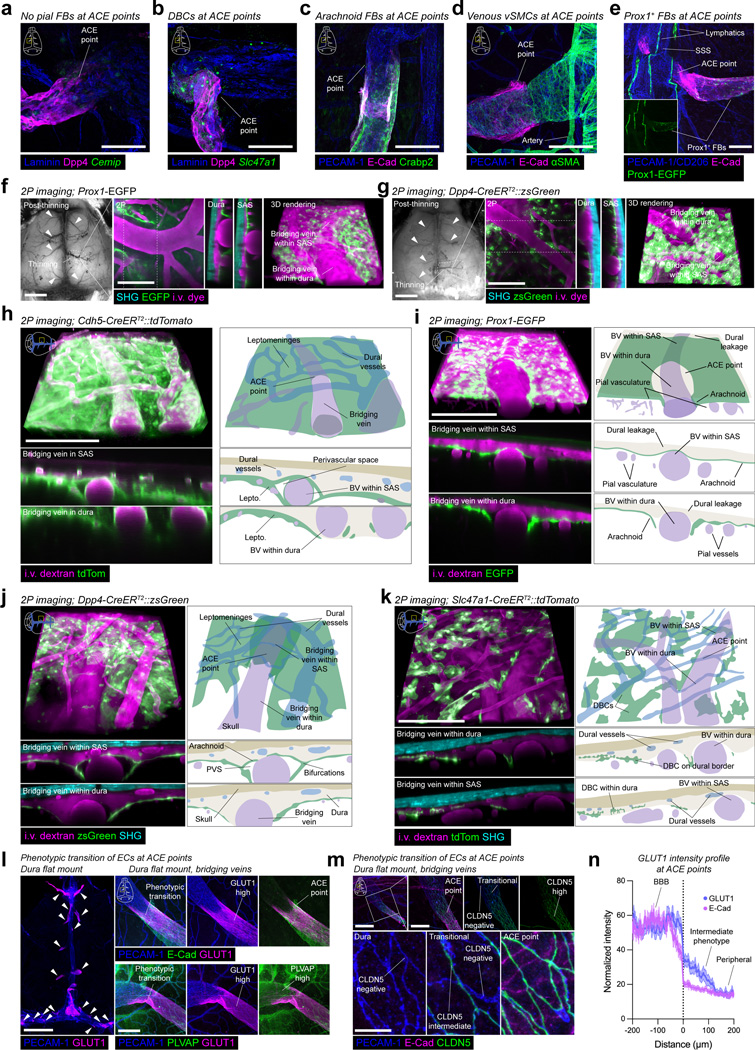
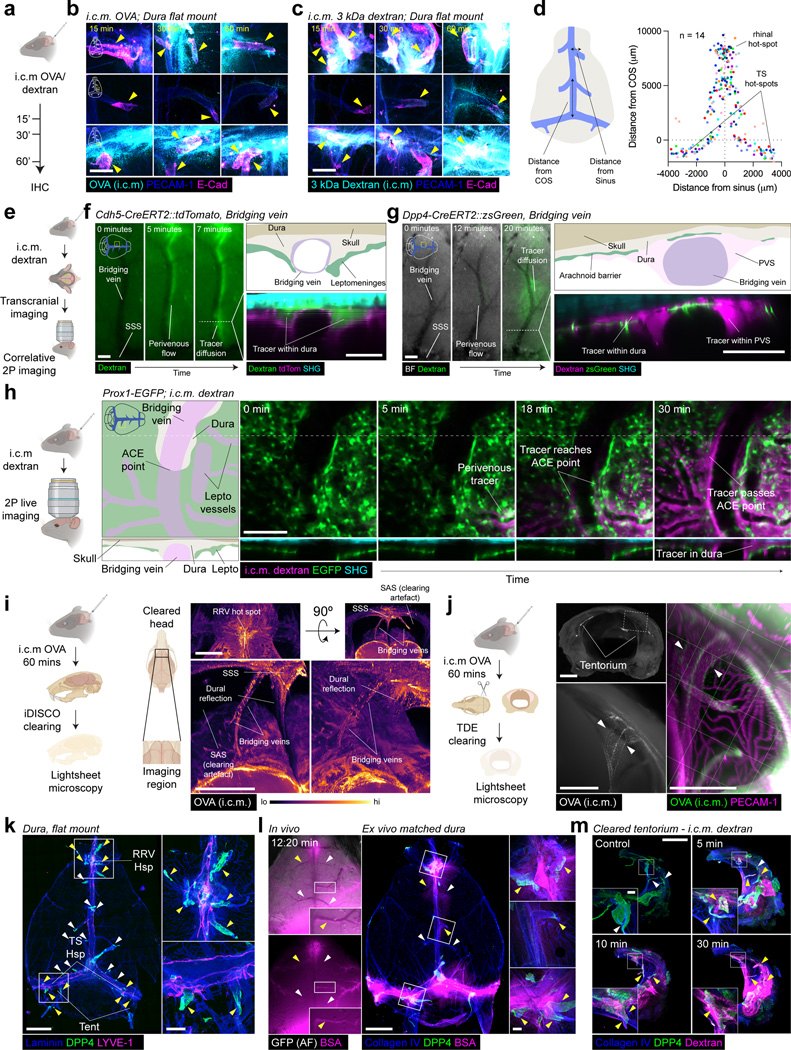
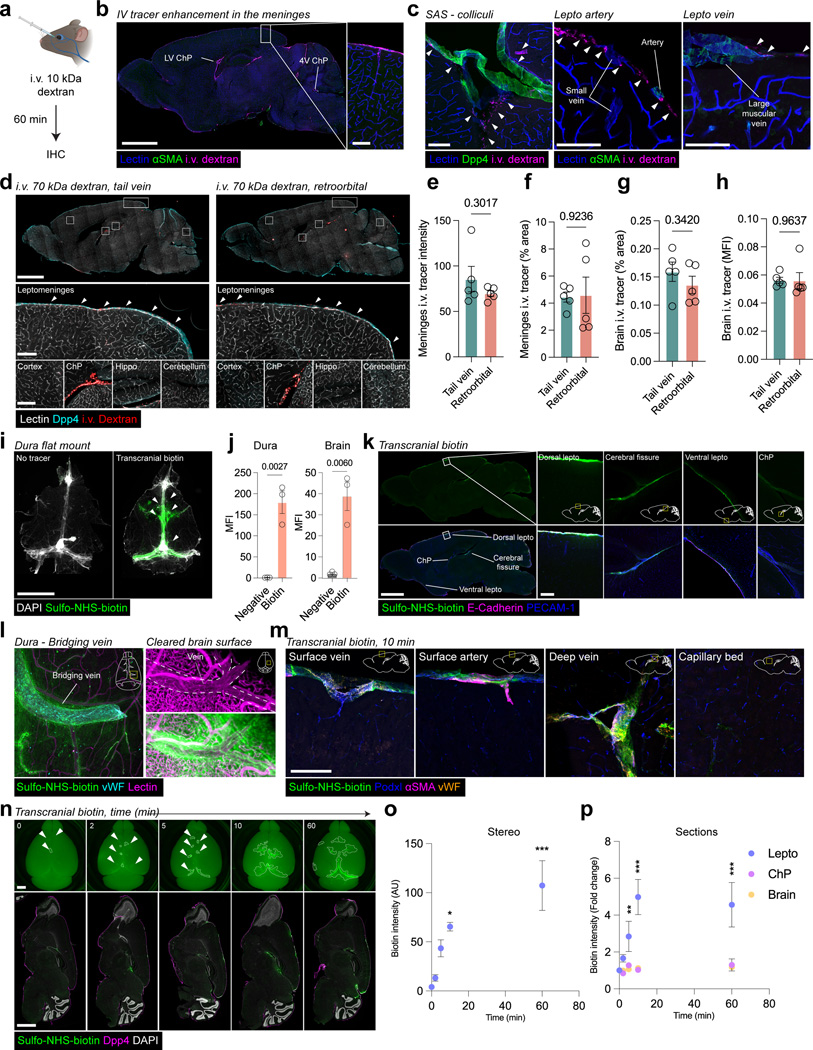
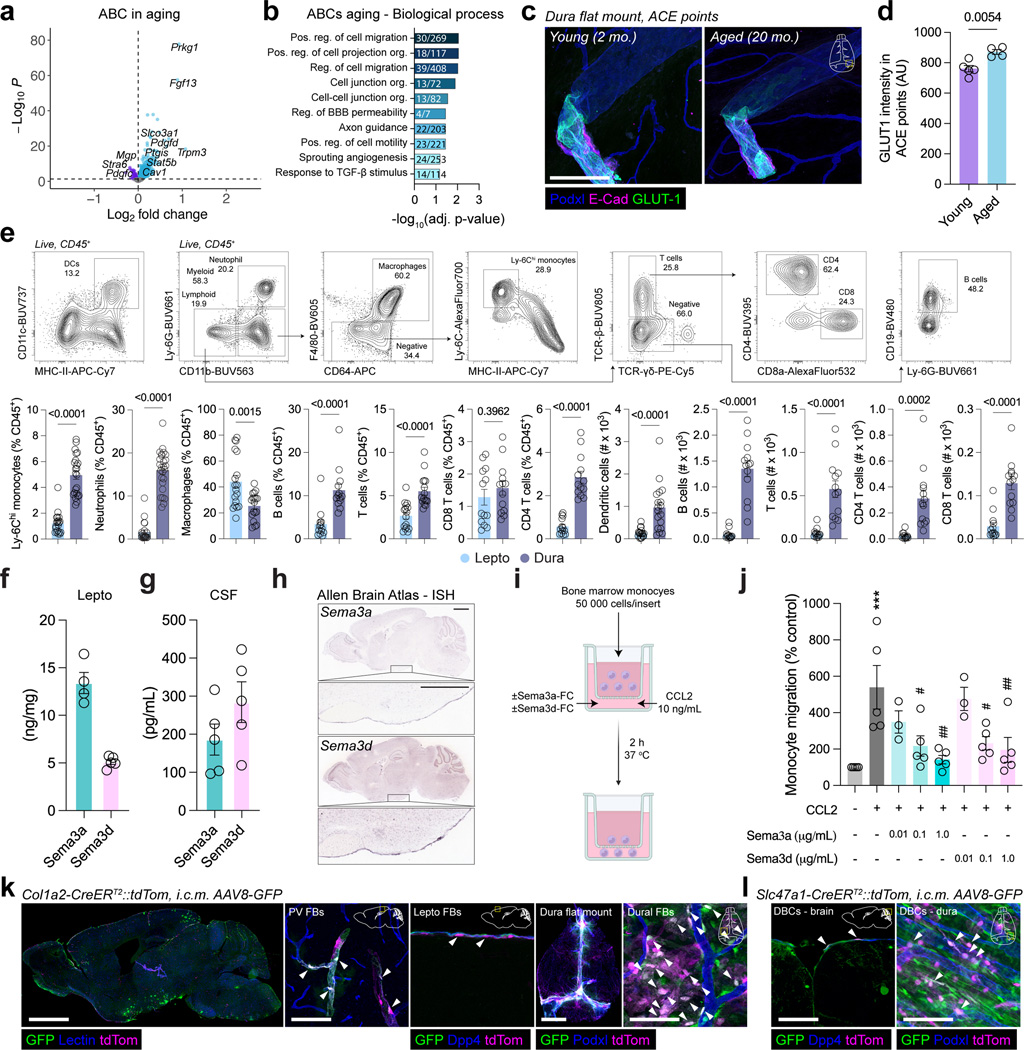
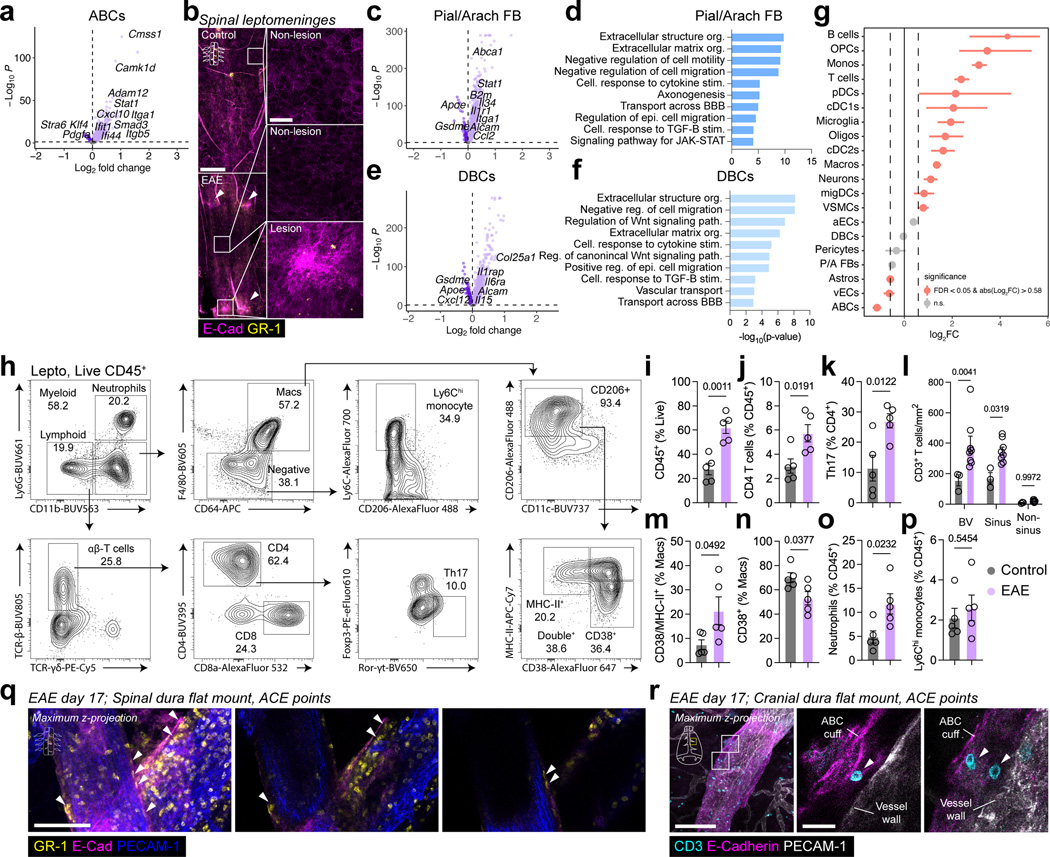
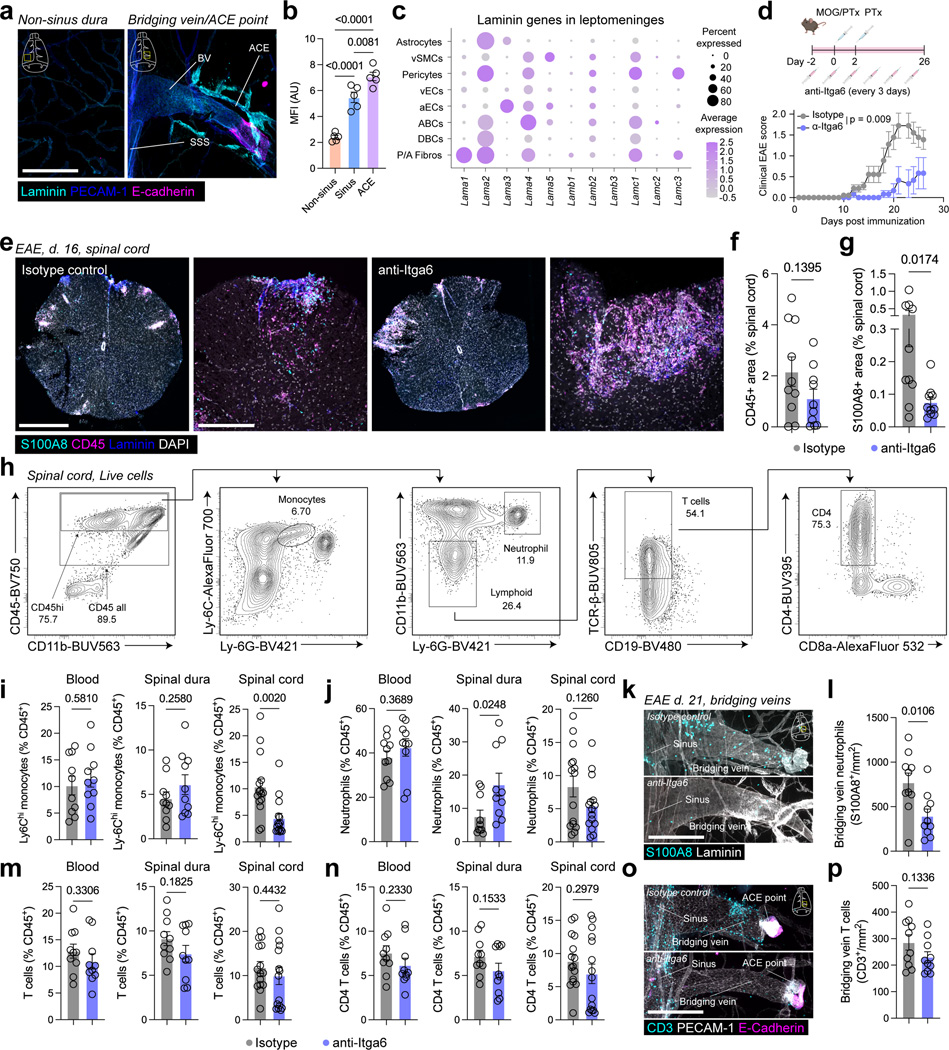
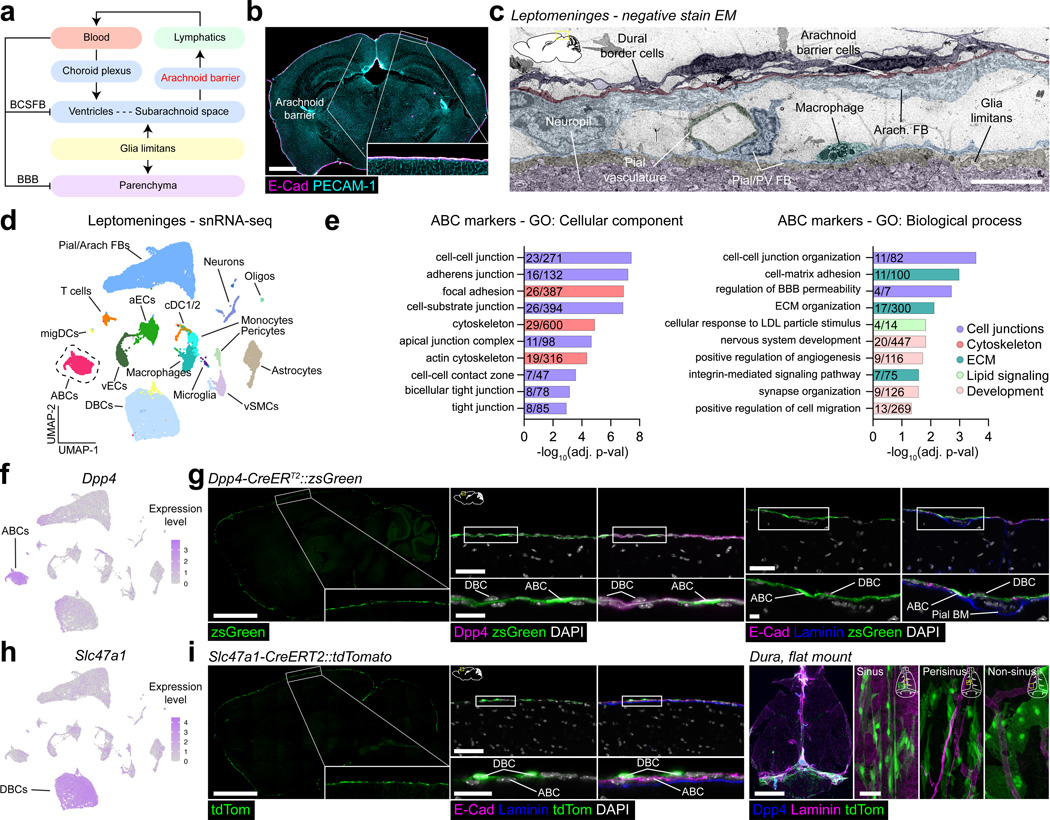
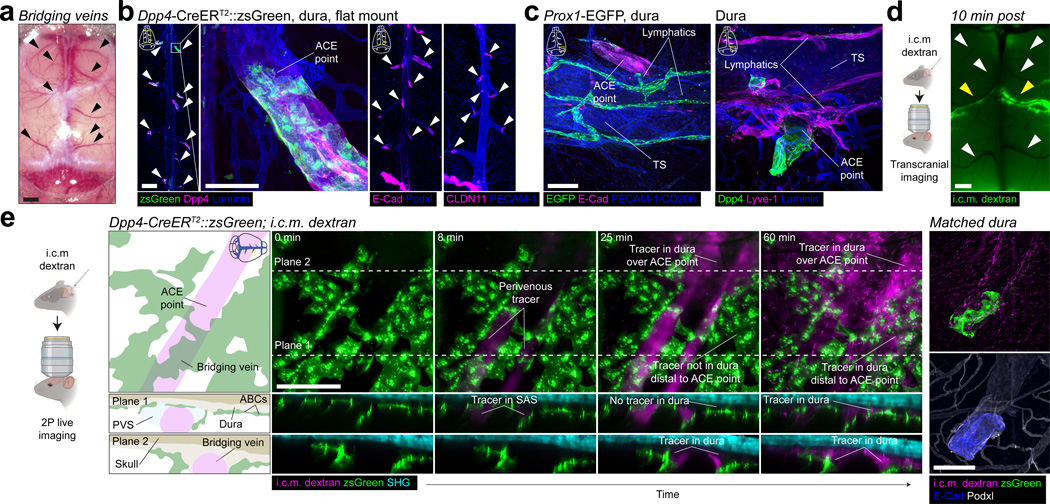
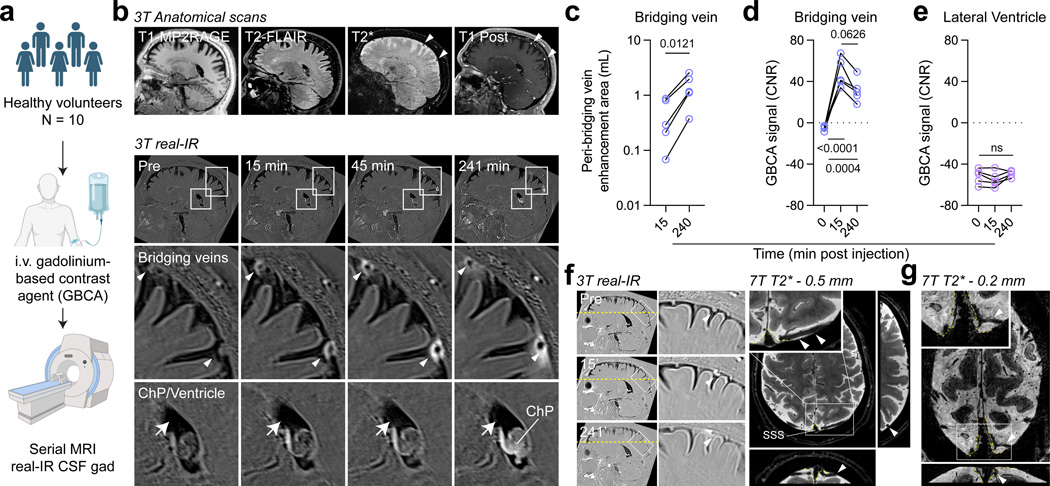
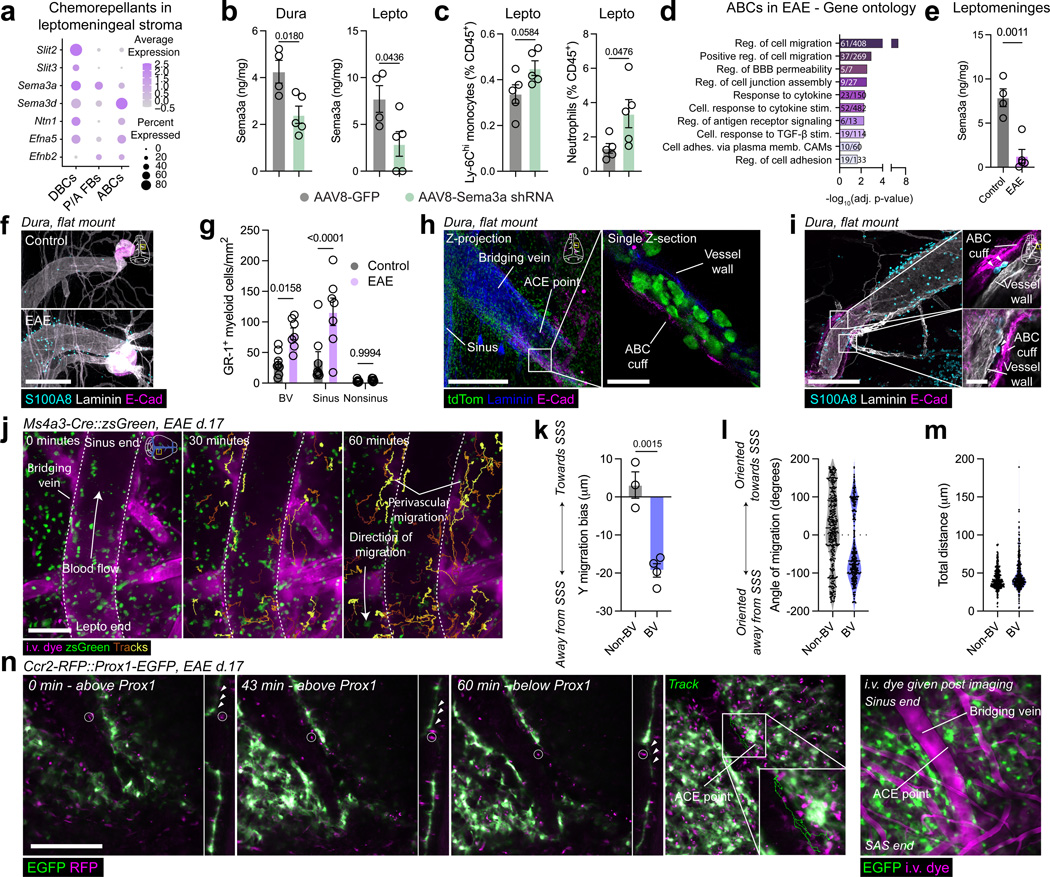
The arachnoid barrier delineates the border between the central nervous system and dura mater. Although the arachnoid barrier creates a partition, communication between the central nervous system and the dura mater is crucial for waste clearance and immune surveillance1,2. How the arachnoid barrier balances separation and communication is poorly understood. Here, using transcriptomic data, we developed transgenic mice to examine specific anatomical structures that function as routes across the arachnoid barrier. Bridging veins create discontinuities where they cross the arachnoid barrier, forming structures that we termed arachnoid cuff exit (ACE) points. The openings that ACE points create allow the exchange of fluids and molecules between the subarachnoid space and the dura, enabling the drainage of cerebrospinal fluid and limited entry of molecules from the dura to the subarachnoid space. In healthy human volunteers, magnetic resonance imaging tracers transit along bridging veins in a similar manner to access the subarachnoid space. Notably, in neuroinflammatory conditions such as experimental autoimmune encephalomyelitis, ACE points also enable cellular trafficking, representing a route for immune cells to directly enter the subarachnoid space from the dura mater. Collectively, our results indicate that ACE points are a critical part of the anatomy of neuroimmune communication in both mice and humans that link the central nervous system with the dura and its immunological diversity and waste clearance systems.
Extended data Fig. 1. Direct bulk efflux of CSF to the dura mater.
a. Flat…
Extended data Fig. 1. Direct bulk efflux of CSF to the dura mater.
a. Flat mounted dorsal dura mater 60 minutes after i.c.m. injection of 70 kDa dextran. Scale = 2 mm, inset = 200 μm. b. Flat mounted dorsal dura mater 60 minutes after i.v. injection of 70 kDa dextran. Scale = 2 mm, inset = 200 μm. c. Ratio of tracer in the sinus and non-sinus regions of the dura mater 60 minutes after i.v. or i.c.m. injection. Mean ± SEM. N = 5 (i.v.), 7 (i.c.m.) animals, unpaired, two-tailed Student’s t-test. d. Tracer intensity in the sinus regions of the dura mater 60 minutes after i.v. or i.c.m. injection. Mean ± SEM. N = 5 (i.v.), 7 (i.c.m.) animals, unpaired, two-tailed Student’s t-test. e. Tracer intensity in the non-sinus regions of the dura mater 60 minutes after i.v. or i.c.m. injection. Mean ± SEM. N = 5 (i.v.), 7 (i.c.m.) animals, unpaired, two-tailed Student’s t-test. f. Evan’s blue was injected i.c.m. and intravital transcranial imaging performed. Intensity of i.c.m. Evan’s blue tracer in perisinus regions. Mean ± SEM. N = 7 animals. g. Evan’s blue was injected i.c.m. and intravital imaging of the cervical lymph nodes performed. Intensity of i.c.m. Evan’s blue tracer in the cervical lymph nodes. Mean ± SEM. N = 9 animals. h. Evan’s blue was injected i.c.m. and intravital imaging of the femoral vein performed. Intensity of i.c.m. Evan’s blue tracer in the femoral vein. Mean ± SEM. N = 8 animals. i. Transit time (time to cross 5% max threshold) of Evan’s blue signal in the perisinus regions, cervical lymph nodes, and femoral vein. Mean ± SEM. N = 7 (perisinus), 8 (femoral vein),9 (blood) animals, one-way ANOVA with Sidak’s multiple comparisons test. Each point represents an animal. j. Concentration of 70 kDa FITC dextran in the brain following i.c.m. injection. Mean ± SEM. N = 5 (0, 60 mins), 6 (2,5, 10, 15, 30 mins) animals. k. Concentration of 70 kDa FITC dextran in the dura following i.c.m. injection. Mean ± SEM. N = 5 (0, 60 mins), 6 (2,5, 10, 15, 30 mins) animals. l. Concentration of 70 kDa FITC dextran in the dcLN following i.c.m. injection. Mean ± SEM. N = 5 (0, 60 mins), 6 (2,5, 10, 15, 30 mins) animals. m. Concentration of 70 kDa FITC dextran in the scLN following i.c.m. injection. Mean ± SEM. N = 5 (0, 60 mins), 6 (2,5, 10, 15, 30 mins) animals. n. Concentration of 70 kDa FITC dextran in serum following i.c.m. injection. Mean ± SEM. N = 5 (0, 60 mins), 6 (2,5, 10, 15, 30 mins) animals. o. Multiple molecular weight i.c.m. tracers around the transverse sinus 30, 60, and 5 minutes post injection. Scale = 2 mm, inset = 200 μm. p. Rate of appearance of i.c.m. tracers of different molecular weight and chemical properties in the dura mater. Mean ± SEM. N = 4 (5 min), 5 (15, 30, 60 mins) animals. q. Slope of i.c.m. tracers appearing in the dura. Mean ± SEM. N = 4 (5 min), 5 (15, 30, 60 mins) animals, one-way ANOVA with Sidak’s multiple comparisons test.
Extended data Fig. 2. Molecular mapping of…
Extended data Fig. 2. Molecular mapping of the leptomeningeal stroma
a. Representative images of stromal…
Extended data Fig. 2. Molecular mapping of the leptomeningeal stroma
a. Representative images of stromal populations in dissected leptomeninges including markers of arachnoid barrier cells (ABCs; E-Cadherin), fibroblasts (CD13, Aldh1a2), macrophages (CD206), and vasculature (αSMA, vWF, PECAM-1). Scale = 50 μm. b. Dotplot of marker genes for cell types, with extended characterization of ABCs, colored by expression level, and scaled by proportion expressing the gene. c. UMAPs of leptomeninges in different conditions, colored by cell type. EAE = experimental autoimmune encephalomyelitis. d. Representative images of selected markers for ABCs (Cdh1), DBCs (Slc47a1), pial and perivascular fibroblasts (Cemip). Scale = 100 μm, inset = 20 μm. e. Multiplexed IHC imaging of selected markers for ABCs (Msln, E-Cad, Dpp4, Fn1), relative to the pial basement membrane (pan-laminin). Scale = 100 μm, inset = 20 μm. f. 23-plex IHC imaging of glial markers (Aqp4, GFAP, Iba1), macrophage markers (Lyve1, CD206, Iba1), vascular markers (Cdh5, vWF, αSMA, Cldn5, Podxl), and leptomeningeal stroma (pan: CD13, Pdpn; ABCs: Dpp4; DBCs: Slc38a2; Pial/arachnoid fibroblasts: Collagen I, Slc6a13). Scale = 4 mm, inset = 100 μm. g. Representative images of colocalization of a novel ABC marker (Dpp4) with known ABC marker epithelial membrane antigen (EMA) in human dura-arachnoid granulation sections. Scale = 2 mm, insets = 200 μm. h. UMAP of subclustered pial/arachnoid fibroblasts (11,092 nuclei). i. Marker genes for pial, arachnoid, and interferon (IFN)-responsive fibroblast clusters. j. Ontologies enriched in marker genes for each pial/arachnoid fibroblast subcluster. Enriched gene ontologies were calculated in ENRICHR using the Fisher exact test. k. RNAscope staining of pial/perivascular fibroblasts (Cemip), arachnoid fibroblasts (Rspo2), and ABCs (Cdh1). FB = fibroblasts, PV = perivascular. Scale = 100 μm, inset = 200 μm. l. UMAP of subclustered ABCs (1,871 nuclei). m. Ontologies enriched in marker genes for each ABC subcluster. Enriched gene ontologies were calculated in ENRICHR using the Fisher exact test. n. Enrichment of cell type-specific gene sets from the Descartes cell type atlas in ABCs, colored by the cell class. Enriched gene ontologies were calculated in ENRICHR using the Fisher exact test. o. Leptomeningeal cell populations colored by expression score for core mesothelial genes. p. Leptomeningeal cell populations colored by expression score for core epithelial genes. q. Leptomeningeal cell populations colored by expression score for core fibroblast genes.
Extended data Fig. 3. Additional characterization of…
Extended data Fig. 3. Additional characterization of leptomeningeal stroma.
a. Electron micrographs of leptomeninges following…
Extended data Fig. 3. Additional characterization of leptomeningeal stroma.
a. Electron micrographs of leptomeninges following i.c.m. injection of the electron microscopy (EM)-detectable tracer HRP. Representative images of the vesicle uptake by the major stromal cell types. ABC = arachnoid barrier cell. A-FB = arachnoid fibroblast. P-FB = pial fibroblast. Astro. = astrocyte. Arrowheads indicate HRP-positive vesicles, arrows indicate collagen bundles. Scale = 1 μm, inset = 200 nm. b. Density of HRP-positive vesicles in ABCs and leptomeningeal endothelial cells (ECs, including both arterial (aECs) and venous ECs (vECs)). Mean ± SEM. N = 5 animals, unpaired, two-tailed Student’s t-test. Arrowheads indicate HRP-positive vesicles. Arrows indicate collagen bundles. c. Negative stain EM of vesicles in ABCs, leptomeningeal endothelial cells, and capillary endothelial cells (cECs). Arrowheads indicate vesicles. Scale = 250 nm. d. Quantification of the density of vesicles in ABCs, leptomeningeal endothelial cells (aECs and vECs pooled), and capillary endothelial cells (cECs). Mean ± SEM. N = 5 animals, one-way ANOVA with Sidak’s multiple comparisons test. e. Intravital two-photon imaging of uptake of i.c.m. tracers in Cx3cr1-EGFP mice. Arrowhead indicates i.v. tracer-positive macrophage. Scale = 100 μm, inset = 20 μm. f. Experimental design and confocal images of vesicular uptake of i.c.m. 70 kDa dextran by macrophages (Cx3cr1, CD206) but not ABCs (E-Cad) in the leptomeninges of wild type and Cx3cr1-EGFP mice. Arrowheads indicate macrophages taking up tracer. Scale = 20 μm. g. Dotplot of unique and shared junction components in ABCs, vECs, and aECs, colored by expression level, and scaled by proportion expressing the gene. h. Representative images of ABC tight junctions in negative stain EM, and i.c.m. HRP injected animals. Arrowheads indicate tight junctions. Scale = 100 nm, inset = 50 nm. i. Flat mounted leptomeninges from approximately one dorsal hemisphere, showing ubiquitous continuous E-Cad-positive junctions between ABCs. Arrowheads indicate continuous adherens junctions. Scale = 2 mm, inset = 20 μm. j. Tight junctions formed between ABCs, including the ABC-specific junctional marker Cldn11. Colocalization with the pan-tight junction marker Ocln and ABC adherens junction marker E-Cad are shown. Scale = 25 μm, inset = 2 μm.
Extended data Fig. 4. Additional characterization of…
Extended data Fig. 4. Additional characterization of leptomeninges targeting mice.
a. Confocal imaging of Prox1 …
Extended data Fig. 4. Additional characterization of leptomeninges targeting mice.
a. Confocal imaging of Prox1-EGFP and Cdh5-CreERT2::tdTom brains co-labeled with markers for ABCs (E-Cad, Dpp4), Fibroblasts (CD13, Aldh1a2), and the pial basement membrane (pan-laminin). Brain = 2 mm, scale = 50 μm, inset = 10 μm. b. Dotplot of Prox1 and Cdh5 expression in leptomeningeal cell types, colored by expression level, and scaled by percentage expression. c. UMAP of leptomeningeal cells, colored by expression level of Prox1 and Cdh5. d. Gating strategy and representative histograms of reporter expression in CD45−/CD31−/Pdpn+ fibroblasts. e. Efficiency of Cdh5-CreERT2::tdTom and Prox1-EGFP for targeting fibroblasts and endothelial cells in the leptomeninges and dura. Mean ± SEM. N = 5 animals, unpaired, two-tailed Student’s t-test. f. Representative images of the brain, lung, small intestine, heart, and liver of Dpp4-CreERT2::zsGreen mice. Scale = 2 mm, inset = 200 μm. g. zsGreen coverage in the leptomeninges of Dpp4-CreERT2::zsGreen. Mean ± SEM. N = 10 animals. h. qPCR of Dpp4 gene expression in the leptomeninges of Dpp4-CreERT2 negative and heterozygous mice. Mean ± SEM. N = 6 animals, unpaired, two-tailed student’s t-test. i. Representative images of the brain, lung, small intestine, heart, and liver of Slc47a1-CreERT2::tdTom mice. Scale = 2 mm, inset = 200 μm. j. tdTomato coverage in the leptomeninges of Slc47a1-CreERT2::tdTom. Mean ± SEM. N = 7 animals. k. qPCR of Slc47a1 gene expression in the leptomeninges of Slc47a1-CreERT2 negative and heterozygous mice. Mean ± SEM. N = 4 (Cre negative) 6 (Cre positive) animals, unpaired, two-tailed student’s t-test. l. Intravital two-photon imaging of i.c.m. tracers in Dpp4-CreERT2::zsGreen mice. Arrowheads indicate i.v. tracer-positive cells, arrows indicate arachnoid barrier. Scale = 100 μm, inset = 20 μm.
Extended data Fig. 5:. Mapping the anatomy…
Extended data Fig. 5:. Mapping the anatomy and stroma of ACE points.
a. RNAscope for…
Extended data Fig. 5:. Mapping the anatomy and stroma of ACE points.
a. RNAscope for the pial/perivascular fibroblast (FB) marker Cemip at an arachnoid cuff exit (ACE) point in a flat mounted dura mater. Scale = 200 μm. b. RNAscope for the dural border cell (DBC) marker Slc47a1 at an ACE point in a flat mounted dura mater. Scale = 200 μm. c. Immunostaining for the arachnoid fibroblast marker Crabp2 at an ACE point in a flat mounted dura mater. Scale = 200 μm. d. Immunostaining for the vascular smooth muscle marker αSMA at an ACE point in a flat mounted dura mater. Scale = 200 μm. e. Prox1-positive fibroblasts (FBs) and lymphatic vessels around an ACE point in a Prox1-EGFP mouse. Scale = 200 μm. f. Matched stereomicroscopy and two-photon intravital imaging of an ACE point around a bridging vein in a Prox1-EGFP mouse. Arrowheads indicate bridging veins. Scale = 2 mm, inset = 200 μm. g. Matched stereomicroscopy and two-photon intravital imaging of an ACE point around a bridging vein in a Dpp4-CreERT2::tdTomato mouse. Arrowheads indicate bridging veins. Scale = 2 mm, inset = 200 μm. h. Volume rendering and diagram of an ACE point in a Cdh5-CreERT2::tdTom mouse. Scale = 200 μm. i. Volume rendering and diagram of an ACE point in a Prox1-EGFP mouse. Scale = 200 μm. j. Volume rendering and diagram of an ACE point in Dpp4-CreERT2::zsGreen mice. Scale = 200 μm. k. Volume rendering and diagram of an ACE point in Slc47a1-CreERT2::tdTom mice. Scale = 200 μm. l. Transition of endothelial phenotype at ACE points. Staining for BBB endothelial marker GLUT-1 to peripheral endothelial marker PLVAP at ACE points. Arrowheads indicate bridging veins. Scale = 200 μm. m. Transition of endothelial phenotype at ACE points. Staining for BBB endothelial tight junction Cldn5, and pan-endothelial junction marker PECAM-1 at an ACE point. Scale = 200 μm, inset = 100 μm, high-magnification = 10 μm. n. Line profile of normalized GLUT1 and E-Cad intensity on bridging veins through the ACE point. N = 27 bridging veins across 5 animals, mean ± SEM of bridging veins.
Extended data Fig. 6. Additional characterization of…
Extended data Fig. 6. Additional characterization of CSF efflux at ACE points.
a. Experimental design…
Extended data Fig. 6. Additional characterization of CSF efflux at ACE points.
a. Experimental design for examination of CSF tracer accumulation around bridging veins in the dura mater. b. Progressive OVA accumulation around the bridging veins and in the dura mater following i.c.m. injection. Scale 200 μm. c. Progressive dextran (3 kDa) accumulation around the bridging veins and in the dura mater following i.c.m. injection. Scale 200 μm. d. Schematic and map of ACE points across healthy wild-type mice. N = 14 animals, each color represents the complement of ACE points from a different animal. e. e. Experimental design for correlative transcranial and two-photon imaging of CSF efflux at ACE points. f. Correlative stereomicroscopy and two-photon imaging of CSF tracer efflux at ACE points in Cdh5-CreERT2::tdTom mice. Scale = 100 μm. g. Correlative stereomicroscopy and two-photon imaging of CSF tracer efflux at ACE points in Dpp4-CreERT2::zsGreen mice. Scale = 100 μm. h. Two-photon intravital imaging of i.c.m. dextran flow to the dura mater through an ACE point in Prox1-EGFP mice. Scale = 200 µm. i. CSF tracer accumulation around bridging veins near the rostral rhinal vein (above the olfactory bulb) in cleared heads. Scale = 1 mm. j. CSF tracer accumulation around bridging veins in tentorial folds of the dura mater. Arrowheads indicate i.c.m.-tracer around tentorial bridging veins. Scale = 1 mm. k. Flat mounted dura mater highlighting ACE points near the rostral rhinal vein and transverse sinus hot-spots (yellow arrowheads), as well as ACE points elsewhere in the dura mater (white arrowheads). Scale = 2 mm, inset = 200 μm. l. Matched intravital transcranial imaging of i.c.m.-injected AlexaFluor-647-labelled bovine serum albumin (BSA) and ex vivo fixed dura mater. Note that the same bridging veins which show CSF flow (yellow arrowheads) in the intravital imaging experiment show tracer labeling while those that did not do not (white arrowheads). Scale = 2 mm, inset = 200 μm. m. Volume renderings of cleared tentorial regions underlying the transverse sinus hot-spots following i.c.m. injection of 70 kDa dextran. Yellow arrowheads depict ACE points with tracer enhancement while white arrowheads depict those without. Scale = 2 mm, inset = 200 μm.
Extended data Fig. 7. Additional characterization of…
Extended data Fig. 7. Additional characterization of influx of intravenous and dural tracers at ACE…
Extended data Fig. 7. Additional characterization of influx of intravenous and dural tracers at ACE points.
a. Experimental paradigm for examining the distribution of i.v. tracers on the brain surface. b. i.v. dextran on the surface of the brain. Scale = 2 mm, inset = 200 μm. c. i.v. dextran in the subarachnoid space and around leptomeningeal vasculature on the surface of the brain. Scale = 200 μm. d. Images of i.v. dextran on the surface of the brain, in the cortex, choroid plexus, hippocampus, and cerebellum 60 minutes following i.v. injection through either the tail vein or retroorbital route. Scale = 2 mm, inset = 200 μm. e. Intensity of i.v. dextran on the surface of the brain 60 minutes following i.v. injection through either the tail vein or retroorbital route. Mean ± SEM. N = 5 animals, two-tailed, unpaired Student’s t-test. f. Area of i.v. dextran on the surface of the brain 60 minutes following i.v. injection through either the tail vein or retroorbital route. Mean ± SEM. N = 5 animals, two-tailed, unpaired Student’s t-test. g. Area of i.v. dextran in the brain 60 minutes following i.v. injection through either the tail vein or retroorbital route. Mean ± SEM. N = 5 animals, two-tailed, unpaired Student’s t-test. h. Intensity of i.v. dextran in the brain 60 minutes following i.v. injection through either the tail vein or retroorbital route. Mean ± SEM. N = 5 animals, two-tailed, unpaired Student’s t-test. i. Representative images of biotin staining in flat mounted dura mater from negative control and transcranial biotin tracer duras. Arrowheads represent tracer-positive bridging veins. Scale = 4 mm. j. Quantification of the intensity of biotin tracer in the dura mater and on the dorsal brain surface. Mean ± SEM. N = 3 animals, unpaired two-tailed Student’s t-test. k. Representative images of biotin tracer signal in the leptomeninges of sagittal brain sections. Scale = 1 mm, inset = 100 μm. l. High-resolution image of transcranially applied biotin tracer around a bridging vein in the dorsal dura mater. Scale = 100 μm. Light sheet imaging of transcranially applied biotin and around a bridging vein in a cleared brain. Scale = 100 μm. m. Confocal images of transcranial biotin labeling associated with surface and deep veins, surface arteries, and absent in the capillary bed ten minutes after tracer administration. Scale = 200 μm. n. Stereomicroscopy and sagittal sections of the brain following transcranial application of sulfo-NHS-biotin. Arrowheads indicate enhancement around bridging veins. Scale = 2 mm. o. Intensity of biotin signal in the brain surface in stereomicroscopy images. Mean ± SEM. N = 4 animals, one-way ANOVA with Dunnett’s post-hoc test. 0 v 10 min, p = 0.010, 0 vs 60 min, p < 0.0001. p. Intensity of biotin signal in the leptomeninges, cortex, and choroid plexus in sagittal sections. Mean ± SEM. N = 4 animals, two-way ANOVA with Tukey’s post-hoc test. 0 v 5 min, p = 0.0048, 0 v 10 min, p < 0.0001, 0 vs 60 min, p < 0.0001.
Extended data Fig. 8. Stromal Sema3a restrains…
Extended data Fig. 8. Stromal Sema3a restrains myeloid infiltration to the CNS.
a. Volcano plot…
Extended data Fig. 8. Stromal Sema3a restrains myeloid infiltration to the CNS.
a. Volcano plot of differences in gene expression in arachnoid barrier cells (ABCs) in aged mice (20 month), compared to control ABCs (2 month). Benjamini-Hochberg’s adjustment was used to calculate multiplicity-adjusted p-values from from unpaired two-tailed t-tests. b. Selected significantly enriched gene ontologies in differentially expressed genes (DEGs) in control and aged ABCs. The number of DEGs as a fraction of the total gene ontology is given. Enriched gene ontologies were calculated in ENRICHR using the Fisher exact test. c. Images of the BBB marker GLUT-1 in bridging veins in young and aged mice. Scale = 200 μm. d. Expression of GLUT-1 within ACE points in young and aged mice. Mean ± SEM. N = 4 (aged), 5 (young), unpaired two-tailed Student’s t-test. e. Representative gating strategy for leptomeningeal and dural immune populations. Frequency of immune populations in the leptomeninges (lepto) and dura mater of healthy control mice. Mean ± SEM. N = 13 (lepto and dura B cells, cDCs, CD4, CD8), N = 15 (lepto monocytes), N = 18 (macrophages, lepto neutrophils, dura monocytes), N = 21 (dura neutrophils) animals, unpaired two-tailed Student’s t-test. f. ELISA of leptomeningeal Sema3a and Sema3d in healthy wild type mice. Mean ± SEM. N = 4 (Sema3a), 5 animals. g. ELISA of CSF Sema3a and Sema3d in healthy wild type mice. Mean ± SEM. N = 5 animals. h. Representative images of Sema3a and Sema3d ISH in the healthy brain taken from the Allen Brain Atlas. Scale = 1 mm, inset = 100 μm. i. Experimental design to test the effect of semaphorins on monocyte migration in vitro. j. Relative CCL2-induced monocyte transmigration in the presence of Sema3a or Sema3d. Mean ± SEM. N = 5, one-way ANOVA with Sidak’s multiple comparison test. *** - p < 0.001 vs untreated control, # - p < 0.05 vs CCL2-treated, ## - p < 0.01 vs CCL2-treated. Each point represents cells harvested from one animal. k. Representative images of GFP+ perivascular, leptomeningeal, and dural fibroblasts 21 days following i.c.m. injection of AAV8-GFP (2 × 10¹² GC) in Col1a2-CreERT2::tdTom mice. Brain, dura = 2 mm, scale = 100 μm. l. Representative images of GFP+ dural border cells on the brain and dura 21 days following i.c.m. injection of AAV8-GFP (2 × 10¹² GC) in Slc47a1-CreERT2::tdTom mice. Brain, dura = 2 mm, scale = 100 μm.
Extended data Fig. 9. Changes to stromal…
Extended data Fig. 9. Changes to stromal and immune cells in the leptomeninges during EAE…
Extended data Fig. 9. Changes to stromal and immune cells in the leptomeninges during EAE and aging.
a. Volcano plot of differences in gene expression in arachnoid barrier cells (ABCs) in experimental autoimmune encephalomyelitis (EAE), compared to control ABCs. Benjamini-Hochberg’s adjustment was used to calculate multiplicity-adjusted p-values from unpaired two-tailed t-tests. b. Representative images of GR-1-positive myeloid cells within ACE points in a flat mount of the spinal cord dura mater and leptomeninges of a mouse 17 days following EAE induction. Arrowheads indicate GR-1 positive myeloid cells within the perivascular region of the ACE point. Scale = 100 μm. c. Volcano plot of differences in gene expression in pial/arachnoid fibroblasts in EAE, compared to control pial/arachnoid fibroblasts. Benjamini-Hochberg’s adjustment was used to calculate multiplicity-adjusted p-values from unpaired two-tailed t-tests. d. Selected significantly enriched gene ontologies in differentially expressed genes (DEGs) in control and EAE pial/arachnoid fibroblasts. Enriched gene ontologies were calculated in ENRICHR using the Fisher exact test. e. Volcano plot of differences in gene expression in dural border cells (DBCs) in EAE, compared to control DBCs. Benjamini-Hochberg’s adjustment was used to calculate multiplicity-adjusted p-values from unpaired two-tailed t-tests. f. Selected significantly enriched gene ontologies in differentially expressed genes (DEGs) in control and EAE DBCs. Enriched gene ontologies were calculated in ENRICHR using the Fisher exact test. g. Fold changes in cell abundances in snRNA-seq from control and EAE leptomeninges, with significant differences highlighted. Mean ± 95 % CI. Data were analyzed with a permutation test of 1000 iterations to obtain the p-value and bootstrapping to obtain the confidence interval. h. Gating strategy to examine changes to immune cell populations in EAE. i. Frequency of CD45+ immune cells, as a percentage of live cells, in control and EAE leptomeninges. Mean ± SEM. N = 5 animals, unpaired two-tailed Student’s t-test. j. Frequency of CD4+ T cells, as a percentage of CD45+ cells, in control and EAE leptomeninges. Mean ± SEM. N = 5 animals, unpaired two-tailed Student’s t-test. k. Frequency of Ror-γt+ T helper 17 (Th17), as a percentage of CD4+ T cells, in control and EAE leptomeninges. Mean ± SEM. N = 5 animals, unpaired two-tailed Student’s t-test. l. Density of CD3+ T cells around ACE points, sinus regions, and non-sinus regions in the dura of control and EAE mice. Mean ± SEM. N = 3 (sham control), 8 (EAE) animals, two-way ANOVA with Sidak’s multiple comparison adjustment. m. Frequency of MHC-II+/CD38− macrophages, as a percentage of CD206+ leptomeningeal macrophages, in control and EAE leptomeninges. Mean ± SEM. N = 5 animals, unpaired two-tailed Student’s t-test. n. Frequency of MHC-II−/CD38+ macrophages, as a percentage of CD206+ leptomeningeal macrophages (Macs), in control and EAE leptomeninges. Mean ± SEM. N = 5 animals, unpaired two-tailed Student’s t-test. o. Frequency of neutrophils in control and EAE leptomeninges. Mean ± SEM. N = 5 animals, unpaired two-tailed Student’s t-test. p. Frequency of Ly-6Chi monocytes in control and EAE leptomeninges. Mean ± SEM. N = 5 animals, unpaired two-tailed Student’s t-test. q. Representative images of GR-1-positive myeloid cells within ACE points in a flat mount of the spinal cord dura mater and leptomeninges of a mouse 17 days following EAE induction. Arrowheads indicate GR-1 positive myeloid cells within the perivascular region of the ACE point. Scale = 100 μm. r. Representative images of CD3+ T cells within ACE points in a flat mount of the cranial dura mater of a mouse 17 days following EAE induction. Arrowheads indicate T cells within the perivascular region of the ACE point. Scale = 200 μm, inset = 20 μm.
Extended data Fig. 10. Itga6-laminin interactions govern…
Extended data Fig. 10. Itga6-laminin interactions govern the entry of immune cells to the CNS…
Extended data Fig. 10. Itga6-laminin interactions govern the entry of immune cells to the CNS around ACE points.
a. Laminin immunolabeling around ACE points and in non-sinus regions of the dura mater. Scale = 200 μm. b. Quantification of laminin staining intensity in non-sinus dura, sinus, and ACE points. Mean ± SEM. N = 5 animals, one-way ANOVA with with Sidak’s multiple comparison adjustment. c. Dotplot of laminin genes in stromal populations of the leptomeninges from single nuclear RNA-sequencing, scaled by percentage of cells expressing a given gene, and its expression level. d. Experimental paradigm for treatment of mice with anti-Itga6 antibodies in EAE and clinical scores of mice treated with isotype control, or anti-Itga6 antibody during EAE induction. Mean ± SEM. N = 6 (anti-Itga6), 9 (isotype) animals, two-way repeated measures ANOVA with Sidak’s multiple comparison adjustment. e. Representative images of CD45 and S100A8 staining in spinal cord sections in isotype control and anti-Itga6 treated mice at the peak of EAE (day 17). Scale = 1 mm, inset = 100 μm. f. Density of CD45+ area in the spinal cord of isotype control and anti-Itga6 treated mice at the peak of EAE (day 17). Mean ± SEM. N = 10 animals, two-tailed, unpaired Student’s t-test. g. Density of S100A8+ neutrophils in the spinal cord of isotype control and anti-Itga6 treated mice at the peak of EAE (day 17). Mean ± SEM. N = 10 animals, two-tailed, unpaired Student’s t-test. h. Representative gating strategy for immune cells in the blood, spinal cord, and dura of EAE mice. i. Ly-6Chi monocyte frequency in the blood, spinal cord, and dura of EAE mice treated with either isotype control or anti-Itga6 antibody at the peak of EAE (day 17). Mean ± SEM. N = 10 (blood, spinal dura), 15 (spinal cord) animals, two-tailed, unpaired Student’s t-test. j. Neutrophil frequency in the blood, spinal cord, and dura of EAE mice treated with either isotype control or anti-Itga6 antibody at the peak of EAE (day 17). Mean ± SEM. N = 10 (blood, spinal dura), 15 (spinal cord) animals, two-tailed, unpaired Student’s t-test. k. Staining for S100A8-positive neutrophils around bridging veins in isotype control and anti-Itga6 treated mice at the peak of EAE (day 17). Scale = 200 μm. l. Density of neutrophils around bridging veins in isotype control and anti-Itga6 treated mice at the peak of EAE (day 17). Mean ± SEM. N = 10 animals, two-tailed, unpaired Student’s t-test. m. T cell frequency in the blood, spinal cord, and dura of EAE mice treated with either isotype control or anti-Itga6 antibody at the peak of EAE (day 17). Mean ± SEM. N = 10 (blood, spinal dura ), 15 (spinal cord) animals, two-tailed, unpaired Student’s t-test. n. CD4 T cell frequency in the blood, spinal cord, and dura of EAE mice treated with either isotype control or anti-Itga6 antibody at the peak of EAE (day 17). Mean ± SEM. N = 10 (blood, spinal dura), 15 (spinal cord) animals, two-tailed, unpaired Student’s t-test. o. Staining for CD3-positive T cells around bridging veins in isotype control and anti-Itga6 treated mice at the peak of EAE (day 17). Scale = 200 μm. p. Density of CD3-positive T cells around bridging veins in isotype control and anti-Itga6 treated mice at the peak of EAE (day 17). Mean ± SEM. N = 10 animals, two-tailed, unpaired Student’s t-test.
Fig. 1:. Functional characterization of the arachnoid…
Fig. 1:. Functional characterization of the arachnoid barrier.
a. Working model for fluid flow in…
Fig. 1:. Functional characterization of the arachnoid barrier.
a. Working model for fluid flow in the brain. b. Arachnoid barrier marker E-Cadherin (E-Cad) in a coronal brain section. Scale = 1 mm. c. Electron micrograph of the leptomeninges, highlighting the different cell types present. Scale = 5 μm. d. Sequencing of leptomeningeal nuclei, taken from healthy mice (N = 3 independent sequencing runs with nuclei pooled from N = 5 mice), EAE mice (day 16 - peak, N = 1 with nuclei pooled from N = 5 mice), and aged mice (18–20 months old, N = 1 with nuclei pooled from N = 5 mice). UMAP of nuclei (31,346 nuclei) from all conditions, colored by cell type, containing 1871 ABC nuclei. ABC = arachnoid barrier cell. aEC = arterial endothelial cell. cDC = conventional dendritic cell. migDC = migratory dendritic cell. DBC = dural border cell. vSMC = vascular smooth muscle cell. vEC = venous endothelial cell. e. Selected significantly enriched cellular component and biological process gene ontologies in marker genes for ABCs. The fraction of marker genes of the total gene ontology is given. Ontologies are colored by related processes. Enriched gene ontologies were calculated in ENRICHR using the Fisher exact test. f. UMAP of leptomeningeal populations colored by Dpp4 expression. g. Confocal imaging of Dpp4-CreERT2::zsGreen brains co-labeled with markers for ABCs (E-Cad, Dpp4), and the pial basement membrane (pan-laminin). Brain = 2 mm, scale = 50 um, inset = 10 μm. h. UMAP of leptomeningeal populations colored by Slc47a1 expression. i. Confocal imaging of Slc47a1-CreERT2::tdTom brains co-labeled with markers for ABCs (E-Cad), and the pial basement membrane (pan-laminin). Slc47a1-CreERT2::zsGreen dura flat mount. Brain, dura = 2 mm, scale = 50 μm, inset = 10 μm.
Fig. 2. Perivenous discontinuities in the arachnoid…
Fig. 2. Perivenous discontinuities in the arachnoid barrier allow CSF efflux to the dura mater.
a. Macroscopic image of dorsal bridging veins, also known as cerebral veins, draining into the superior sagittal sinus. Arrowheads indicate bridging veins. Scale = 1 mm. b. Cuffs of ABCs (labeled with Dpp4) around bridging veins in Dpp4-CreERT2::zsGreen mice, and wild-type mice (labeled with E-Cad and Cldn11). Arrowheads indicate bridging veins. Scale = 500 μm, inset = 100 μm. c. Lymphatic vessels associated with to ACE points in the dura mater of Prox1-EGFP mice and wild-type mice. Scale = 200 μm. d. Intravital transcranial imaging of i.c.m. dextran flow to the perivascular spaces of bridging veins (arrowheads are bridging veins, and are colored yellow for veins receiving tracer). Scale = 1 mm. e. Two-photon intravital imaging of i.c.m. dextran flow to the dura mater through an ACE point in Dpp4-CreERT2::zsGreen mice. Scale = 200 µm. Matched flat mounted dura demonstrating i.c.m. tracer around the same bridging vein. Scale = 200 µm.
Fig. 3. ACE points allow dural molecules…
Fig. 3. ACE points allow dural molecules to enter the subarachnoid space.
a. Experimental design…
Fig. 3. ACE points allow dural molecules to enter the subarachnoid space.
a. Experimental design for detecting i.v.-injected 10 kDa dextran in the brain. Stereomicroscopy of the dorsal brain surface 60 minutes after i.v. dextran injection. Scale = 2 mm, inset = 200 µm. b. Representative images of i.v. tracer around large leptomeningeal veins and in macrophages within the subarachnoid space. Arrowheads indicate i.v. tracer-positive cells. SAS = subarachnoid space. Scale = 200 µm. c. Stereomicroscopy of the dorsal brain surface 10 minutes after transcranial application of sulfo-NHS-biotin. Arrowheads indicate tracer positive regions around bridging veins. Scale = 1 mm. d. Transcranial biotin labeling in the subarachnoid space 10 minutes after after transcranial application of sulfo-NHS-biotin. Arrowheads represent tracer within the subarachnoid space. Scale = 2 mm, inset = 100 μm. e. Experimental design and western blot for biotinylated proteins in the CSF 10 minutes after after transcranial application of sulfo-NHS-biotin. f. Working model for fluid flow in the brain, with the addition of ACE points.
Fig. 4. Enhancement of i.v. tracers around…
Fig. 4. Enhancement of i.v. tracers around bridging veins in healthy human subjects.
a. Experimental…
Fig. 4. Enhancement of i.v. tracers around bridging veins in healthy human subjects.
a. Experimental paradigm for examining the influx of i.v. tracers into the CSF of healthy subjects. b. Sagittal anatomical scans and 3-tesla real-IR scans of CSF gadolinium-based contrast agent (GBCA) enhancement in a healthy adult at baseline, then 15-, 45-, and 240-min post injection. c. Volume of enhancing areas at 15- and 240-minutes post i.v. GBCA injection. N=5 participants, two-tailed paired t-test. d. Intensity (contrast to noise ratio, CNR) of enhancing areas around bridging veins at baseline, then 15 and 240 minutes post i.v. GBCA injection. N=5 participants, repeated measures one-way ANOVA with Tukey’s post-hoc test. e. Intensity (contrast to noise ratio, CNR) of the lateral ventricles at baseline, then 15 and 240 minutes post i.v. GBCA injection. N=5 participants, repeated measures one-way ANOVA. f. Sagittal images of 3-tesla real-IR of a bridging vein showing enhancement and matched 7-tesla T2*-weighted axial and coronal images from the same healthy adult. Arrowheads denote the enhancing vessel. Dashed yellow line in real-IR images shows the plane of the axial scan. Dashed yellow lines on T2*-weighted images denote the boundary between the parasagittal dura and subarachnoid space. g. Ultrahigh resolution (0.2 mm isotropic) 7-tesla T2*-weighted axial and coronal images of a bridging vein (arrowheads), showing its subarachnoid location as well as its penetration into junction points within the parasagittal dura from the subarachnoid space. Yellow dashed lines denote the boundary between the subarachnoid space and the parasagittal dura.
Fig. 5. ACE points permit trafficking of…
Fig. 5. ACE points permit trafficking of myeloid cells from the dura to the subarachnoid…
Fig. 5. ACE points permit trafficking of myeloid cells from the dura to the subarachnoid space.
a. Dotplot of the expression of selected chemorepellants in the leptomeningeal stroma, scaled by percentage of cells expressing the gene and expression level. ABC = arachnoid barrier cell, DBC = dural border cell, P/A FB = pial and arachnoid fibroblast. b. ELISA of Sema3a levels in the dura and leptomeninges of wild type mice 21 days following i.c.m. injection of AAV8-GFP or AAV8-Sema3a-shRNA (2 × 10¹² GC). Mean ± SEM. N = 4 (AAV8-GFP), 5 (AAV8-Sema3a shRNA) animals, two-tailed, unpaired Student’s t-test. c. Frequency of Ly-6Chi monocytes and neutrophils in the leptomeninges of mice injected with i.c.m AAV8-GFP or AAV8-Sema3a-shRNA, 21 days after injection. Mean ± SEM. N = 5 animals, unpaired, two-tailed Student’s t-test. d. Selected significantly enriched gene ontologies in differentially expressed genes (DEGs) in control and EAE ABCs. The number of DEGs as a fraction of the total gene ontology is given. EAE = experimental autoimmune encephalomyelitis. Enriched gene ontologies were calculated in ENRICHR using the Fisher exact test. e. Sema3a abundance in leptomeningeal lysates in control and EAE mice at peak of disease. Mean ± SEM. N = 4 (sham control), 5 (EAE) animals, unpaired two-tailed Student’s t-test. f. S100A8-positive neutrophils around bridging veins in the cranial dura at the peak of EAE. Scale = 200 μm. g. Quantification of the density of GR-1-positive myeloid cells around bridging veins (BV), sinus regions, and non-sinus regions in control and EAE duras. Mean ± SEM. N = 8 (sham control), 7 (EAE) animals, two-way ANOVA with Sidak’s multiple comparison adjustment. h. zsGreen-positive myeloid cells in the space between the ABC cuff and vessel wall of an ACE point in a Ms4a3-Cre::zsGreen peak EAE dura. Scale = 200 μm, inset = 10 μm. i. S100A8-positive neutrophils in the space between the ABC cuff and vessel wall of an ACE point in a peak EAE dura. Scale = 100 μm, inset = 10 μm. j. In vivo two-photon imaging of myeloid cell migration around a bridging vein in Ms4a3-Cre::zsGreen monocyte/neutrophil reporter mice at the peak of EAE. Scale = 25 μm. k. Mean track bias in the Y direction in non-bridging vein and bridging vein regions of Ms4a3-Cre::zsGreen monocyte/neutrophil reporter mice at the peak of EAE. Mean ± SEM. N = 3 (non-bridging vein), 4 (bridging vein) regions across 7 animals, unpaired two-tailed Student’s t-test. l. Angle of migration in bridging vein and non-bridging vein regions of Ms4a3-Cre::zsGreen monocyte/neutrophil reporter mice at the peak of EAE. N = 3 – 4 animals, each point represents one tracked cell. m. Total migration distance in bridging vein and non-bridging vein regions of Ms4a3-Cre::zsGreen mice at the peak of EAE. N = 3 – 4 animals, each point represents one tracked cell. n. In vivo two-photon imaging of monocyte migration between the dura and subarachnoid space at an ACE point in a Ccr2-RFP/Prox1-EGFP dual reporter mice at the peak of EAE. Arrowheads indicate the Prox1+ layer. Scale = 200 μm.
Louveau A et al. Structural and functional features of central nervous system lymphatic vessels. Nature 523, 337–341 (2015).
-
PMC
-
PubMed
Rustenhoven J et al. Functional characterization of the dural sinuses as a neuroimmune interface. Cell 184, 1000–1016.e27 (2021).
-
PMC
-
PubMed
Mastorakos P & McGavern D. The anatomy and immunology of vasculature in the central nervous system. Sci. Immunol. 4, eaav0492 (2019).
-
PMC
-
PubMed
Iliff JJ et al. A Paravascular Pathway Facilitates CSF Flow Through the Brain Parenchyma and the Clearance of Interstitial Solutes, Including Amyloid β. Sci. Transl. Med. 4, 147ra111–147ra111 (2012).
-
PMC
-
PubMed
Shah T et al. Arachnoid granulations are lymphatic conduits that communicate with bone marrow and dura-arachnoid stroma. J. Exp. Med. 220, e20220618 (2022).
-
PMC
-
PubMed
Additional references
Murray HC et al. Lamina-specific immunohistochemical signatures in the olfactory bulb of healthy, Alzheimer’s and Parkinson’s disease patients. Commun. Biol. 5, 88 (2022).
-
PMC
-
PubMed
Maric D et al. Whole-brain tissue mapping toolkit using large-scale highly multiplexed immunofluorescence imaging and deep neural networks. Nat. Commun. 12, 1550 (2021).
-
PMC
-
PubMed
Butler A, Hoffman P, Smibert P, Papalexi E & Satija R. Integrating single-cell transcriptomic data across different conditions, technologies, and species. Nat. Biotechnol. 36, 411–420 (2018).
-
PMC
-
PubMed
Lun ATL, McCarthy DJ & Marioni JC A step-by-step workflow for low-level analysis of single-cell RNA-seq data with Bioconductor. Preprint at 10.12688/f1000research.9501.2 (2016).
-
DOI
-
PMC
-
PubMed
McCarthy DJ, Campbell KR, Lun ATL & Wills QF. Scater: pre-processing, quality control, normalization and visualization of single-cell RNA-seq data in R. Bioinformatics 33, 1179–1186 (2017).
-
PMC
-
PubMed