. 2024 Feb;626(7999):626-634.
doi: 10.1038/s41586-024-07018-7. Epub 2024 Feb 7.

Naturally occurring T cell mutations enhance engineered T cell therapies

Affiliations

Naturally occurring T cell mutations enhance engineered T cell therapies

Julie Garcia et al. Nature. 2024 Feb.

Abstract

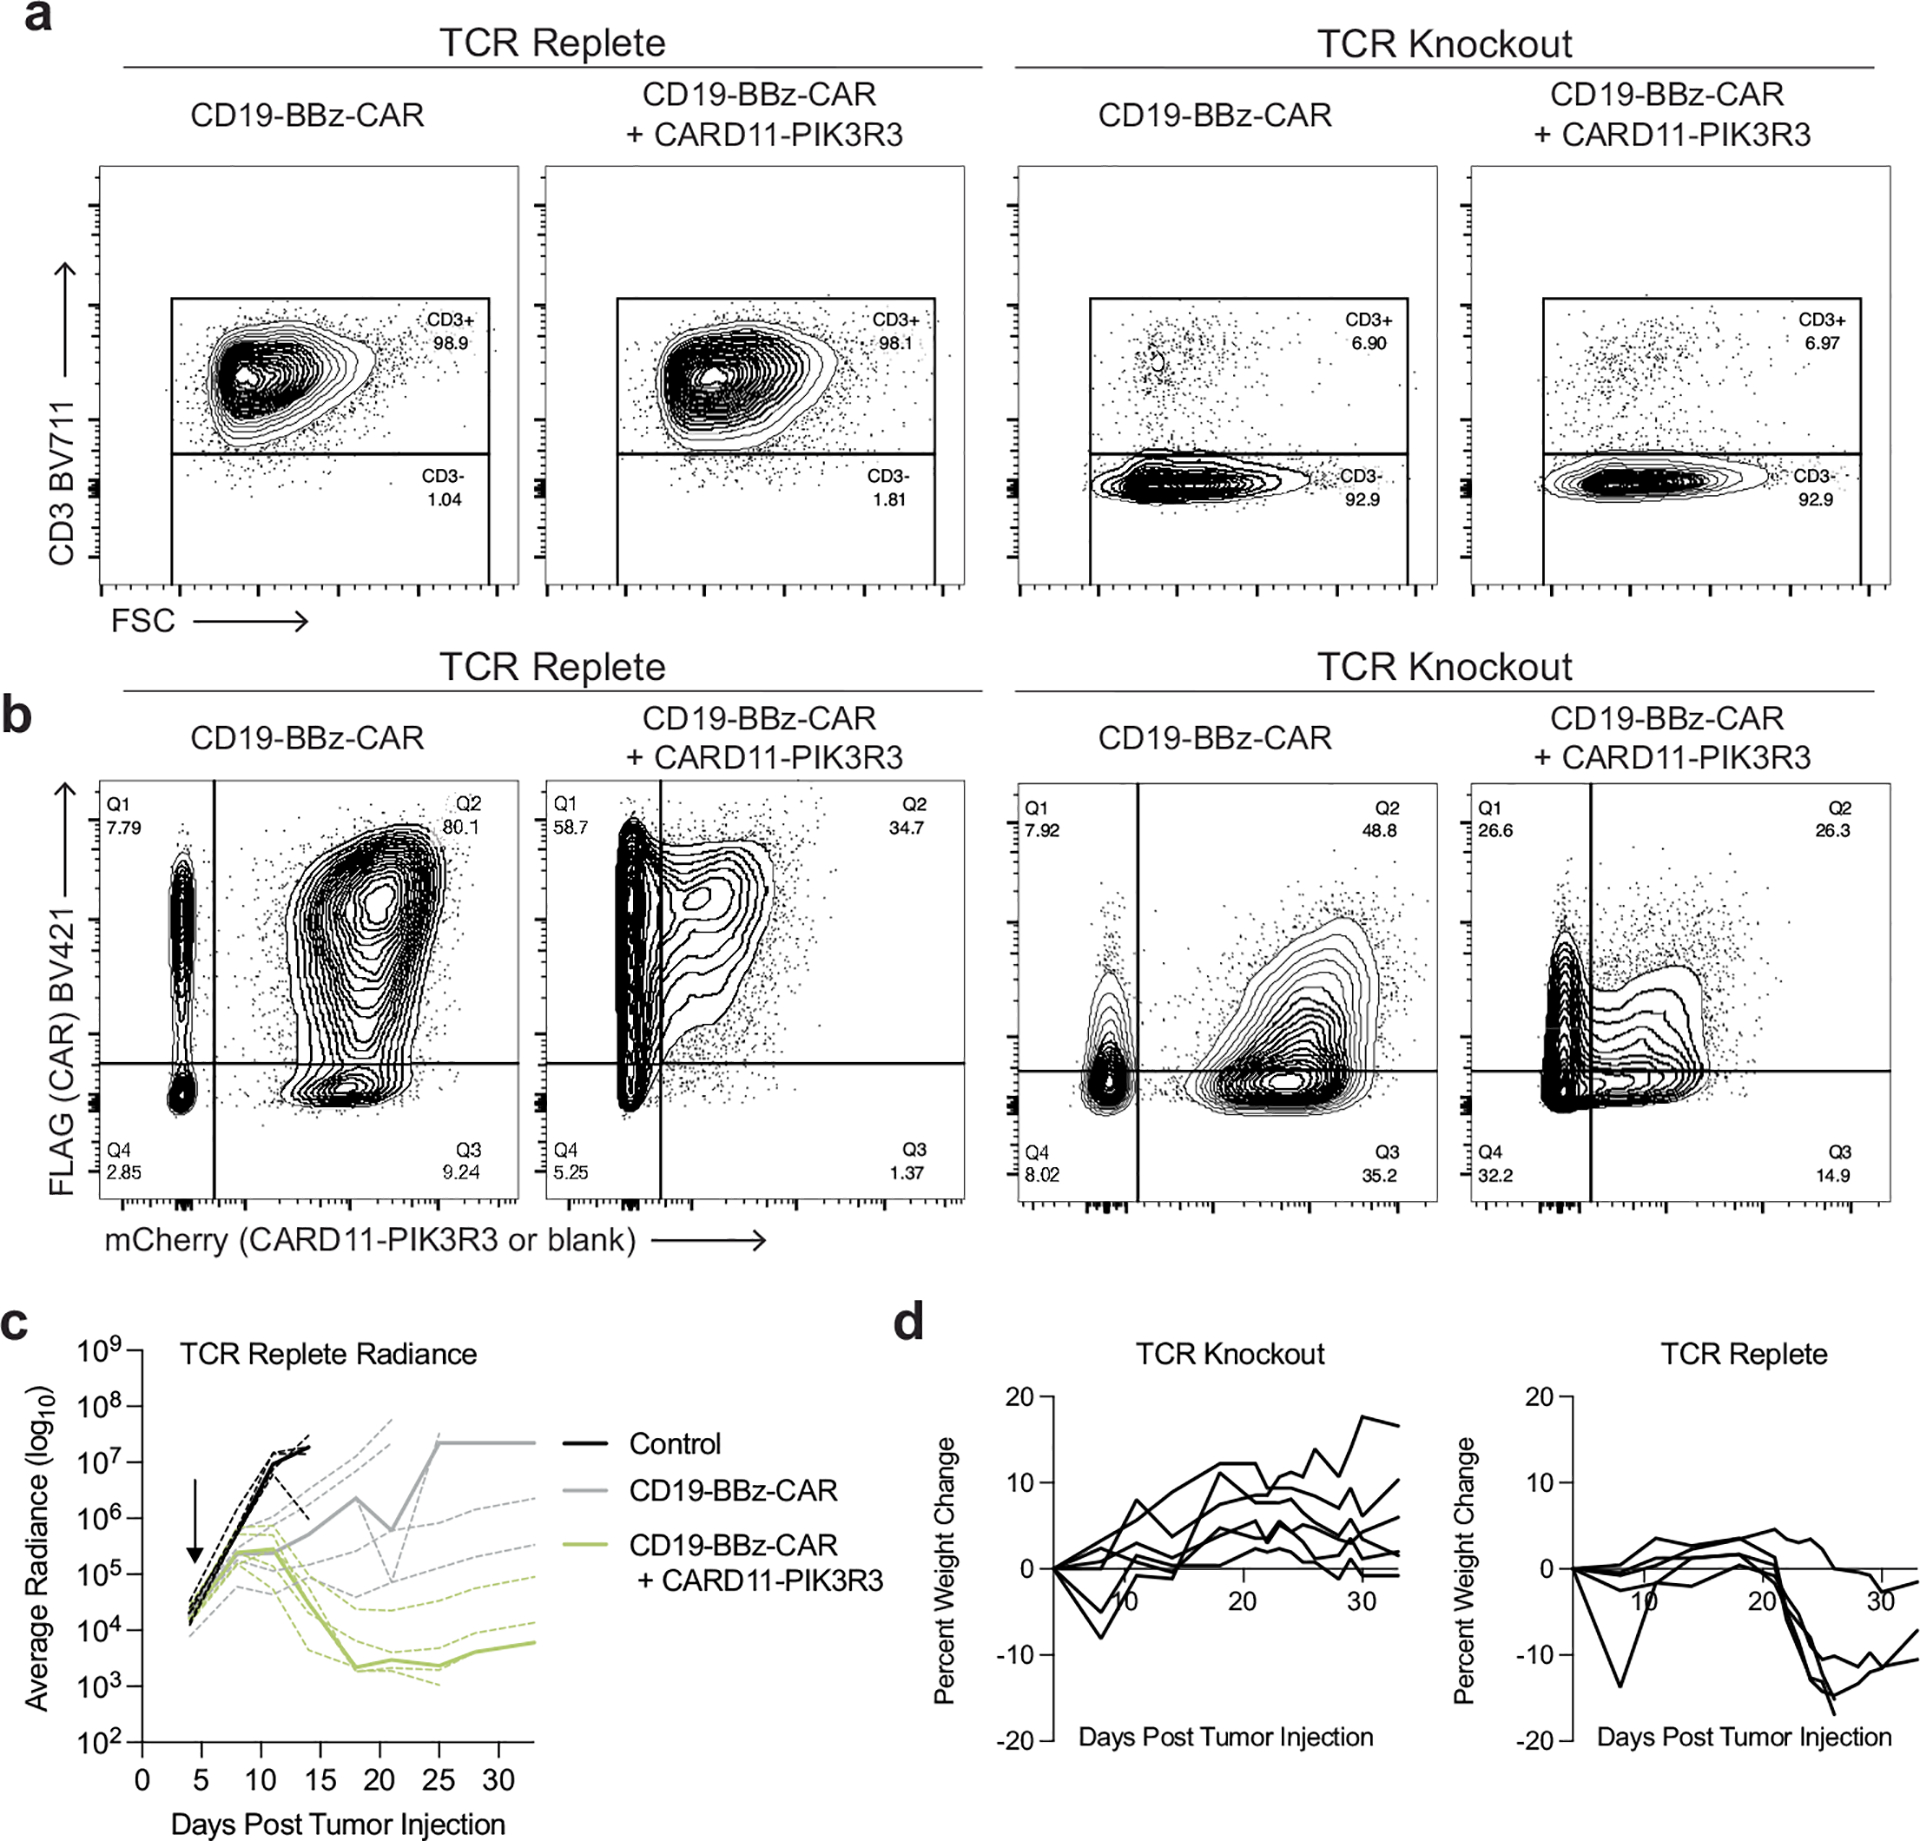
Adoptive T cell therapies have produced exceptional responses in a subset of patients with cancer. However, therapeutic efficacy can be hindered by poor T cell persistence and function1. In human T cell cancers, evolution of the disease positively selects for mutations that improve fitness of T cells in challenging situations analogous to those faced by therapeutic T cells. Therefore, we reasoned that these mutations could be co-opted to improve T cell therapies. Here we systematically screened the effects of 71 mutations from T cell neoplasms on T cell signalling, cytokine production and in vivo persistence in tumours. We identify a gene fusion, CARD11-PIK3R3, found in a CD4+ cutaneous T cell lymphoma2, that augments CARD11-BCL10-MALT1 complex signalling and anti-tumour efficacy of therapeutic T cells in several immunotherapy-refractory models in an antigen-dependent manner. Underscoring its potential to be deployed safely, CARD11-PIK3R3-expressing cells were followed up to 418 days after T cell transfer in vivo without evidence of malignant transformation. Collectively, our results indicate that exploiting naturally occurring mutations represents a promising approach to explore the extremes of T cell biology and discover how solutions derived from evolution of malignant T cells can improve a broad range of T cell therapies.


Conflict of interest statement

Competing interests K.T.R. is a co-founder, consultant, SAB member and stockholder of Arsenal Biosciences and Dispatch Therapeutics. He was a founding scientist and consultant and stockholder in Cell Design Labs, now a Gilead Company. K.T.R. holds stock in Gilead. K.T.R. is an exclusive adviser to Venrock. J.G. and J.D. are founding scientists and stockholders of Moonlight Bio. K.T.R. and J.C. are co-founders and stockholders of Moonlight Bio. K.T.R., J.C., J.G., J.D. and I.Z. are inventors on a University of California, San Francisco and Northwestern University provisional patent for enhancing adoptive T cell therapeutics; 63/412,300.

Figures

Extended Data Fig. 1 |
Extended Data Fig. 1 |. In vitro screening of 28z-CAR and BBz-CAR triple reporter Jurkat cells.
(a) CAR and CD19 expression in cell lines utilized for screening. (b) Percent positive for the indicated reporter construct in 28z-CAR or BBZ-CAR transduced Jurkat cells co-cultured with the indicated cell line (n = 2). (c) Gating strategy to identify library construct transduced Jurkat cells in co-culture. (d) Heatmaps depicting Z scores in vitro screens. Z scores represent mean of two experimental replicates. Z scores are calculated on a row-by-row basis and thus represent different percentage positive values across different experimental conditions, such as with or without CD19 antigen. (e-f) Reproducibility of screening in 28z-CAR Jurkat cells (e) or BBz-CAR Jurkat cells (f). Each replicate indicates an independent lentiviral transduction of Jurkat cells with T cell mutation screening constructs, statistics determined by simple linear regression. (g) Scatterplot indicating CD19–28z CAR (x-axis) and CD19-BBz CAR (y-axis) percent positive for reporter constructs and IL-2 production.
Extended Data Fig. 2 |
Extended Data Fig. 2 |. Point mutations with statistically significant differences compared to wild-type constructs and antigen specificity of mutations.
(a-c) NFAT, NF-κB, and AP-1 reporter activity. Mutations with a statistically significant difference from the wild-type construct are shown. Each row indicates the mutation construct, co-culture condition and CAR construct. Gain of function indicates mutations which increased reporter activity relative to wild-type, while loss of function refers to mutations with lower reporter activity than the wild-type counterpart. Each dot indicates one biological replicate. (d) Percent of constructs with significant effects in the indicated CAR and co-culture condition. ** indicates P value < 0.01, *** indicates P < 0.001, **** indicates P < 0.0001, Chi-squared test.
Extended Data Fig. 3 |
Extended Data Fig. 3 |. Pooled human CAR T cell in vivo persistence screening of T cell mutation library.
(a) Tumor growth curve for mice bearing CD19-K562 subcutaneous tumors treated with vehicle (PBS, control) or 1 × 10⁶ CAR + T cells. (b) Histogram of normalized read count distribution of pre-injection constructs. Constructs with a pre-injection normalized read count of <102 were excluded from analysis. (c) Log2 fold change of CARD11-PIK3R3 normalized reads at each indicated time point in the pooled in vivo experiment (week 1 n = 5, week 2 n = 3, week 3 n = 5). (d) In vitro screen Z scores of mutation constructs identified as positive hits from in vivo screening. Z score represents the mean Z score of two experimental replicates.
Extended Data Fig. 4 |
Extended Data Fig. 4 |. In Vitro Expansion of CD19-BBz-CAR T cells with and without CARD11-PIK3R3.
(a,b) CAR or CAR + CARD11-PIK3R3 were sorted for purity, then expanded with IL-2 for 12 days. On Day 12, cultures were split, reseeding each group without IL-2 (a) and with IL-2 (b). Cells were counted and split from day 12 to day 30. (c) On Day 30, CD19-BBz-CAR + CARD11-PIK3R3 T cells that were cultured with IL-2 were reseeded without IL-2 and counted and split for an additional 10 days.
Extended Data Fig. 5 |
Extended Data Fig. 5 |. In vitro analysis of CARD11-PIK3R3 expressing T cells.
(a) Principal component analysis of transcriptomes of human BBz-CAR T cells. (b) Representative histogram of ICOS expression on CD19-BBz-CAR T cells 24 h after co-culture with CD19-K562s. (c) Activation markers expressed on CD8+ CD19–28z-CAR T cells after 24 h co-cultured with CD19-K562s. Ratio of MFI (CAR + CARD11-PIK3R3/CAR) shown. P values determined by two-tailed unpaired T test. (d) Activation markers expressed on untransduced and CARD11-PIK3R3 CD4+ and CD8 + T cells after 24 h co-cultured with CD19-K562s. P values determined by two-tailed ratio paired T test with Holm-Sidak correction for multiple comparisons. (e) Cytokine secretion of CD8 + CD19− CD28z-CAR T cells 48 h post 1:1 co-culture with CD19-K562s. P values determined by two-tailed ratio paired T test, represented as fold change relative to control. (f) Cytokine secretion of control, CARD11-PIK3R3, CD19-BBz-CAR and CD19-BBz-CAR + CARD11-PIK3R3 CD8 + T cells 48 h post 1:1 co-culture with CD19-K562s. (g) Bar graph summarizing CD19-K562 population percentages after 14-day co-culture of CD19-CD28z-CAR T cells with and without CARD11-PIK3R3, and supplemental IL-2. P values determined by multiple paired T test followed by Bonferroni correction. (h-i) Cell counts of CD19-A549 mKate2+ targets co-cultured with CD8+ (h) CD19-BBz-CAR T cells or (i) CD19-CD28z-CAR T cells over 108 h period. Bar graph indicates target cell counts at hour 108, standardized to control. P values calculated by one-way ANOVA followed by Tukey’s multiple comparison test, performed on cell count at 108 h. (j) Cell counts of CD8 + CD19-BBz-CAR T cells or CD19-CD28z-CAR T cells on Day 13 after two stimulations with CD19-K562 targets (n = 2 or 3). P values determined by two-tailed unpaired T test. (a,c-j) Each data point indicates an independent donor (n = 3), with the exception of j (n = 2 or 3). ns indicates not significant, * indicates P value < 0.05, ** indicates P value < 0.01.
Extended Data Fig. 6 |
Extended Data Fig. 6 |. Weight loss of CD19-BBz-CAR + CARD11-PIK3R3 treated animals ameliorated with TCR Knockout.
(a) Flow cytometry plots indicating CD3 expression of TCR replete or TCR knockout groups after electroporation with TRAC targeted RNPs. (b) Flow cytometry plots indicating CAR (FLAG) and CARD11-PIK3R3 or control blank construct (mCherry) expression in human CD3 + T cells. (c) Radiance of Nalm6-Luc-GFP tumor bearing animals treated with control (n = 5), CD19-BBz-CAR (n = 5), CD19-BBz-CAR + CARD11-PIK3R3 (n = 5) TCR replete T cells dosed at 1e6 CAR + T cells, control cells dosed equivalent to highest total T cell dose in other treatment groups. Dotted lines indicate individual mice, bold line indicates median. Arrow indicates date T cells were injected. (d) Percent weight change from baseline of TCR Knockout or TCR replete CD19-BBz-CAR + CARD11-PIK3R3 treated Nalm6 bearing animals.
Extended Data Fig. 7 |
Extended Data Fig. 7 |. CD19-BBz-CAR + CARD11-PIK3R3 is well tolerated and effective at high doses.
(a) Flow cytometry plots indicating CAR (FLAG) and CARD11-PIK3R3 (mCherry) expression in human CD3 + T cells. (b-c) Percent weight change from baseline of (b) tumor bearing or (c) non-tumor bearing animals treated with control, CD19-BBz-CAR, CD19-BBz-CAR + CARD11-PIK3R3 or CARD11-PIK3R3 (d) Survival analysis of Fig. 4b surviving CD19-BBz-CAR (n = 3), CD19-BBz-CAR + CARD11-PIK3R3 (n = 4) animals or naïve mice (n = 4) rechallenged with 5e5 Nalm6-Luc-GFP tumors. P values determined by Log-rank Mantel-Cox followed by Bonferroni correction. ** indicates P value < 0.01.
Extended Data Fig. 8 |
Extended Data Fig. 8 |. In vivo analysis of CARD11-PIK3R3 expressing CAR T cells.
(a,c) Flow cytometry plots indicating FLAG (CAR) and mCherry (CARD11-PIK3R3) expression in human CD3 + T cells. (b) Percent weight change from baseline of control, CD19-CD28z-CAR or BBz-CAR + CARD11-PIK3R3 treated Nalm6 tumor bearing animals. (d) Percent weight change from baseline of control, MCAM-CD28z-CAR or MCAM-CD28z-CAR + CARD11-PIK3R3 treated M28 tumor bearing animals. (e) Flow cytometry plots indicating GFP (CAR) and CARD11-PIK3R3 (mCherry) expression in mouse OT-I T cells. (f) Percent weight change from baseline of control, CD19-BBz-CAR or CD19-BBz-CAR + CARD11-PIK3R3 treated hCD19-B16 tumor bearing animals. (g) Accumulation of CD19-BBz-CAR T cells in spleen of hCD19-B16 tumor bearing animals 5 days post adoptive cell transfer. Each data point indicates one mouse (n = 5), mean + s.e.m. depicted. P values determined using two-tailed unpaired t test. (h) Histograms indicating human CD19 ligand expression on hCD19-B16 tumors, CD19-BBz-CAR or CD19-BBz-CAR + CARD11-PIK3R3 treated that had reached euthanasia endpoint, compared to known CD19 positive B16 tumor sample. * indicates P value < 0.05.
Extended Data Fig. 9 |
Extended Data Fig. 9 |. In vivo analysis of CARD11-PIK3R3 expressing OT-I T cells.
(a) Cell percentage in total CD8 + T cells of control or CARD11-PIK3R3 OT-I T cells in dual transfer experiment (n = 5). P values determined by two-tailed unpaired T test. The images of the mouse and the cells were created with BioRender.com and adapted as required. (b) Tumor growth curve for mice bearing B16-OVA tumors treated with 1 × 10⁶ OT-I T cells (10% CARD11-PIK3R3 positive). (c) Schematic of competition experiments with pmel-1 CD8 T cells. (d) Tumor growth curves of mice described in (c) (n = 5). (e) Fold-enrichment in the tumor of wild-type CARD11-PIK3R3 or CARD11-PIK3R3 (p.R28A) expressing pmel-1 CD8 T cells compared to vector control 7 days after adoptive transfer (n = 5). Mean + s.e.m. depicted. All P values determined by two-tailed ratio paired T test. (f) Percent change in tumor volume and proportion of transferred cells in control OT-I (n = 8) and CARD11-PIK3R3 OT-I (n = 9) mice bearing B16-OVA subcutaneous tumors. Each data point indicates one mouse, mean + s.e.m. depicted. (g) Frequency of TCF-1 + OT-I cells in spleen (control OT-1 n = 5, CARD11-PIK3R3 OT-1 n = 7) and tumor draining lymph node (LN) (control OT-1 n = 3, CARD11-PIK3R3 OT-1 n = 5) of mice bearing B16-OVA subcutaneous tumors. P values determined by two-tailed unpaired T test. (h) Ex vivo cytokine production with PMA/Ionomycin stimulation of control OT-I (n = 7) or CARD11-PIK3R3 OT-I (n = 7) TILs 7 days post T cell transfer. P values determined by two-tailed unpaired T test. (i) Tumor volume and survival analysis in B16-OVA melanoma bearing mice treated with PBS (n = 5), control OT-I cells (2 × 10⁶) (n = 5), or CARD11-PIK3R3 OT-I cells (2 × 10⁶) (n = 5) day 12 after tumor inoculation. Complete response was defined as an absence of a detectable tumor. P values determined by one-way ANOVA followed by Tukey’s multiple comparisons test (tumor volume) or Log-rank Mantel-Cox (survival). (j) Percent change in body weight in PBS, control OT-I, or CARD11-PIK3R3 OT-I treated, B16-OVA tumor bearing mice. Each data point indicates one mouse, mean + s.e.m. depicted. ns indicates not significant, *** indicates P values < 0.001, **** indicates P value < 0.0001.
Extended Data Fig. 10 |
Extended Data Fig. 10 |. Long-term evaluation of B6 mice treated with CARD11-PIK3R3 expressing OT-I T cells.
(a) Mice that cleared B16-F10-OVA from Fig. 5e were monitored for up to 240 days after adoptive T cell transfer. Necropsies were performed in as outlined in this schematic. (b) Body weights of all CARD11-PIK3R3 infused mice from Fig. 5e and Extended Data Fig. 9i were measured weekly and compared to expected weight curves published by The Jackson Laboratory Research Institute. P value determined by two-way ANOVA. (c) Spleen weight for three animals that underwent necropsy on day 240 post adoptive transfer. This was calculated as percent of body weight and compared to expected spleen weight published by The Jackson Laboratory Research Institute. P value determined by two-tailed unpaired T test. (d) Necropsy of one representative animal. None of the three animals had gross pathology. (e) Percentage of CD8 T cells in spleen and blood that express CARD11-PIK3R3 240 days post adoptive transfer. (f) Representative hematoxylin and eosinstained tissue sections from select organs where nodal or extranodal lymphomas can occur. Animals were subject to full-body necropsies (n = 3). Tissues did not show evidence of nuclear atypia, changes in cellular architecture, or presence of neoplastic disease. Representative images at low (left) and high (right) -power magnification are shown with size bars. White box reflects the site of high-magnification image. (g,i) Schematic of blood sampling of mice presented in Fig. 5e 330 days after adoptive transfer (g) or of 2e6 OT-I CARD11-PIK3R3 treated mice presented in Extended Data Fig. 9i 418 days after adoptive transfer (i). (h,j) Percentage of CD8 T cells in blood that express CARD11-PIK3R3 in the two cohorts described in Fig. 5e or Extended Data Fig. 9i. Each data point indicates one mouse, mean + s.e.m. depicted.
Fig. 1 |
Fig. 1 |. In vitro and in vivo screening identifies T cell mutations that reprogram CAR signalling and functional outputs.
a, A schematic of T cell mutation screening. BC, bar-code. The images of the cells were created with BioRender.com and adapted as required. b, A heat map of the reporter activity (z score) for the indicated T cell mutation constructs in the BBz-CAR CD19-K562 screen. Clustering was determined using k-means. The z score indicates the mean z score, normalized to mCherry-only controls, of two independent experimental replicates. Select clusters with pronounced effects are highlighted. c, An upset plot demonstrating unique signalling outputs of mutations in the BBz-CAR CD19-K562 screen. d, A bar graph indicating the percentage of AP-1 positivity in BBz-CAR cells following CD19-K562 stimulation of select mutations. Each point represents an experimental replicate (n = 2); mean ± s.e.m. is depicted. e, IL-2 and PD1 fold change in the BBz-CAR CD19-K562 screen. The fold change represents the mean of two independent experimental replicates as compared to mCherry controls. f, A volcano plot indicating enrichment or depletion in vivo for each construct as determined by MAGeCK. A positive log2[fold change] indicates an increased persistence in tumours compared to input.
Fig. 2 |
Fig. 2 |. CARD11–PIK3R3 enhances CBM complex signalling.
a, A schematic of CBM signalling in T cells. b, Diagrams of CARD11, PIK3R3 and CARD11–PIK3R3. c, NF-κB reporter activity of BBz-CAR CARD11–PIK3R3 Jurkat cells co-cultured with CD19-K562 cells. Numbers indicate percent of cells positive. The data are representative of two independent experiments. d, MALT1 substrate expression in control or CARD11–PIK3R3-expressing BBz-CAR Jurkat cells. The data are representative of two independent experiments. PMA, phorbol myristate acetate; Iono, ionomycin; Ct, C-terminal cleavage product. e, NF-κB reporter activity of control, CARD11-knockout or BCL10-knockout BBz-CAR Jurkat cells. Each point represents an experimental replicate (n = 2); mean ± s.e.m. is depicted. f,g, Reporter activity of BCL10-binding-deficient (n = 3) (f) and phospho-tyrosine-binding-deficient (n = 2) (g) CARD11–PIK3R3. Each data point indicates an experimental replicate; mean ± s.e.m. is depicted. ****P < 0.0001, two-way analysis of variance (ANOVA) followed by Dunnett’s multiple comparison test.
Fig. 3 |
Fig. 3 |. CARD11–PIK3R3 expression leads to signalling, transcriptional and functional enhancements in primary human CD8+ T cells.
a, A heat map of significantly upregulated genes in CARD11–PIK3R3 compared to control BBz-CAR T cells after stimulation with CD19 antigen shared among both CD4+ and CD8+ T cells; each column represents an independent donor. b, The top five Reactome pathways enriched in CD4+ and CD8+ T cells (top) and NF-κB, AP-1 and MALT1 gene signature enrichment in CARD11–PIK3R3-expressing CD8+ BBz-CAR T cells after stimulation (bottom) through gene set enrichment analysis. c, Activation markers expressed following CD19-K562 stimulation. The P values were determined by a two-tailed unpaired t-test. MFI, mean fluorescence intensity. d, Cytokine secretion following CD19-K562 cell stimulation. The P values were determined by a two-tailed ratio paired t-test. e, Left: flow cytometry plots depicting CD8+ T cell and CD19-K562 populations after 14-day co-culture. Right: a bar graph summarizing population percentages from three independent donors; mean ± s.e.m. is depicted. The P values were determined by a multiple paired t-test followed by Bonferroni correction. In ce, each data point indicates an independent donor (n = 3). NS, not significant; *P < 0.05, **P < 0.01, ***P < 0.001.
Fig. 4 |
Fig. 4 |. CARD11–PIK3R3 improves the therapeutic efficacy of human and mouse CAR T cells in vivo.
ac, Radiance (left) and survival (right) analysis of Nalm6-Luc-GFP tumour-bearing animals. Radiance was measured using in vivo imaging and used as a proxy for tumour burden. Animals were treated with T cells 5 days post Nalm6 tumour engraftment. In b, the treatment of CARD11–PIK3R3 T cells alone was dose adjusted to match the highest CARD11–PIK3R3 dose in other groups. d, Survival analysis of surviving CAR + CARD11–PIK3R3 animals or naive mice from c rechallenged with Nalm6-Luc-GFP tumours on day 77 post initial tumour injection. e, Tumour volumes of M28 tumour-bearing animals treated with T cells 7 days post tumour engraftment. Mean ± s.e.m. is depicted. f, Accumulation of CD19-BBz-CAR T cells in hCD19-B16 tumour 5 days post adoptive cell transfer. Each data point indicates an individual mouse (n = 5); mean ± s.e.m. is depicted. The P values were determined using two-tailed unpaired t-test. g, Tumour volume (left) and survival (right) analysis of hCD19-B16 tumour-bearing animals treated with T cells 9 days post tumour engraftment. The arrows indicate the date of T cell injection. The dashed lines indicate individual mice; the bold lines indicate the median. P values were determined by one-way ANOVA followed by Tukey’s multiple comparisons test (tumour volume) or log-rank Mantel–Cox (survival) followed by Bonferroni correction. **P < 0.01, ***P < 0.001.
Fig. 5 |
Fig. 5 |. CARD11–PIK3R3 enhances the therapeutic efficacy of mouse and human TCR-transgenic T cells in vivo.
a, Schematic of the syngeneic melanoma model. The images of the cells were created with BioRender.com and adapted as required. b, Accumulation of TILs in the competition assay 7 days post T cell transfer (n = 5); mean ± s.e.m. is depicted. The P value was determined by two-tailed ratio paired t-test. c, Accumulation of TILs in control OT-I-treated (n = 3–8) and CARD11–PIK3R3 OT-I-treated (n = 5–7) mice (left), and TCF1 expression in tumour-infiltrating OT-I cells (n = 7 per group; right); mean ± s.e.m. is depicted. P values were determined by two-tailed unpaired t-test. tdLN, tumour-draining lymph node. d, Cytokine production of ex vivo-stimulated OT-I TILs 7 days post T cell transfer (n = 7); mean ± s.e.m. of IL-2, TNF and IFNγ triple-positive cells is depicted. P values were determined by two-tailed unpaired t-test. e, B16-OVA melanoma tumour volumes in CARD11–PIK3R3 OT-I cells at 100,000 (n = 4) or 20,000 (n = 5) dose as compared to 2 × 10⁶ OT-I cells (n = 5) (left) and rechallenge with B16-OVA melanoma tumours subcutaneously on the contralateral flank (right); mean ± s.e.m. is depicted. P values were determined by one-way ANOVA followed by Tukey’s multiple comparisons test. f, SNU-1 HLA-C*08:02 gastric cancer xenograft tumour volumes in mice treated with control (n = 5), or KRAS(p.G12D)-specific TCR T cells without (n = 5) or with (n = 6) CARD11–PIK3R3; mean ± s.e.m. is depicted. Complete response (CR) indicates absence of a detectable tumour. P values were determined by one-way ANOVA followed by Tukey’s multiple comparisons test. In bd, each data point indicates an individual mouse. *P < 0.05, ***P < 0.001, ****P < 0.0001.

Comment in

References

    1. Hou AJ, Chen LC & Chen YY Navigating CAR-T cells through the solid-tumour microenvironment. Nat. Rev. Drug Discov 20, 531–550 (2021). - PubMed
    1. Wang L et al. Genomic profiling of Sézary syndrome identifies alterations of key T cell signaling and differentiation genes. Nat. Genet 47, 1426–1434 (2015). - PMC - PubMed
    1. Rafiq S, Hackett CS & Brentjens RJ Engineering strategies to overcome the current roadblocks in CAR T cell therapy. Nat. Rev. Clin. Oncol 17, 147–167 (2020). - PMC - PubMed
    1. Larson RC & Maus MV Recent advances and discoveries in the mechanisms and functions of CAR T cells. Nat. Rev. Cancer 21, 145–161 (2021). - PMC - PubMed
    1. Mustjoki S & Young NS Somatic mutations in “benign” disease. N. Engl. J. Med 384, 2039–2052 (2021). - PubMed

MeSH terms