. 2024 Mar;627(8003):374-381.
doi: 10.1038/s41586-023-07011-6. Epub 2024 Feb 7.

Spatial transcriptomics reveal neuron-astrocyte synergy in long-term memory

Affiliations

Spatial transcriptomics reveal neuron-astrocyte synergy in long-term memory

Wenfei Sun et al. Nature. 2024 Mar.

Abstract

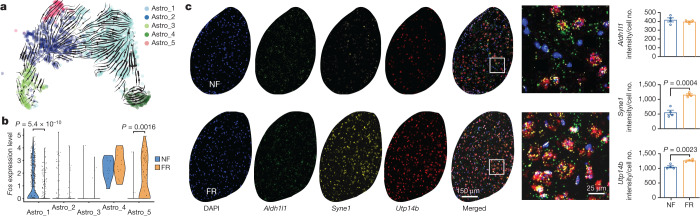
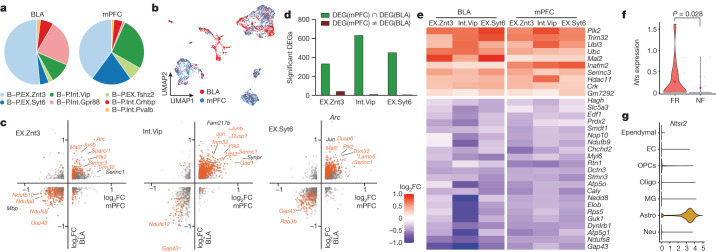
Memory encodes past experiences, thereby enabling future plans. The basolateral amygdala is a centre of salience networks that underlie emotional experiences and thus has a key role in long-term fear memory formation1. Here we used spatial and single-cell transcriptomics to illuminate the cellular and molecular architecture of the role of the basolateral amygdala in long-term memory. We identified transcriptional signatures in subpopulations of neurons and astrocytes that were memory-specific and persisted for weeks. These transcriptional signatures implicate neuropeptide and BDNF signalling, MAPK and CREB activation, ubiquitination pathways, and synaptic connectivity as key components of long-term memory. Notably, upon long-term memory formation, a neuronal subpopulation defined by increased Penk and decreased Tac expression constituted the most prominent component of the memory engram of the basolateral amygdala. These transcriptional changes were observed both with single-cell RNA sequencing and with single-molecule spatial transcriptomics in intact slices, thereby providing a rich spatial map of a memory engram. The spatial data enabled us to determine that this neuronal subpopulation interacts with adjacent astrocytes, and functional experiments show that neurons require interactions with astrocytes to encode long-term memory.


Conflict of interest statement

The authors declare no competing interests.

Figures

Fig. 1
Fig. 1. Spatial transcriptomics resolves the engram assembly and memory-associated genes.
a, Experimental scheme for tracing engram cells in a fear conditioning model. Active cells during the return phase were permanently tagged with tdTomato and used for differential analyses of engram cells. 4-OHT, 4-hydroxytamoxifen. b, Freezing rate during the recall phase. n = 5 mice; data are mean ± s.e.m.; unpaired two-tailed Student’s t-test, P = 2.4 × 10−6. cj, Multiplexed error-robust fluorescence in situ hybridization (MERFISH) data. c, Engram cells (tdTomato+) in BLA revealed by MERFISH. FR: n = 8 sections, NF: n = 7 sections; data are mean ± s.e.m.; unpaired two-tailed Student’s t-test. d, Unbiased clustering of all neurons. e, Neuronal markers and cell-type annotations resolved in space. f, Unbiased clustering of neurons within BLA. g, Marker genes of BLA neuronal subtypes. Avg., average; exp., expression. h, Neuronal markers and cell-type annotations of BLA. i, Fear memory-induced gene expression in excitatory engram neurons of BLA. P < 0.05, unadjusted P value by Mann–Whitney–Wilcoxon test. FC, fold change; NS, not significant. j, Fear memory-induced gene expression in inhibitory engram neurons of BLA. P < 0.05, unadjusted P value by Mann–Whitney–Wilcoxon test. Source Data
Fig. 2
Fig. 2. Memory consolidation evokes cell-type-specific transcriptional programmes.
a–e, scRNA-seq data. a, Clustering of all cells in BLA using Smartseq3 sequencing. b, Distinct markers for each cluster of neurons. c, DEGs of TRAPed neurons over non-TRAPed neurons in the FR (x axis) and NF (y axis) condition, red denotes significant DEGs (P < 0.05 in both conditions (axes), two-sided Mann–Whitney–Wilcoxon test). d, Quantification of genes enriched in TRAPed neurons. Gene expression is mostly conserved between FR and NF, whereas genes expressed in FR and NR are mostly distinct. e, Volcano plot showing DEGs in FR versus NF of TRAPed BLA.Int.Gpr88 neurons, a type of P+T neuron. P < 0.05, unadjusted P value by Mann–Whitney–Wilcoxon test. f, DEGs in FR versus NF of TRAPed BlaIn.Gpr88 neurons, a type of P+T neuron. Each column represents one cell. EC, endothelial; MG, microglia; oligo, oligodendrocyte. Source Data
Fig. 3
Fig. 3. Remote memory consolidation activates astrocytes.
a, Cellular trajectory estimation for BLA astrocytes, based on RNA maturation from scRNA-seq data. b, Fos expression of FR and NF astrocytes from scRNA-seq data. Unpaired two-tailed Student’s t-test. c, RNAscope in situ staining of Aldh1l1, Syne1 and Utp14b transcripts in BLA of NF and FR astrocytes. n = 4 mice; data are mean ± s.e.m.; unpaired two-tailed Student’s t-test. Source Data
Fig. 4
Fig. 4. Astrocytic activation modulates long term memory consolidation.
a, Experimental scheme. AAV expression constructs GfaABC1D-mCherry-CalEx (or GfaABC1D-tdTomato) were injected bilaterally into BLA C57B/6 mice 12 h after fear conditioning training. Mice were subjected to the context test, altered context tone test and open field test at the indicated times. b, Mice expressing CalEx exhibited reduced freezing compared with the tdT control group in the context test (tdTomato: n = 10 mice, CalEx: n = 9 mice), both groups exhibited comparable freezing in altered context but CalEx showed reduced freezing in the tone test than tdT control group (n = 10 mice). Data are mean ± s.e.m.; two-tailed Student’s t-test. c, MERFISH analysis shows spatially resolved peri-engram cells surrounding tdT+ neurons. d, Igfbp2 expression is enriched in astrocytes surrounding tdT+ neurons. MERFISH data; two-sided Mann–Whitney–Wilcoxon test. e, Analysis of MERFISH data shows that Fos expression is induced in peri-engram astrocytes in the FR condition relative to the NF condition. Two-sided Mann–Whitney–Wilcoxon test. f, Experimental scheme. AAV constructs for expression of U6-Igfbp2 guide RNA (gRNA) (or U6-negative control (NC) gRNA) were bilaterally injected to CAG-Cas9 mice, seven days before fear conditioning training. Mice were subjected to the context test, altered context tone test and open field test at the indicated times. g, Mice expressing Igfbp2 gRNA showed reduced freezing compared with the control group in the context test, altered context test and reduced freezing in the tone test. NC gRNA: n = 8 mice, Igfbp2 gRNA: n = 10 mice; data are mean ± s.e.m.; unpaired two-tailed Student’s t-test. Source Data
Fig. 5
Fig. 5. Engram neurons in mPFC and BLA share transcriptional machinery in consolidating remote memory.
ag, Analysis of scRNA-seq data. a, Cellular composition of BLA and mPFC. b, Integrated clustering of BLA and mPFC neurons, coloured by region. c, DEGs of TRAPed cells of EX.Znt3 (left), Int.Vip (middle) and EXT.Syt6 (right). The x axis shows fold change of FR over NF in BLA and the y axis shows the fold change of mPFC. Significant DEGs are shown in orange. P < 0.05 for both conditions (axes); two-sided Mann–Whitney–Wilcoxon test. d, Quantification of significant DEGs in neuron clusters 1–3. e, DEGs (FR over NF, TRAPed cells) from BLA and mPFC among B-P.EX.Znt3, B-P.Int.Vip, and B-P.EX.Syt6 neurons. f, Nts expression in tdT+ B-P.EX.Syt6 neurons from BLA. Two-sided Mann–Whitney–Wilcoxon test. g, Ntsr2 expression in all cells from BLA, Ntsr2 expression is highly enriched in astrocytes. Source Data
Extended Data Fig. 1
Extended Data Fig. 1. Spatial transcriptomics resolves the engram assembly in different neuronal cell types.
a) Engram cells (tdTomato +) revealed by MERFISH. b-i) Quantification of tdTomato+ neurons in all regions (b, n [FR] = 5 mice, n [NF] = 4 mice), retrosplenial area (RSP, c, n [FR] = 7 sections, n [NF] = 7 sections), paraventricular nucleus of the thalamus (PVT, d, n [FR] = 7 sections, n [NF] = 6 sections), ventral posterior complex of thalamus (VP, e, n [FR] = 10 sections, n [NF] = 11 sections), hippocampus (HIP, f, n [FR] = 8 sections, n [NF] = 9 sections), basolateral amygdala (BLA, g, n [FR] = 8 sections, n [NF] = 7 sections), central amygdala (CeA, h, n [FR] = 9 sections, n [NF] = 10 sections), and zona incerta (ZI, i, n [FR] = 10 sections, n [NF] = 10 sections), mean +/- S.E.M, unpaired two-tailed student t-test. j) Unbiased clustering of all cells resolved in situ. k) Marker genes expression of major cell types. l) Major cell types with annotations resolved a UMAP. m) All cells grouped by HC, FR, and NF conditions. All MERFISH data. Source Data
Extended Data Fig. 2
Extended Data Fig. 2. Spatial transcriptomics resolves memory associated genes.
a) Marker genes expression of neuronal cell types. Neurons grouped by HC, FR, and NF conditions. b) Differentially gene expression analysis of peri-engram neurons (neurons within a radius of 30 um to engram neurons) other neurons. c) Genes enriched in peri-engram neurons over other neurons, unadjusted P value by Mann Whitney Wilcoxon test. d) Engram neurons and peri-engram neurons resolved in situ. e) Unbiased clustering of all cells from BLA. f) Marker genes expression of major cell types in the BLA. g) Fear memory induced gene expression in excitatory engram neurons of BLA, FR vs. HC. h) Fear memory induced gene expression in inhibitory engram neurons of BLA, FR vs. HC. i) BLA neurons grouped by FR and NF conditions. j) Penk to Tac2 ratio of all neurons in BLA. k) Penk to Tac2 ratio of TRAPed neurons in BLA, one-way ANOVA and two-sided Mann Whitney Wilcoxon test. l) Penk to Tac2 ratio of TRAPed inhibitory neurons in BLA, one-way ANOVA and two-sided Mann Whitney Wilcoxon test. All MERFISH data.
Extended Data Fig. 3
Extended Data Fig. 3. Single-cell transcriptomics resolves the engram associated genes.
a) Distinct markers for each cluster of BLA cells. b) BLA cell clustering colored by training conditions. c) Rbfox3 expression in BLA cells. d) Clustering of BLA neurons, detecting 9144 genes/cell in median. e) BLA neurons clustering colored by training conditions. f) Distinct markers for each cluster of BLA neurons. g) Heatmap of top marker genes of neuronal clusters h) tdTomato expression in each neuron cluster. i-l) DEGs of TRAPed neurons over non TRAPed neurons, red denotes significant DEGs in both conditions/axes. All scRNAseq data.
Extended Data Fig. 4
Extended Data Fig. 4. Single-cell transcriptomics resolves the memory associated genes.
a) Excitatory score of BLA neurons, calculated by Scl17a7 – Gad1. b) tdTomato expression in each neuron cluster, splited by training conditions, two-tailed student T-test. c-g) DEGs of FR over NF of TRAPed BLA.Int.Crhbp (c), BLA.Int.Vip (d), BLA.EX. Dkkl1 (e), BLA.EX.Syt6 (f), and BLA.EX.Lpl (g) neurons, unadjusted P value by Mann Whitney Wilcoxon test. i) Penk to Tac1 ratio of all neurons in BLA. j) Penk to Tac1 ratio of TRAPed neurons in BLA. All scRNAseq data, P value calculated with Mann Whitney Wilcoxon test.
Extended Data Fig. 5
Extended Data Fig. 5. Single-cell transcriptomics resolves the memory associated genes in inhibitory neurons.
a) Excitatory score of BLA neurons, calculated by Slc17a7 – Gad1. b) BLA inhibitory neuron clustering. c) tdTomato expression in each inhibitory neuron cluster. d) BLA inhibitory neuron clustering colored by training conditions. e) Heatmap of top marker genes of inhibitory neuronal clusters f-h) DEGs (FR over NF, TRAPed) of BlaIn.Sst (f), BlaIn.Vip (g), and BlaIn.Calm1 (h), each column is a cell. i,j) Transcription factor enrichment analysis of NF induced genes (i) or FR induced genes (j), unadjusted P value. All scRNAseq data.
Extended Data Fig. 6
Extended Data Fig. 6. Single-cell transcriptomics resolves the memory associated genes in astrocytes.
a) Ntsr2 expression is enriched in astrocytes among all cells in BLA. b) Cluster of astrocytes from BLA. c) Expression level of astrocyte pan markers (Slc1a2, Aldoc, and Slc1a3). d) Heatmap of top marker genes of BLA astrocyte clusters. e) Cellular trajectory estimation of BLA astrocytes, based on gene expression. f) Fos expression of BLA astrocytes. g) Fos expression of astrocyte clusters h) Astrocyte composition separated by training conditions. i) Distinct markers for each astrocyte cluster from BLA. j) Syne1 expression data, retrieved from Allen Atlas. k) RNAscope in situ stanning of Syne1 and tdTomato in BLA of NF and FR conditions. l-p) DEGs of FR vs. NF in Astro_1 – 5, unadjusted P value by Mann Whitney Wilcoxon test. All scRNAseq data, except i and j.
Extended Data Fig. 7
Extended Data Fig. 7. Spatial transcriptomics resolves the memory associated genes in astrocytes.
a) Spatial embedding of all BLA cell types from MERFISH data. b) Clustering of astrocytes in BLA from MERFISH data. c) Clustering of astrocytes in BLA from MERFISH data, separated by training conditions. d) Fos expression in BLA astrocyte subtypes separated by conditions. e) Flt1 expression in BLA astrocyte subtypes from MERFISH data. f) Syne1, Utp14b, Fos, tdTomato level in A4 astrocytes from BLA in FR, MERFISH data. g) Slc1a3, Aldh1l1, and Flt1 in situ data from MERFISH. h) Scheme, adeno-associated virus conveying GfaABC1D-mCherry-CalEx were unilaterally injected to BLA C57B/6 mice. Mice were subjected to fear conditioning training at time indicated in the scheme. i) Immunostaining of Fos and mCherry in animals injected with GfaABC1D-mCherry-CalEx, n[d3] = 4 mice, n[d6] = 3 mice, n[d9] = 4 mice. j) Freezing time in training, n = 8 mice, average +/- SEM. k) Representative tracks in open field test. l-n) Total distance (l), center visits (m), and center duration (n) in open field test, n = 8 mice, average +/- SEM, two-tailed student T-test. o) Scheme, adeno-associated virus conveying GfaABC1D-mCherry-CalEx (or GfaABC1D-mCherry) were bilaterally injected to BLA C57B/6 mice, 24 h after fear conditioning training. Mice were subjected to context test, altered context tone test, and open field test at time indicated in the scheme. p) Freezing time in training, n [tdTomato] = 7 mice, n [CalEX 24h] = 8 mice, average +/- SEM. q) Mice with CalEx showed reduced freezing than tdTomato control group in context test and altered context but reduced freezing in tone test, n [tdTomato] = 7 mice, n [CalEX 24h] = 8 mice, mean +/- S.E.M, two tailed student T-test. a-g are MERFISH data. Source Data
Extended Data Fig. 8
Extended Data Fig. 8. Spatial transcriptomics resolves the memory associated genes in periengram astrocytes.
a) Spatial distribution of astrocytes in BLA. b) Genes differentially expressed in peri-engram astrocytes in BLA in a Volcano plot, unadjusted P value by Mann Whitney Wilcoxon test. c) Genes differentially expressed in peri-engram neurons in BLA in a Volcano plot, unadjusted P value by Mann Whitney Wilcoxon test. d) Peri-engram astrocytes percentage in each astrocyte population, n = 7 sections, on-way ANOVA test, F (4, 30) = 3.296. e) Igfbp2 expression in each astrocyte population in BLA, MERFISH. f) Spatial distribution of astrocytes and engram neurons in BLA. g) Igfbp2 expression in each astrocyte population, scRNAseq data. h) Immunostaining of mCherry in animals injected with AAV convey Igfbp2 guide RNA or negative control guide RNA, n = 4 mice. i) Relative level of Igfbp2 RNA in BLA of animals with guide RNA injection, n [NC guide] = 8 mice, n [Igfbp2 guide] = 7 mice, mean +/- S.E.M, unpaired two-tailed student t-test. j) Freezing time in training, n [NC guide] = 8 mice, n [Igfbp2 guide] = 10 mice, mean +/- SEM. k) Representative tracks in open field test. l-n) Total distance (l), center visits (m), and center duration (n) in open field test, n [NC guide] = 8 mice, n [Igfbp2 guide] = 10 mice, average +/- SEM, two-tailed student T-test. a-f are MERFISH data. Source Data
Extended Data Fig. 9
Extended Data Fig. 9. Spatial transcriptomics resolves the memory associated genes in astrocytes of mPFC.
a) Spatial embedding of all mPFC cell types from MERFISH data. b) Clustering of astrocytes in mPFC from MERFISH data. c) Fos expression in mPFC astrocyte subtypes separated by conditions, two-sided Mann Whitney Wilcoxon test. d) Flt1 expression in mPFC astrocyte subtypes from MERFISH data. e) Spatial resolved peri-engram cells surrounding tdT+ neurons in mPFC, MERFISH data. f) Peri-engram astrocytes percentage in each astrocyte population, one-way ANOVA F (2, 33) = 5.598, n = 12 mice. g) Igfbp2 expression in each astrocyte population in mPFC, MERFISH h) Igfbp2 expression is enriched in peri-engram astrocytes in mPFC (Mann Whitney Wilcoxon test, MERFISH data). i) Fos expression is enriched in FR condition than NF condition among peri-engram astrocytes in mPFC (Mann Whitney Wilcoxon test, MERFISH data). j) Genes differentially expressed in peri-engram neurons in mPFC in a Volcano plot, unadjusted P value by Mann Whitney Wilcoxon test. k) Genes differentially expressed in peri-engram astrocytes in mPFC in a Volcano plot, unadjusted P value by Mann Whitney Wilcoxon test. l) Genes differentially expressed in peri-engram astrocytes in mPFC and BLA, unadjusted P value by Mann Whitney Wilcoxon test. All MERFISH data. Source Data
Extended Data Fig. 10
Extended Data Fig. 10. (reanalysis of scRNAseq data of mPFC neurons, Chen et al., 2020) Single-cell transcriptomics resolves the memory associated genes in mPFC.
a) Cluster of mPFC neurons b) Distinct markers for each cluster of mPFC neurons. c) Slc17a7 and Gad1 expression of mPFC neurons. d) Heatmap of top marker genes of mPFC neurons. e) tdTomato expression of mPFC neurons. f) DEGs of TRAPed cells from PFC.1, unadjusted P value by Mann Whitney Wilcoxon test. g) DEGs of TRAPed cells from PFC.2, unadjusted P value by Mann Whitney Wilcoxon test. All scRNAseq data.
Extended Data Fig. 11
Extended Data Fig. 11. Spatial transcriptomics resolves the memory associated genes in neurons of mPFC.
a) Clustering of neurons in mPFC from MERFISH data. b) Spatial embedding of mPFC neurons. c) mPFC neurons grouped by training conditions. d) Marker genes of mPFC neurons. e) Quantification of tdTomato+ neurons in mPFC, n = 4 mice, mean +/- S.E.M, unpaired two-tailed student t-test. f-m) DEGs of FR vs NF in TRAPed Rprm neurons (f), Dkkl1 neurons (g), Crym neurons (h), Otof neurons (i), Sst neurons (j), Pvalb neurons (k), Vip neurons (l), and Tshz2 neurons (m), unadjusted P value by Mann Whitney Wilcoxon test. All MERFISH data. Source Data
Extended Data Fig. 12
Extended Data Fig. 12. Single- cell transcriptomics resolves the memory associated genes in mPFC and BLA neurons.
a) Integrated clustering of BLA and mPFC neurons. b) Integrated clustering of BLA and mPFC neurons separated by regions. c) Distinct markers and Slc17a7 and Gad1 expression for each cluster of integrated BLA and mPFC clusters. d) Heatmap of top marker genes of integrated BLA and mPFC clusters. e) tdTomato expression of integrated BLA and mPFC clusters. f) DEGs (FR over NF, TRAPed cells) from BLA and mPFC among B-P.Int.Crhbp and B-P.EX.Tshz2 neurons. g) Quantification of DEG numbers in each neuron clusters. h) Nts expression in each neuron clusters in BLA and mPFC i) Nts expression in tdT+ B-P.EX.Syt6 neurons from mPFC. j) Expression of all three known neurotensin receptors in different cell types of BLA. All scRNAseq data.
Extended Data Fig. 13
Extended Data Fig. 13. Single-cell transcriptomics resolves the memory associated genes in mPFC and BLA astrocytes and microglia cells.
a) Integrated clustering of astrocytes from BLA and mPFC, single-cell RNAseq data. Pie graphs in BLA show the ratio of BLA astrocyte cluster (Astro_1 – 5, Extended Data Fig. 6b). b) Fos expression separated by astrocyte clusters and condition from BLA and mPFC. c) Expression level of astrocyte markers (Slc1a2, Aldoc, and Slc1a3) from BLA and mPFC. d) Heatmap of top marker genes of integrated astrocytes cell types from BLA and mPFC. e) Slc1a3, Aldh1l1, Gfap and Aldoc in situ data from MERFISH. f) Distinct markers expression for each cluster of integrated BLA and mPFC astrocyte clusters. g) Astrocytes compositions in integrated analysis of mPFC and BLA, separated by conditions. h) Integrated clustering of microglia from BLA and mPFC, separated by regions. i) Cx3cr1, P2ry12, Selplg and Tmem119 in situ data from MERFISH. j) Expression level of pan microglia markers Tmem119, Aif1, Itgam, and Tyrobp from integrated BLA and mPFC. All scRNAseq data, except e and j.

Comment in

References

    1. McGaugh, J. L. Memory–a century of consolidation. Science287, 248–251 (2000). - PubMed
    1. Alberini, C. M. & Kandel, E. R. The regulation of transcription in memory consolidation. Cold Spring Harb. Perspect. Biol.7, a021741 (2015). - PMC - PubMed
    1. Ryan, T. J. & Frankland, P. W. Forgetting as a form of adaptive engram cell plasticity. Nat. Rev. Neurosci.23, 173–186 (2022). - PubMed
    1. Josselyn, S. A. et al. Long-term memory is facilitated by cAMP response element-binding protein overexpression in the amygdala. J. Neurosci.21, 2404–2412 (2001). - PMC - PubMed
    1. Poulos, A. M. et al. Persistence of fear memory across time requires the basolateral amygdala complex. Proc. Natl Acad. Sci. USA106, 11737–11741 (2009). - PMC - PubMed

MeSH terms

Substances