. 2024 Feb;626(8000):752-758.
doi: 10.1038/s41586-024-07033-8. Epub 2024 Feb 7.

Signatures of a surface spin-orbital chiral metal

Affiliations

Signatures of a surface spin-orbital chiral metal

Federico Mazzola et al. Nature. 2024 Feb.

Abstract

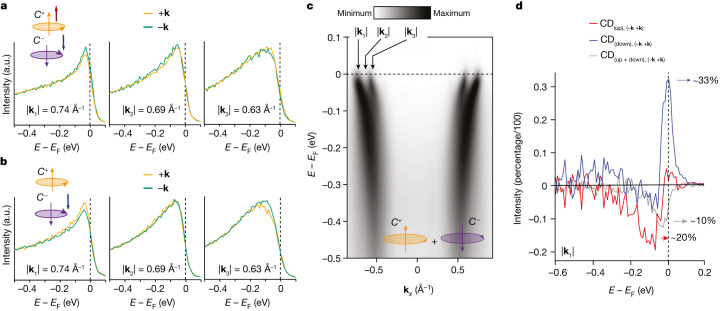
The relation between crystal symmetries, electron correlations and electronic structure steers the formation of a large array of unconventional phases of matter, including magneto-electric loop currents and chiral magnetism1-6. The detection of such hidden orders is an important goal in condensed-matter physics. However, until now, non-standard forms of magnetism with chiral electronic ordering have been difficult to detect experimentally7. Here we develop a theory for symmetry-broken chiral ground states and propose a methodology based on circularly polarized, spin-selective, angular-resolved photoelectron spectroscopy to study them. We use the archetypal quantum material Sr2RuO4 and reveal spectroscopic signatures that, despite being subtle, can be reconciled with the formation of spin-orbital chiral currents at the surface of the material8-10. As we shed light on these chiral regimes, our findings pave the way for a deeper understanding of ordering phenomena and unconventional magnetism.


Conflict of interest statement

The authors declare no competing interests.

Figures

Fig. 1
Fig. 1. Currents and symmetries in an electronic system.
a, The possible charge, spin and orbital currents that can be created in a material. The charge can give rise through its motion to a conventional current (the charge current), but spin and orbital dipoles or quadrupoles can also generate more-complex types of current. Indeed, the spin (S) and orbital (L) angular momentum are pseudovectors that change sign where there is time-reversal symmetry, and then the spin and orbital currents carrying spin or orbital dipoles are time-reversal conserving. Instead, the currents carrying orbital or spin–orbital quadrupoles break time-reversal symmetry and yield non-vanishing amplitudes for the dipole and quadrupole observables at a given momentum. b, Examples of mirror-preserving (top) and mirror-broken (bottom) configurations. In a system that preserves time reversal, a charge with its spin at a certain positive momentum, under the action of such symmetries, goes into a charge with opposite spin (directed in the same direction but opposite in sign) at negative (symmetry related) momentum. For mirror-symmetric configurations, the sign change occurs when the spin lies in the mirror plane, as shown here. Instead, with currents included, strong asymmetry in their product LS occurs. c, This experimental configuration with circularly polarized light (C+,−) was used to measure the asymmetry of LS caused by the chiral current-driven breaking of mirror symmetry. The Fermi surface of Sr2RuO4 is used here as a test bed for our theory. d, The binding energy (E − EF) of the electrons is shown as a function of momentum (k) for Sr2RuO4.
Fig. 2
Fig. 2. CP-spin-integrated ARPES.
a, Left: unpolarized ARPES spectrum from Sr2RuO4 along the direction orthogonal to the crystal mirror plane, corresponding to the dashed line in Fig. 1c. Middle and right: the spectrum has been obtained by summing both contributions from right- (middle) and left-circularly (right) polarized light. Here we refer to this as C+,−k, ↑, ↓) to indicate signals from right- or left-circularly polarized light, collected at momentum ±k, and with a spin-up or spin-down channels, respectively. b, Circular dichroism of ARPES spectrum obtained by subtracting the contributions from right- and left-circularly polarized light. Remarkably, the signal changes sign from +k to −k, with incoming light within the mirror plane. The asymmetry seen is discussed in both the main text and Methods. c, Energy-dependent circular dichroism collected with spin-detector (VLEED) at the k-points indicated in b.
Fig. 3
Fig. 3. CP-spin-resolved ARPES.
a, EDCs taken at six selected momenta (±ki, where i = 1, 2 or 3) with fixed spins and circular polarizations. In particular, the orange curves are obtained by measuring the EDCs at positive k values, right-circularly polarized light and spin-up channel (C+(k, ↑)), whereas the green curves are obtained with negative k values, left-circularly polarized light and spin-down channel (C+(−k, ↓)). b, ARPES spectra with reversed spin and circularly polarized light configurations. The orange curves refer to C+(−k, ↑), whereas the green curves are obtained for C(k, ↓). c, ARPES image indicating the k values at which the EDCs have been taken. It is noted that the configurations in a and b show a difference that is larger than the experimental uncertainty. d, The amplitudes of the circular dichroism (at k summed up to see the actual residual) are reported for both spin-integrated and spin-resolved measurements. The data show that the spin-integrated signal (grey curve) shows a finite value as large as 10% (which is also similar to the experimental uncertainty of 8%, as shown in ref. ), but the spin-resolved channels show a notably larger amplitude, by a factor of 2 and 3 for up and down channels, respectively. The amplitude values have been extracted from the data shown in a and b and in Extended Data Fig. 3, after including the Sherman function and calculating the true spin polarization, as described in Methods. The other indicated k points, as well as the dichroic amplitude in terms of the momentum distribution curve, are shown in Extended Data Figs. 4 and 5, and corroborate the validity of our result.
Fig. 4
Fig. 4. Orbital and spin–orbital textures in the presence of chiral currents.
a, The computed Fermi surface of Sr2RuO4. b, A broken-symmetry state with an electronic pattern marked by either orbital-quadrupole (top) or spin–orbital quadrupole (bottom) currents. The sketch indicates a current in real space connecting the ruthenium sites along the [110] direction. c, Electronic phase with chiral orbital-quadrupole currents: amplitude of the orbital angular momentum Lz(n, k) of the bands described by the eigenfunctions of the Hamiltonian ψn,k with n = 1, 2 evaluated along the Γ–X direction (Lz(n,k)=ψn,kL^zψn,k). For clarity, we plot both Lz(n, k) (blue) and −Lz(n, − k) (orange) for any given momentum k to directly compare the amplitudes at opposite momenta. d, Electronic phase with chiral orbital-quadrupole currents: amplitude of the spin-projected orbital angular momentum related to the out-of-plane spin-up (+) and spin-down (−) components, as selected by the projector (1±s^z). The amplitude is given by Lz±(n,k)=ψn,k(1±s^z)L^zψn,k. The amplitudes of Lz(n, k) and Lz±(n,k), shown in c and d, do not show any symmetry and do not match at k and −k. e, Electronic phase with chiral spin–orbital quadrupole currents with antisymmetric L and S content with respect to the current flow direction k, that is, k(L^×s^); for this configuration, Lz(n, k) and Lz(n, −k) coincide. f, Electronic phase with chiral spin–orbital quadrupole currents with antisymmetric L and S combination: spin-projected orbital moment Lz±(n,k) at opposite momenta are unequal in amplitude. Similar trends occur for the other bands (Supplementary Information).
Extended Data Fig. 1
Extended Data Fig. 1. Photoemission experimental geometry.
The sample, represented by the purple box, is such that the incoming synchrotron radiation (red wavy arrow) impinges with an angle of 45° with respect to its surface. In this configuration, with linear polarizations, we would have linear vertical (LV, green double-headed arrow) lying completely on the sample surface. Instead, linear horizontal (LH, blue double-headed arrow) would have both in- and out-of-plane components, projected along the y- and z-axis, respectively. The slit of the analyser is along the scattering plane (vertical slit).
Extended Data Fig. 2
Extended Data Fig. 2. ARPES identification of the surface states and sample alignment.
a Fermi surface collected at 40 eV (sum of the two circularly polarized lights) showing both bulk bands and surface states. The latter are weaker than the bulk in intensity but still visible. To better appreciate the precise sample alignment we fitted the data and extracted the k positions, reported in the image as red markers. The mirror plane deviates from the (b) ideal condition by 0.9°. c) Energy versus momentum dispersion collected in the same experimental conditions of (Extended Data Fig. 1a) showing a very symmetric character. To better appreciate this, we extracted MDCs and plotted them in panel d along with their extracted k values.
Extended Data Fig. 3
Extended Data Fig. 3. Spin-resolved data with unpolarised light.
Energy distribution curves collected at momenta a-d ky = 0.75 Å−1, ky = 0.70 Å−1, ky = 0.65 Å−1, ky = 0.60 Å−1. The data are with sum of circular right and left light and spin-up and spin-down channels have been shown in red and blue, respectively.
Extended Data Fig. 4
Extended Data Fig. 4. Spin-integrated and spin-resolved dichroism.
Spin integrated circular dichroism collected at a ky = ± 0.73Å−1 (k1), b ky = ± 0.68Å−1 (k2), and c ky = ± 0.72Å−1 (k3), as indicated in the main text Fig. 3c. Green curves indicate negative k, and orange curve positive k. d-e-f Spin-resolved circular dichroism collected at negative k for the three momenta indicated. g-i Same but collected at positive momenta.
Extended Data Fig. 5
Extended Data Fig. 5. Amplitude of the dichroism, EDC and MDC.
a-b-c The amplitudes of the dichroism (at k-summed up to see the actual residual) are reported for k1,2,3. These show that, while d the spin-integrated signal (grey curve) shows a finite value, as large as 10% (which is also very similar to the experimental uncertainty as reported in - purple stripe), the spin-resolved channels indicate a significantly larger amplitude, of a factor larger than × 2 and × 3 for up and down channels, respectively. e The amplitude of the dichroism have been also collected by using MDC at two binding energies, i.e., at the Fermi level and at 150 meV below it. As one can see, the grey line, which is the spin-integrated dichroism is nearly flat (in average is 7% - obtained by summing up all the points), while the spin-up and spin-down channels are varying and well-different. The fact that these are also varying is quite remarkable and indicates that our signal is intrinsic in nature.
Extended Data Fig. 6
Extended Data Fig. 6. Temperature dependence data.
a-c The upper line (blue curves) shows the difference between C+(+ k, ) and C(k, ) - normalized by their sum - at three values of k and at low temperature (LT), while the lower line is the same for the data collected at 70 K (high temperature, HT), above the magnetic transition. When at LT we do observe a varying finite signal, it starts from negative and it switches sign into positive as a function of k, at HT we did not see such a variation. d and e show the Fermi surface maps and energy versus momentum dispersion for both LT and HT data. The surface states are visible in both cases.
Extended Data Fig. 7
Extended Data Fig. 7. Example of some ARPES from the spin-detector.
a Energy dispersions as a function of negative k-values obtained by using the spin-detector only in a course alignment scan. b Same as a but interpolated for a thicker angular grid to see the bands better. c Energy dispersions as a function of positive k-values obtained by using the spin-detector only in a course alignment scan. d Same as c but interpolated for a thicker angular grid to see the bands better.

References

    1. Xu Y, et al. Three-state nematicity and magneto-optical Kerr effect in the charge density waves in kagome superconductors. Nat. Phys. 2022;18:1470–1475. doi: 10.1038/s41567-022-01805-7. - DOI
    1. Grytsiuk S, et al. Topological–chiral magnetic interactions driven by emergent orbital magnetism. Nat. Commun. 2020;11:511. doi: 10.1038/s41467-019-14030-3. - DOI - PMC - PubMed
    1. Zhang Y, et al. Control of chiral orbital currents in a colossal magnetoresistance material. Nature. 2022;611:467–472. doi: 10.1038/s41586-022-05262-3. - DOI - PubMed
    1. Barron LD. Chirality, magnetism and light. Nature. 2000;405:895–896. doi: 10.1038/35016183. - DOI - PubMed
    1. Bode M, et al. Chiral magnetic order at surfaces driven by inversion asymmetry. Nature. 2007;447:190–193. doi: 10.1038/nature05802. - DOI - PubMed