. 2024 Feb;626(8001):1108-1115.
doi: 10.1038/s41586-023-07015-2. Epub 2024 Feb 7.

Circulating myeloid-derived MMP8 in stress susceptibility and depression

Affiliations

Circulating myeloid-derived MMP8 in stress susceptibility and depression

Flurin Cathomas et al. Nature. 2024 Feb.

Abstract

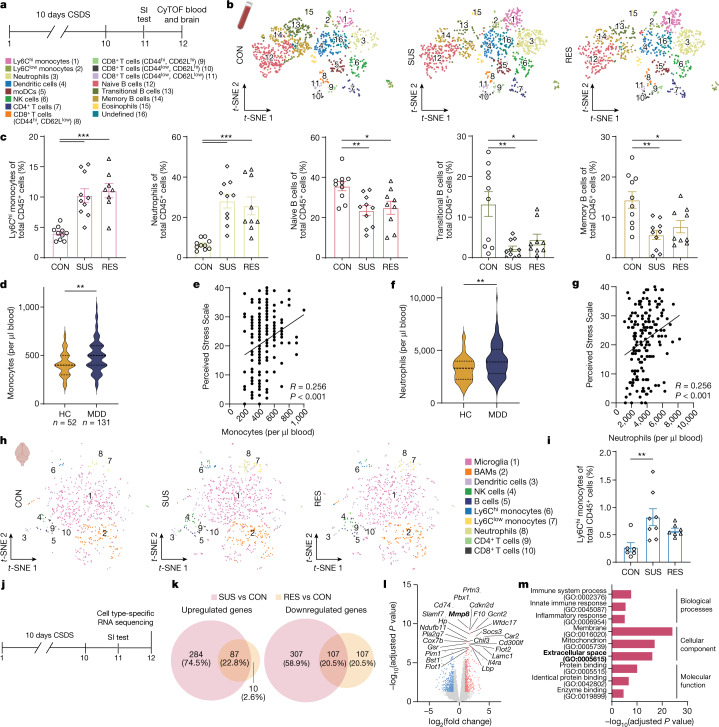
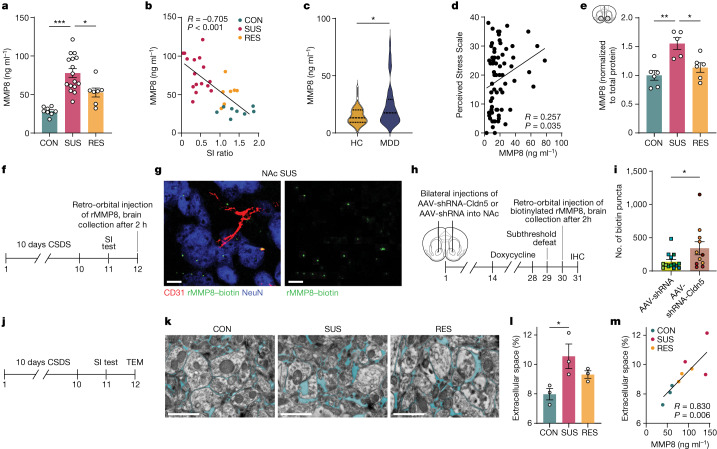
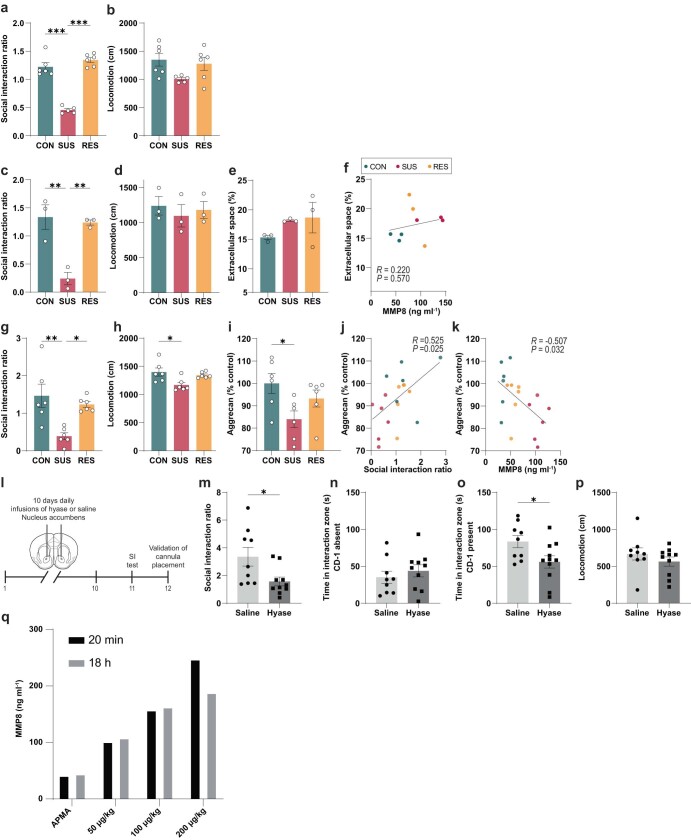
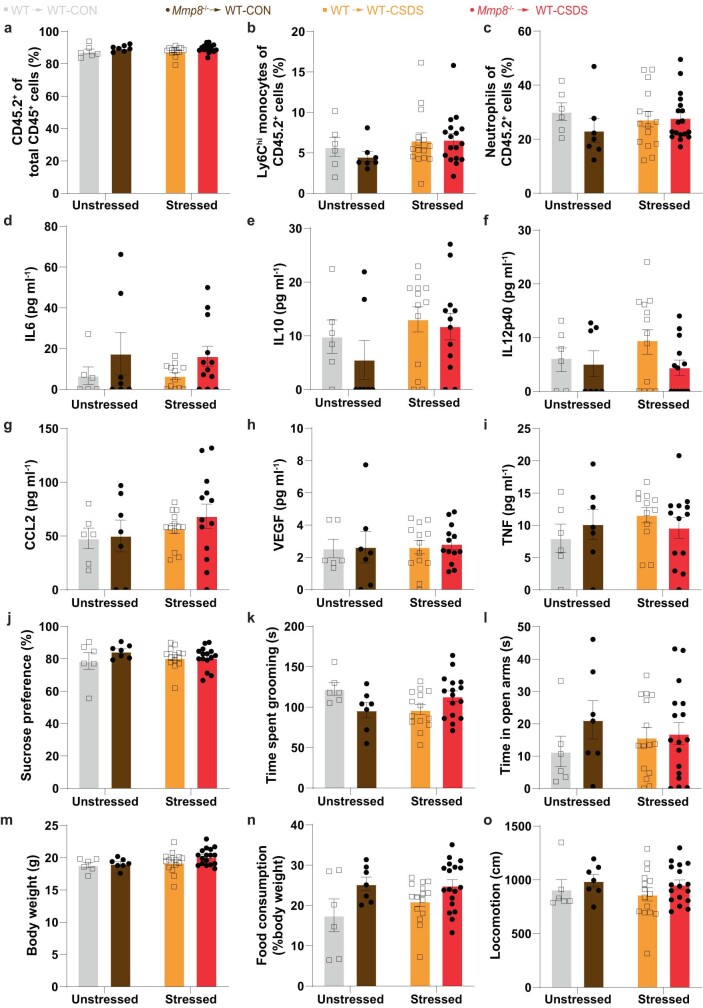
Psychosocial stress has profound effects on the body, including the immune system and the brain1,2. Although a large number of pre-clinical and clinical studies have linked peripheral immune system alterations to stress-related disorders such as major depressive disorder (MDD)3, the underlying mechanisms are not well understood. Here we show that expression of a circulating myeloid cell-specific proteinase, matrix metalloproteinase 8 (MMP8), is increased in the serum of humans with MDD as well as in stress-susceptible mice following chronic social defeat stress (CSDS). In mice, we show that this increase leads to alterations in extracellular space and neurophysiological changes in the nucleus accumbens (NAc), as well as altered social behaviour. Using a combination of mass cytometry and single-cell RNA sequencing, we performed high-dimensional phenotyping of immune cells in circulation and in the brain and demonstrate that peripheral monocytes are strongly affected by stress. In stress-susceptible mice, both circulating monocytes and monocytes that traffic to the brain showed increased Mmp8 expression following chronic social defeat stress. We further demonstrate that circulating MMP8 directly infiltrates the NAc parenchyma and controls the ultrastructure of the extracellular space. Depleting MMP8 prevented stress-induced social avoidance behaviour and alterations in NAc neurophysiology and extracellular space. Collectively, these data establish a mechanism by which peripheral immune factors can affect central nervous system function and behaviour in the context of stress. Targeting specific peripheral immune cell-derived matrix metalloproteinases could constitute novel therapeutic targets for stress-related neuropsychiatric disorders.


Conflict of interest statement

The authors declare no competing interests.

Figures

Fig. 1
Fig. 1. Stress increases monocyte numbers in the circulation and in the brain, and induces a pro-inflammatory transcriptional signature in monocytes of SUS mice.
a, Experimental outline of CyTOF experiment. SI, social interaction. b,h, t-Distributed stochastic neighbour embedding (t-SNE) maps of CD45+ cells in blood (b) and brain (h). The colour of each cluster corresponds to the assigned cell type. BAMs, border-associated macrophages; moDCs, monocyte-derived dendritic cells; NK, natural killer. c, Frequencies of Ly6Chi monocytes (n = 10 CON, 12 SUS and 10 RES), neutrophils (n = 10 CON, 10 SUS and 9 RES), naive B cells (n = 10 CON, 10 SUS and 9 RES), transitional B cells and memory B cells (n = 10 CON, 10 SUS and 9 RES) in circulation. One-way ANOVA with Bonferroni post hoc test. Each data point represents one biological sample; data are mean ± s.e.m. d,f, Number of monocytes (d) and neutrophils (f) in the circulation of patients with MDD compared with healthy controls (HC). n = 52 heathy controls and 131 MDD; two-tailed Student’s t-test. e,g, Correlation between perceived stress and monocyte numbers (e; n = 169 (HC and MDD)) and neutrophil numbers (g; n = 169 (HC and MDD)). Two-tailed Pearson correlation coefficient. i, Ly6Chi monocytes in whole brain. n = 6 CON, 8 SUS and 7 RES. One-way ANOVA with Bonferroni post hoc test; each data point represents four pooled brains. Data are mean ± s.e.m. j, Experimental outline of cell type-specific RNA sequencing of Ly6Chi and Ly6Clow monocytes, B cells and T cells from blood. k, Number of differentially expressed genes (adjusted P value < 0.05 and log2 fold change > |1|) in Ly6Chi monocytes. l, The 25 most significantly differently expressed protein-coding genes in Ly6Chi monocytes from SUS versus CON mice. m, Top three gene ontology (GO) terms from significantly upregulated genes in Ly6Chi monocytes of SUS versus CON mice. km, P values adjusted for multiple comparisons. *P < 0.05, **P < 0.01, ***P < 0.001. Detailed statistics are in Supplementary Table 2. Source Data
Fig. 2
Fig. 2. Increased expression of matrix metalloproteinase 8 mRNA (Mmp8) in brain-trafficking Ly6Chi monocytes of SUS mice.
a, Outline of iDISCO+ brain clearing and light-sheet imaging, and single-cell RNA-sequencing experiments. b, Representative images of a mouse brain before (top) and after (bottom) iDISCO+ clearing. c, Number of Ccr2rfp+ monocytes in whole brain of CON, SUS and RES mice (n = 9 CON, 8 SUS and 4 RES mice). One-way ANOVA with Bonferroni post hoc test. Data are mean ± s.e.m. d, Top ten most significant correlations between brain-trafficking monocytes and SI ratio. Lower correlation coefficients (red) indicate that higher numbers of monocytes are associated with greater social avoidance. Two-tailed Pearson correlation coefficient. e, Representative z-stack (3–4 slices per brain in three mice) (left) and corresponding three-dimensional reconstruction (right) of a confocal image of the NAc. Brain slices were stained with antibodies to markers for blood vessels (CD31, red), Ccr2rfp+ monocytes (RFP, green and arrowheads) and astrocytes (AQP4, blue). Scale bars, 10 µm. f, Percentage of Ccr2rfp+ monocytes located in the brain vasculature, the perivascular space and parenchyma. g, Uniform manifold approximation and projection (UMAP) representation of four clusters identified using Seurat clustering. h, Relative abundance (as a percentage) of the number of cells per cluster in CON, SUS and RES mice. i, Heat map of top ten cluster-defining protein-coding genes. j, GO terms of significantly (adjusted P value < 0.05) upregulated genes of cluster 0. k, Expression of genes within the GO terms ‘extracellular space’ and ‘extracellular matrix’ compared between SUS versus CON, RES versus CON and SUS versus RES mice. l,m, Feature plots of normalized gene expression of Mmp8 in Ccr2rfp+ monocytes in the brain (l) and brain-resident immune cells in the NAc (m). **P < 0.01. Detailed statistics are in Supplementary Table 2. Source Data
Fig. 3
Fig. 3. Stress-induced increase in MMP8 is associated with altered ECS in the NAc.
a, Plasma levels of MMP8 after CSDS. One-way ANOVA with Bonferroni post hoc test (n = 8 CON, 16 SUS and 7 RES mice). b, Correlation of MMP8 in circulation with SI ratio (n = 31 CON, SUS and RES mice; two-tailed Pearson correlation coefficient). c, Serum MMP8 levels in patients with MDD (n = 40) and healthy controls (HC) (n = 29). Two-tailed Student’s t-test. d, Correlation between MMP8 and Perceived Stress Scale (n = 68 HC and MDD; two-tailed Pearson correlation coefficient). e, Normalized MMP8 protein levels in NAc lysates of CON (n = 6), SUS (n = 5) and RES (n = 6) mice. One-way ANOVA with Bonferroni post hoc test; each data point represents three pooled NAcs. f,g, Experimental outline (f) and representative immunofluorescence image of the NAc of SUS mice that were injected retro-orbitally with biotinylated rMMP8 (g). Scale bars, 10 µm. Three to four slices per brain in three mice. h,i, Experimental outline (h) and number of biotin puncta in the NAc in AAV-shRNA versus AAV-shRNA-Cldn5-injected mice (i). Each data point represents one slice; slices from the same mice have the same colour (AAV-shRNA: 5 mice, 14 brain slices; AAV-shRNA-Cldn5: 4 mice, 11 brain slices). Linear mixed model. IHC, immunohistochemistry. j,k, Outline of transmission electron microscopy experiment to assess the ECS in the NAc (j) and representative transmission electron microscopy (TEM) images from CON, SUS and RES mice (k). Scale bars, 1 µm. l, Quantification of the ECS relative to total brain area (n = 3 CON, 3 SUS and 3 RES mice). One-way ANOVA with Bonferroni post hoc test. m, Correlation between plasma MMP8 levels and ECS volume fraction (n = 9 CON, SUS and RES mice). Two-tailed Pearson correlation coefficient. Data are mean ± s.e.m. *P < 0.05, **P < 0.01, ***P < 0.001. Detailed statistics are in Supplementary Table 2. Source Data
Fig. 4
Fig. 4. Circulating MMP8 is causally linked to stress-induced social avoidance behaviour, alterations in brain ECS and neurophysiology.
a, Experimental outline. b, SI ratio of mice injected with rMMP8 followed by a subthreshold defeat. n = 10 unstressed vehicle, 10 unstressed rMMP8, 20 stressed vehicle and 21 stressed rMMP8. c, Experimental outline. d,e, sCPP of vehicle-injected mice (d; n = 18) and rMMP8-injected mice (e; n = 16). f, Experimental outline. EPM, elevated plus maze test; JI, juvenile interaction; WT, wild type. g, Plasma levels of MMP8 (n = 6 WT → WT-CON, 7 Mmp8−/− → WT-CON, 15 WT → WT-CSDS and 17 Mmp8−/− → WT-CSDS). h,i, SI ratio (h; n = 6 WT → WT-CON, 7 Mmp8−/− → WT-CON, 14 WT → WT-CSDS and 17 Mmp8−/− → WT-CSDS) and time spent in the corner (i; n = 6 WT → WT-CON, 7 Mmp8−/− → WT-CON, 15 WT → WT-CSDS and 15 Mmp8−/− → WT-CSDS). j, Representative heat maps of behaviour during SI test. k, Time spent in the interaction zone when the novel juvenile mouse was present (n = 6 WT → WT-CON, 7 Mmp8−/− → WT-CON, 14 WT → WT-CSDS and 16 Mmp8−/− → WT-CSDS). l, Quantification of the ECS in the NAc relative to total brain area in WT mice compared with Mmp8−/− chimeras (n = 3 per group). m, Experimental outline. n, Action potentials in constitutive Mmp8−/− knockout (cKO) and wild-type mice after 10 days of CSDS (n = 6 CON-WT, 5 CON-cKO, 5 CSDS-WT and 5 CSDS-cKO; 3 slices per mouse). o, Representative traces of action potentials evoked upon a +200 pA step of depolarizing current. p, Frequencies of spontaneous excitatory postsynaptic currents (sEPSCs) in cKO Mmp8−/− and WT mice after 10 days of CSDS (n = 6 CON-WT, 5 CON-cKO, 5 CSDS-WT and 5 CSDS-cKO; 3 slices per mouse). q, Representative traces of sEPSCs. Two-way ANOVAs followed by Tukey’s post hoc test (b,d,gi,k,n,p) or two-sided Student’s t-test (l). Data are mean ± s.e.m. *P < 0.05, **P < 0.01, ***P < 0.001. Detailed statistics are in Supplementary Table 2. Source Data
Extended Data Fig. 1
Extended Data Fig. 1. High-dimensional phenotyping of immune cells in blood, brain parenchyma, leptomeninges, dura and choroid plexus.
a, Gating strategy for live CD45+ cells for the Cytometry by time of flight (CyTOF) experiment (panels a-i). b, Social interaction ratio (n = 10 CON, 10 SUS and 9 RES) and c, locomotion (n = 10 CON, 10 SUS and 9 RES) (behavioural data from blood CyTOF experiment). d, Marker expression and assigned leukocyte subpopulations in blood. e, Frequencies of Ly6Clow monocytes (n = 10 CON] 9 SUS and 8 [RES]), dendritic cells (n = 9 CON, 9 SUS and 9 [RES]), monocyte-derived dendritic cells (n = 9 CON, 10 SUS and 9 RES), natural killer cells (n = 9 CON, 9 SUS and 8 RES), CD4+ T cells (n = 10 CON, 9 SUS and 9 RES), CD8+ T cells (CD44hi, CD62Llow) (n = 10 CON, 10 SUS and 9 RES), CD8+ T cells (CD44hi, CD62Lhi) cells (n = 10 CON, 9 SUS and 9 RES), CD8+ T cells (CD44low, CD62Lhi) (n = 10 CON, 10 SUS and 9 RES), CD8+ T cells (CD44low, CD62Llow(n = 10 CON, 10 SUS and 9 RES), eosinophils (n = 10 CON, 10 SUS and 8 RES) and undefined (n = 9 CON, 10 SUS and 9 RES). f, Social interaction ratio (n = 6 CON, 8 SUS and 7 RES) and g, locomotion (n = 6 CON, 8 SUS and 7 RES) (behavioural data from brain CyTOF experiment). h, Marker expression and assigned leukocyte subpopulations of CD45+ brain leukocytes. i, Frequencies of microglia (n = 6 CON, 8 SUS and 7 RES), border-associated macrophages (n = 6 CON, 8 SUS and 7 RES), dendritic cells (n = 6 CON, 8 SUS and 7 RES), natural killer cells (n = 5 CON, 8 SUS and 7 RES), B cells (n = 6 CON, 8 SUS and 7 RES), Ly6Clow monocytes (n = 6 CON, 8 SUS, & 7 RES), neutrophils (n = 6 CON, 7 SUS, & 7 RES), CD4+ T cells (n = 6 CON, 8 SUS, & 7 RES), CD8+ T cells (n = 6 CON, 8 SUS and 7 RES) in whole brain tissue homogenates. Flow cytometry assessment of j, Ly6Chi monocytes (n = 5 CON, 7 SUS and 5 RES), neutrophils (n = 5 CON, 7 SUS and 5 RES), T cells (n = 5 CON, 7 SUS and 5 RES), B cells (n = 5 CON, 7 SUS and 5 RES) in leptomeninges, k, Ly6Chi monocytes (n = 5 CON, 7 SUS and 5 RES), neutrophils (n = 5 CON, 7 SUS and 5 RES), T cells (n = 5 CON, 7 SUS and 5 RES), B cells in dura (n = 5 CON, 7 SUS and 5 RES), l, Ly6Chi monocytes (n = 5 CON, 7 SUS and 5 RES), neutrophils (n = 5 CON, 6 SUS and 5 RES), T cells (n = 5 CON, 7 SUS and 5 RES), B cells (n = 5 CON, 7 SUS and 5 RES) in choroid plexus. (One-way ANOVA with Bonferroni post hoc test panels b, c, e, f, g, i-l; for blood, each data point represents one biological sample; for brain, each data point represents four pooled brains; for leptomeninges, dura and choroid plexus, each data point represents three pooled samples). *P < 0.05, **P < 0.01, ***P < 0.001. Data are shown as mean ± s.e.m. Abbreviations: moDCs: Monocyte-derived dendritic cells; NK cells: Natural killer cells; BAM: Border-associated macrophages. Detailed statistics are in Supplementary Table 2. Source Data
Extended Data Fig. 2
Extended Data Fig. 2. Leukocyte subpopulation frequencies in patients with major depressive disorder (MDD) compared to healthy controls (HC).
Number of a, total leukocytes (n = 52 HC and 131 MDD), b, eosinophils (n = 52 and HC 131 MDD), c, lymphocytes (n = 52 HC and 131 MDD), d, platelets (n = 52 HC and 131 MDD), and e, red blood cells (n = 52 HC and 131 MDD), in patients with MDD compared to HC. f, Gating strategy of peripheral blood mononuclear cells to assess B cell subpopulations. g, Total B cells (n = 21 HC and 19 MDD), h, naïve B cells (n = 22 HC and 20 MDD), i, transitional B cells (n = 21 HC and 19 MDD) and j, memory B cells in MDD vs. HC (n = 21 HC and 19 MDD) (two-tailed Student’s t-test [panels a-e, g-j]). ***P < 0.001. Detailed statistics are in Supplementary Table 2. Source Data
Extended Data Fig. 3
Extended Data Fig. 3. Cell type-specific RNA sequencing of leukocyte subpopulations in circulation.
a, Social interaction ratio (n = 6 CON, 6 SUS and 6 [RES]) and b, locomotion (n = 6 CON, 6 SUS and 6 RES) (One-way ANOVA with Bonferroni post hoc test). c, Representative flow cytometry plots showing gating strategy for fluorescence-activated cell sorting of Ly6Chi monocytes, Ly6Clow monocytes, B cells and T cells. d, Principal component analysis (PCA) plot performed on the top 2000 most variably expressed genes of sorted cells. e, Volcano plot showing the 25 most significantly differentially expressed protein coding genes in Ly6Chi monocytes of RES vs. CON mice. Venn diagrams displaying number of differentially expressed genes (adjusted p-value < 0.05 and log2 fold change > |1 | ) in f, Ly6Clow monocytes, g, B cells and h, T cells. Volcano plots showing the 25 most significantly differentially expressed protein coding genes (if applicable) in Ly6Clow monocytes [i, SUS vs. CON, j, RES vs. CON], B cells [k, SUS vs. CON, l, RES vs. CON] and T cells [m, SUS vs. CON, n, RES vs. CON]. Top three gene ontology (GO) pathways (if applicable) in Ly6Chi monocytes from o, significantly downregulated genes of SUS vs. CON mice, p, significantly upregulated genes in RES vs. CON and q, significantly downregulated genes in RES vs. CON mice. (all p-values adjusted for multiple comparisons in panels e-q) ***P < 0.001. Data are shown as mean ± s.e.m. Detailed statistics are in Supplementary Table 2. Source Data
Extended Data Fig. 4
Extended Data Fig. 4. Anatomical mapping and transcriptional analyses of brain-trafficking Ccr2rfp+ monocytes.
a, Social interaction ratio (n = 9 CON, 9 SUS and 4 RES) and b, locomotion (n = 9 CON, 9 SUS and 4 RES) (One-way ANOVA with Bonferroni post hoc test). Representative images (from 22 total brains) from light-sheet imaging of c, auto-fluorescent signal (scale bar: 1000 µm) and d, monocyte signal (scale bar: 1000 µm). e, brain-trafficking monocytes (red) in the nucleus accumbens (NAc) showing accurate cell detection (yellow) by the automated software ClearMap (scale bar: 30 µm). Number of brain-trafficking Ccr2rfp+ monocytes in the g, NAc (n = 8 CON, 9 SUS and 4 RES) and i, prefrontal cortex (PFC) (n = 8 CON, 9 SUS and 4 RES) (One-way ANOVA with Bonferroni post hoc test) and correlations with social interaction ratio in f, whole brain (n = 21 CON, SUS and RES), h, NAc (n = 21 CON, SUS and RES) and j, PFC (n = 21 CON, SUS and RES) (Two-tailed Pearson correlation coefficient, two-tailed, panels f-j). I k, Social interaction ratio (n = 3 CON, 3 SUS and 3 RES) and l, locomotion (n = 3 CON, 3 SUS and 3 RES) (One-way ANOVA with Bonferroni post hoc test). m, Gating strategy for fluorescence-activated cell sorting of brain-trafficking monocytes. Feature plots of the n, monocyte-enriched gene Ccr2 and o, the microglia-enriched gene P2ry12. Mmp8 gene expression levels in p, leptomeninges (n = 5 CON, 7 SUS and 5 RES), q, dura (n = 5 CON, 7 SUS and 5 RES) and r, choroid plexus (n = 5 CON, 6 SUS and 4 RES) (One-way ANOVA with Bonferroni post hoc test; for p-r, three samples were pooled). **P < 0.01, ***P < 0.001. Data in panels a, b, g, i, j, k, l and p-r are shown as mean ± s.e.m. Statistics are shown in Supplementary Table 2. Source Data
Extended Data Fig. 5
Extended Data Fig. 5. Single-cell RNA sequencing of brain-resident myeloid cells in the nucleus accumbens (NAc).
a, Experimental outline. b, Social interaction ratio (n = 3 CON, 3 SUS and 3 RES) and c, locomotion (n = 3 CON, 3 SUS and 3 RES) (One-way ANOVA with Bonferroni post hoc test). d, Gating strategy for fluorescence-activated cell sorting of brain-resident myeloid cells. e, Feature plots (Uniform manifold approximation and projection [UMAP]). f, UMAP representation of 6 clusters identified using Seurat clustering. g, Relative (%) abundance of number of cells per cluster in CON, SUS and RES mice. Cluster 5 was specific to SUS mice and cluster 4 was specific to RES mice, however, gene ontology analyses did not reveal any significantly enriched pathways. h, Heat map of top five cluster defining protein coding genes. i, heatmap of homeostatic and inflammatory genes. There were no significant differences (P value adjusted <0.05) in these homeostatic or inflammatory genes. ***P < 0.001. Data are shown as mean ± s.e.m. Detailed statistics are in Supplementary Table 2. Source Data
Extended Data Fig. 6
Extended Data Fig. 6. Stress increases matrix metalloproteinase 8 (MMP8) in both male and female mice.
a, Social interaction ratio (n = 8 CON, 16 SUS and 7 RES) and b, locomotion (n = 8 CON, 16 SUS and 7 RES) (One-way ANOVA with Bonferroni post hoc test). Defeat characteristics of female mice after 10 days of chronic social defeat stress (CSDS): c, social interaction ratio (n = 10 CON, 9 SUS and 6 RES), d, locomotion (n = 10 CON, 9 SUS and 6 RES) (One-way ANOVA with Bonferroni post hoc test). e, Plasma levels of MMP8 in SUS compared to CON female mice after 10 days of CSDS (n = 10 CON, 9 SUS and 6 RES) (One-way ANOVA with Bonferroni post hoc test). f, MMP8 plasma levels of female mice that underwent a 21-day paradigm of chronic variable stress (CVS) compared to non-stressed control mice (n = 16 CON and 23 CVS) (two-tailed Student’s t-test). Plasma levels of g, MMP2 (n = 8 CON, 11 SUS and 7 [RES]), h, MMP3 (n = 8 CON, 11 SUS and 7 RES), i, proMMP9 (n = 8 CON, 11SUS and 6 RES) and j, MMP12 (n = 8 CON, 11 SUS and 7 RES) in CON, SUS and RES male mice after 10 days of CSDS (One-way ANOVA with Bonferroni post hoc test). *P < 0.01, **P < 0.01, ***P < 0.001. Data are shown as mean ± s.e.m. Detailed statistics are in Supplementary Table 2. Source Data
Extended Data Fig. 7
Extended Data Fig. 7. Chronic social defeat stress and brain extracellular space.
a, Social interaction ratio (n = 6 CON, 5 SUS and 6 RES) and b, locomotion (n = 6 CON, 5 SUS and 6 RES) from mice from which levels of MMP8 were analysed in the NAc. c, Social interaction ratio (n = 3 CON, 3 SUS and 3 RES) and d, locomotion (n = 3 CON, 3 SUS and 3 RES) of mice analysed for the transmission electron microscopy experiment. e, Quantification of the extracellular space relative to total brain in prefrontal cortex (PFC) (n = 3 CON, 3 SUS and 3 RES). f, Correlation between plasma MMP8 levels and extracellular space volume fraction in PFC. g, Social interaction ratio (n = 6CON, 6 SUS and 6 RES) and h, locomotion of mice analysed for the aggrecan western blots (n = 6 CON 6 SUS and 6 RES). i, Aggrecan levels in the NAc after chronic social defeat stress (n = 6 CON, 6 SUS and 6 RES), correlations between j, aggrecan levels and social interaction ratio and k, aggrecan levels and circulating MMP8. l, Experimental design of hyaluronidase (hyase) infusion experiment. m, Social interaction ratio (n = 9, Saline and 10 Hyase), n, time spent in the interaction zone when the target mouse is absent (n = 9, Saline and 10 Hyase), o, time spent in the interaction zone when the target mouse is present (n = 9, Saline and 11 Hyase), p, locomotion after 10 days of chronic hyase injection (n = 9, Saline, 10 Hyase). q, Different doses of rMMP8 or vehicle (4-aminophenylmercuric acetate, APMA) were injected i.p. and blood was collected 20 min or 18 h after the injection followed by MMP8 measurement in plasma. (One-way ANOVA with Bonferroni post hoc test [panels a-e, g-i], Two-tailed Pearson correlation coefficient, two-tailed, [panels f, j, k], two-sided Student’s t-test [panels m-p]). *P < 0.05, **P < 0.01, ***P < 0.001. Data are shown as mean ± s.e.m. Detailed statistics are in Supplementary Table 2. Source Data
Extended Data Fig. 8
Extended Data Fig. 8. Bone marrow chimera experiments.
a, Chimerism (CD45.2+ vs. total CD45+ cells) of unstressed and stressed WT and Mmp8−/− transplants (n = 6 WT → WT-CON, 7 Mmp8−/− → WT-CON, 15 WT → WT-CSDS and 17 Mmp8−/− → WT-CSDS). Frequencies of circulating b, Ly6Chi monocytes (n = 6 WT → WT-CON, 7 Mmp8−/− → WT-CON, 15 WT → WT-CSDS and 17 Mmp8−/− → WT-CSDS) and c, neutrophils (n = 6 WT → WT-CON, 7 Mmp8−/− → WT-CON, 15 WT → WT-CSDS and 17 Mmp8−/− → WT-CSDS). Plasma levels of d, Interleukin 6 (IL6) (n = 6 WT → WT-CON, 7 Mmp8−/− → WT-CON, 12 WT → WT-CSDS and 12 Mmp8−/− → WT-CSDS), e, IL10 (n = 6 WT → WT-CON, 7 Mmp8−/− → WT-CON, 13 WT → WT-CSDS and 12 Mmp8−/− → WT-CSDS), f, IL12p40 (n = 6 WT → WT-CON, 7 Mmp8−/− → WT-CON, 13 WT → WT-CSDS and 13 Mmp8−/− → WT-CSDS), g, C-C motif chemokine ligand 2 (CCL2) (n = 6 WT → WT-CON, 7 Mmp8−/− → WT-CON, 13 WT → WT-CSDS and 13 Mmp8−/− → WT-CSDS), h, Vascular endothelial growth factor (VEGF) (n = 6 WT → WT-CON, 7 Mmp8−/− → WT-CON, 13 WT → WT-CSDS and 13 Mmp8−/− → WT-CSDS) and i, Tumor necrosis factor (TNF) (n = 6 WT → WT-CON, 7 Mmp8−/− → WT-CON, 12 WT → WT-CSDS and 13 Mmp8−/− → WT-CSDS). j, Sucrose preference test (n = 6 WT → WT-CON, 7 Mmp8−/− →WT-CON, 14 WT → WT-CSDS and 15 Mmp8−/− → WT-CSDS), k, splash test (n = 6 WT → WT-CON, 7 Mmp8−/− → WT-CON, 14 WT → WT-CSDS and 16 Mmp8−/− → WT-CSDS), and l, elevated plus maze test. Sickness associated behaviours such as m, body weight (n = 6 WT → WT-CON, 7 Mmp8−/− → WT-CON, 15 WT → WT-CSDS and 17 Mmp8−/− → WT-CSDS), n, food consumption (n = 6 WT → WT-CON, 7 Mmp8−/− → WT-CON, 15 WT → WT-CSDS and 18 Mmp8−/− → WT-CSDS) or o, locomotion (n = 6 WT → WT-CON, 7 Mmp8−/− → WT-CON, 15 WT → WT-CSDS and 17 Mmp8−/− → WT-CSDS). (Two-way ANOVA followed by Tukey’s post hoc testing [for all panels]). Data are shown as mean ± s.e.m. Detailed statistics are in Supplementary Table 2. Source Data
Extended Data Fig. 9
Extended Data Fig. 9. Behavior, leukocyte frequencies and electrophysiology in constitutive Mmp8 knockout (cKO) mice.
a, Social interaction ratio (n = 10 WT and 12 cKO) b, locomotion (n = 10 WT and 12 cKO), c, Ly6Chi monocytes (n = 11 WT and 12 cKO), d, Ly6Clow monocytes (n = 11 WT and 12 cKO), e, neutrophils (n = 10 WT and 12 cKO), f, B cells (n = 11 WT and 12 cKO), g, CD4+ T cells (n = 11 WT and 12 cKO), h, CD8+ T cells (n = 11 WT and 12 cKO) in unstressed wildtype (WT) compared to MMP8−/− cKO mice at baseline. i, Social interaction ratio (n = 17 WT and 19 cKO) and j, locomotion (n = 17 WT and 19 cKO) in wildtype (WT) mice compared to MMP8−/− cKO mice after chronic social defeat stress. k, Quantification of the extracellular space in prefrontal cortex relative to total brain area in WT compared to Mmp8−/− chimeras (n = 3 WT- > WT-CSDS, 3 Mmp8−/− → WT-CSDS, & 3 WT → WT-CSDS). l, Resting membrane potential (n = 6 CON-WT, 5 CON-cKO, 5 CSDS-WT and 5 CSDS-cKO; 3 slices per mouse), m, rheobase (n = 6 CON-WT, 5 CON-cKO, 5 CSDS-WT and 5 CSDS-cKO; 3 slices per mouse) and n, amplitude of spontaneous excitatory postsynaptic potentials (sEPSCs) (n = 6 CON-WT, 5 CON-cKO, 5 CSDS-WT and 5 CSDS-cKO; 3 slices per mouse). (two-sided Student’s t-test [for panels a-k]). Two-way ANOVA followed by Tukey’s post hoc testing [for panels l-n]). Data are shown as mean ± s.e.m. Detailed statistics are in Supplementary Table 2. Source Data
Extended Data Fig. 10
Extended Data Fig. 10. Graphical abstract.
Stress-induced increase in peripheral MMP8 leads to social avoidance behaviour associated with alterations in the extracellular space and neurophysiological changes in the nucleus accumbens.

Update of

Comment in

  • Depression: Monocytes on my mind.
    Lazzarino GP, Engblom D. Lazzarino GP, et al. Immunity. 2024 Apr 9;57(4):837-839. doi: 10.1016/j.immuni.2024.03.011. Immunity. 2024. PMID: 38599175

References

    1. Otte C, et al. Major depressive disorder. Nat. Rev. Dis. Primers. 2016;2:16065. doi: 10.1038/nrdp.2016.65. - DOI - PubMed
    1. Cathomas F, et al. Beyond the neuron: role of non-neuronal cells in stress disorders. Neuron. 2022;110:1116–1138. doi: 10.1016/j.neuron.2022.01.033. - DOI - PMC - PubMed
    1. Dowlati Y, et al. A meta-analysis of cytokines in major depression. Biol. Psychiatry. 2010;67:446–457. doi: 10.1016/j.biopsych.2009.09.033. - DOI - PubMed
    1. Rehm J, Shield KD. Global burden of disease and the impact of mental and addictive disorders. Curr. Psychiatry Rep. 2019;21:10. doi: 10.1007/s11920-019-0997-0. - DOI - PubMed
    1. Rush AJ, et al. Acute and longer-term outcomes in depressed outpatients requiring one or several treatment steps: a STAR*D report. Am. J. Psychiatry. 2006;163:1905–1917. doi: 10.1176/ajp.2006.163.11.1905. - DOI - PubMed

MeSH terms