Meta-Analysis
. 2024 Feb 8;25(1):154.
doi: 10.1186/s12864-024-10065-z.

Sex-biased genetic regulation of inflammatory proteins in the Dutch population

Affiliations
Meta-Analysis

Sex-biased genetic regulation of inflammatory proteins in the Dutch population

Collins K Boahen et al. BMC Genomics. .

Abstract

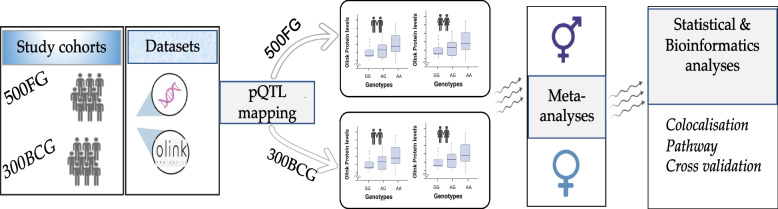
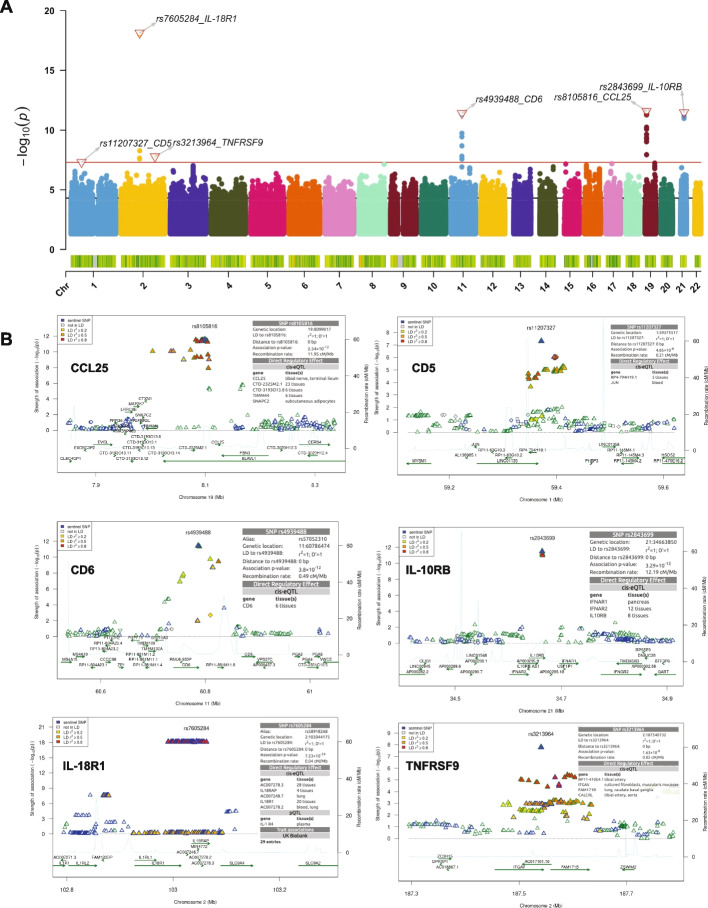
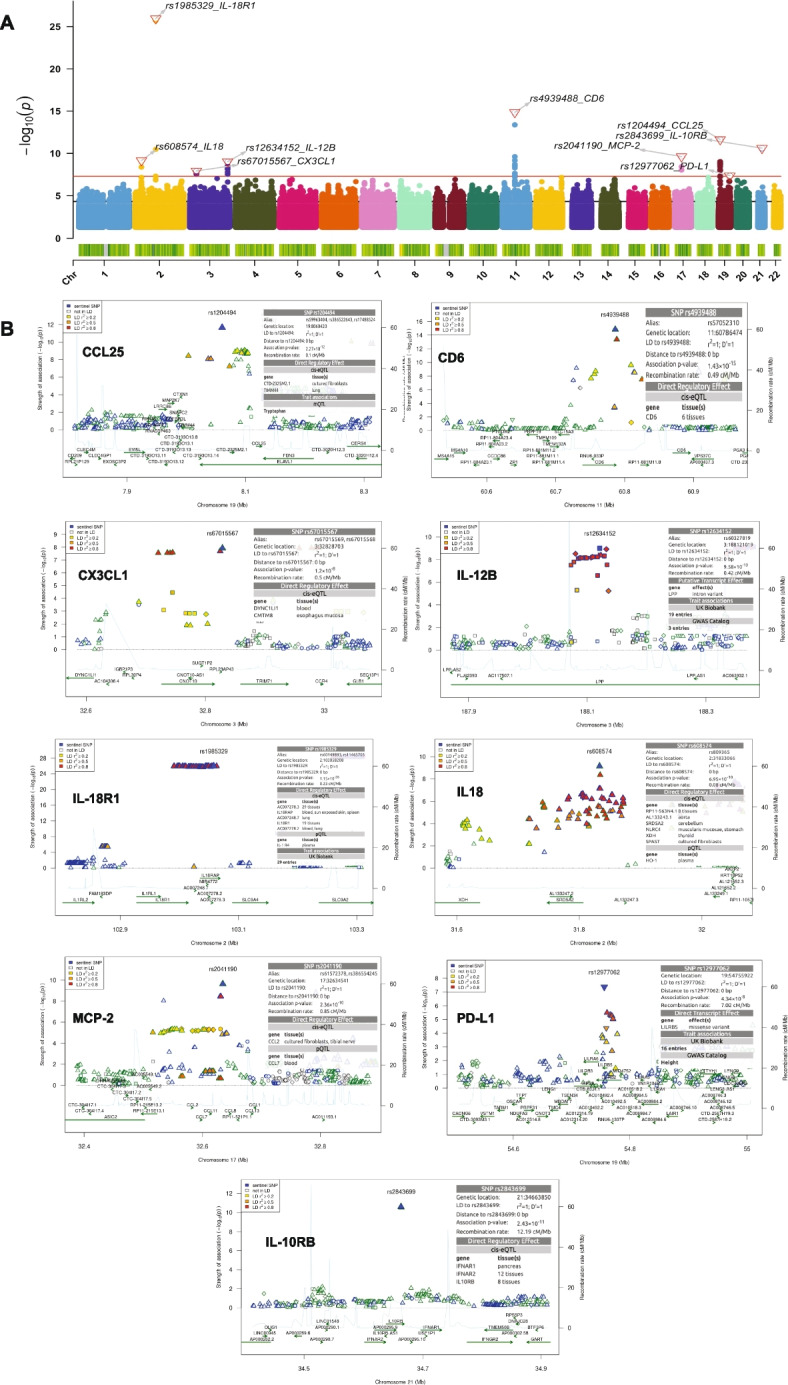
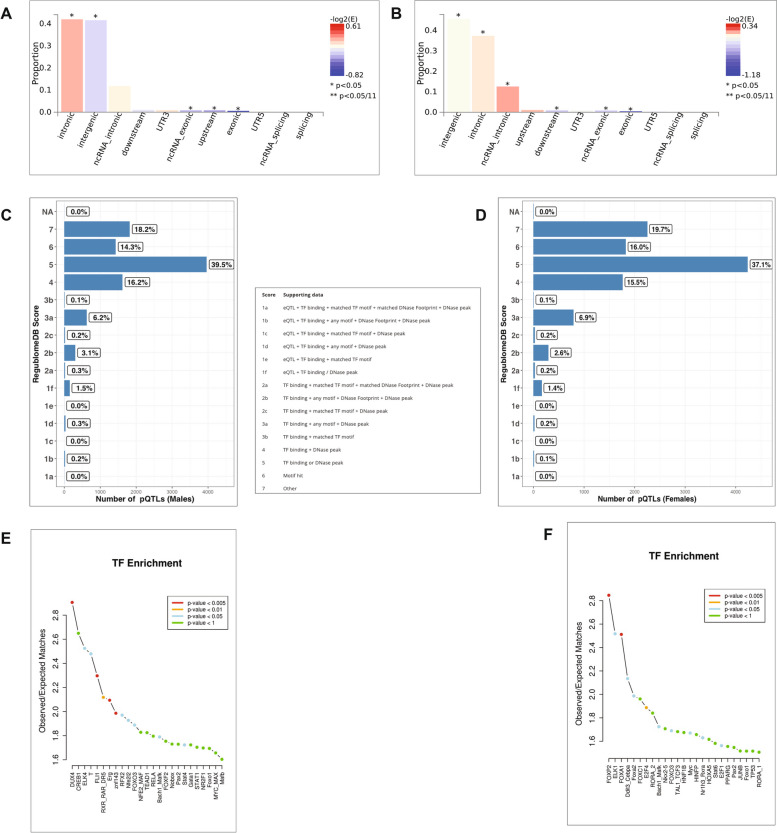
Background: Significant differences in immune responses, prevalence or susceptibility of diseases and treatment responses have been described between males and females. Despite this, sex-differentiation analysis of the genetic architecture of inflammatory proteins is largely unexplored. We performed sex-stratified meta-analysis after protein quantitative trait loci (pQTL) mapping using inflammatory biomarkers profiled using targeted proteomics (Olink inflammatory panel) of two population-based cohorts of Europeans.

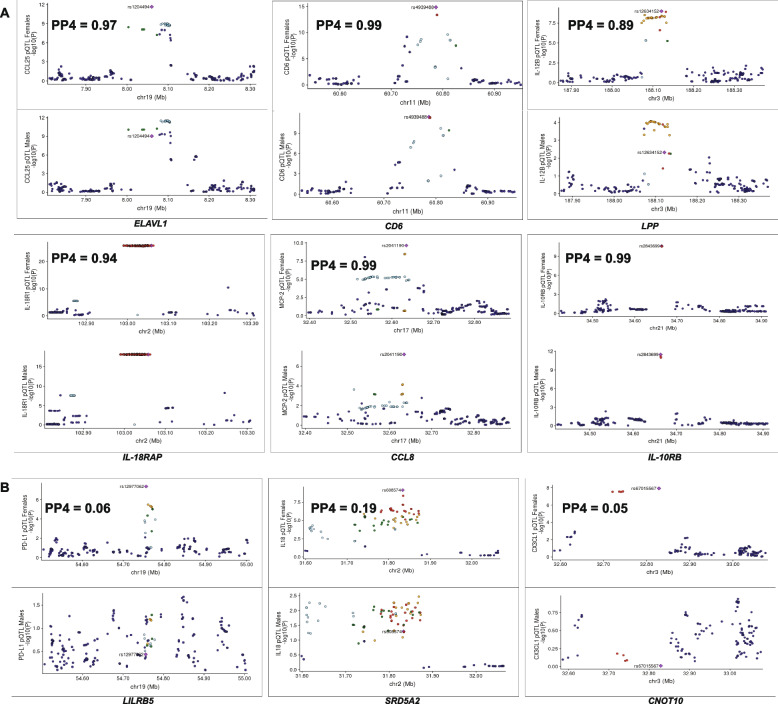
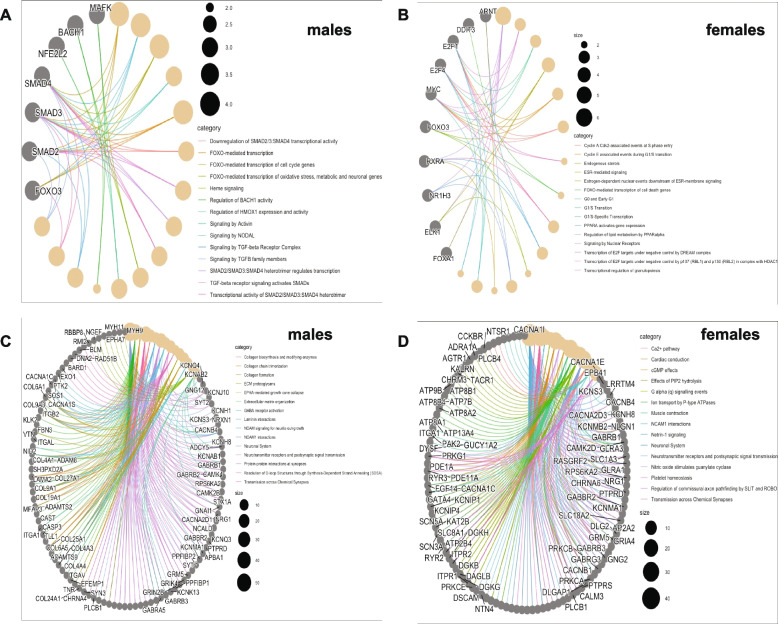
Results: Even though, around 67% of the pQTLs demonstrated shared effect between sexes, colocalization analysis identified two loci in the males (LINC01135 and ITGAV) and three loci (CNOT10, SRD5A2, and LILRB5) in the females with evidence of sex-dependent modulation by pQTL variants. Furthermore, we identified pathways with relevant functions in the sex-biased pQTL variants. We also showed through cross-validation that the sex-specific pQTLs are linked with sex-specific phenotypic traits.

Conclusion: Our study demonstrates the relevance of genetic sex-stratified analysis in the context of genetic dissection of protein abundances among individuals and reveals that, sex-specific pQTLs might mediate sex-linked phenotypes. Identification of sex-specific pQTLs associated with sex-biased diseases can help realize the promise of individualized treatment.

Keywords: Biomarkers; GWAS; Inflammation; Sex-stratified genetic analysis; pQTL.


Conflict of interest statement

The authors declare no competing interests.

Figures

Fig. 1
Fig. 1
Graphical representation of study cohorts, design and analysis conducted. This study utilized two population-based cohorts (500FG & 300 BCG) of individuals of European decent. Imputed genetic data and plasma protein abundances profiled with the Olink inflammatory panel were available for protein quantitative trait (pQTL) mapping in sex-dependent fashion. The resulting summary statistics were integrated using the meta-analytic approach for males and females separately. Colocalization and functional enrichment analysis of the identified meta-analyzed pQTL variants were conducted. Finally, we cross-validated the identified pQTL variants with previously published molecular traits
Fig. 2
Fig. 2
Summary of pQTL meta-analysis results in males. A Manhattan plot depicting the association results of significant genetic variants (P < 0.05). The red bold horizontal line marks the genome-wide significant threshold (p-value < 1 × 10–8) and the black dashed denotes the suggestive threshold (p-value = 5 × 10–5). Top pQTL variants and their correlated proteins are displayed on the plot. B Regional association plots of the genome-wide significant loci (p < 1 × 10–8). The -log10 association p-values are plotted on the y-axis against physical position (NCBI build 36) of each marker on the x-axis. The pQTL variants are color coded according to their correlation coefficient (r2) with the top SNP using the hg19/1000 Genomes European samples
Fig. 3
Fig. 3
Summary of pQTL meta-analysis results in females. A Manhattan plot illustrating the association results of significant genetic variants (P < 0.05). The red bold horizontal line denotes the genome-wide significant threshold (p-value < 1 × 10–8) and the black dashed denotes the suggestive threshold (p-value = 5 × 10–5). Top pQTL variants and their correlated proteins are displayed on the plot. B Regional association plots of the genome-wide significant loci (p < 1 × 10–8). The -log10 association p-values are plotted on the y-axis against physical position (NCBI build 36) of each marker on the x-axis. The pQTL variants are color coded according to their correlation coefficient (r2) with the top SNP using the hg19/1000 Genomes European samples
Fig. 4
Fig. 4
Illustration of colocalization analysis results in males. A Locus comparison plots of shared genomic loci between males and females (B) Locus comparison plots of male-specific genomic loci. The protein names and -log10 association p-values are displayed on the vertical axis and the names of the loci and chromosomes are represented on the horizontal axis. The posterior probability values (PP4) are also indicated on the plot
Fig. 5
Fig. 5
Illustration of colocalization analysis results in females. A Locus comparison plots of shared genomic loci between males and females (B) Locus comparison plots of female-specific genomic loci. The protein names and strength of association (-log10 p-values) are displayed on the vertical axis against the chromosomal physical position on the horizontal axis. The posterior probability values (PP4) are also indicated on the plot
Fig. 6
Fig. 6
Distribution of pQTLs after meta-analysis in both cohorts. Total number of pQTL variants with consistent effect size direction in both cohorts after meta-analysis (P < 0.05) in males (A) and in females (B). C Number of male-specific pQTL variants with strong suggestive cut-off (P < 5 X 10⁻⁵) per protein after meta-analysis of both cohorts in males. D Number of female-specific pQTL variants with strong suggestive cut-off (P < 5 X 10⁻⁵) per protein after meta-analysis of both cohorts in females
Fig. 7
Fig. 7
Illustration of functional annotation results of sex-specific pQTLs (p value = 5 × 10–5). Distribution of sex-specific pQTL variants’ functional consequences in males (A) and females (B). Bar plots distributions of RegulomeDB scores indicating the regulatory potential of pQTL variants for males (C) and females (D). Interpretation of the scores is sandwiched in between the bar plots. Line plots of Transcription factor enrichment analysis of male-specific pQTL variants (E) and female-specific pQTL variants (F). The top 25 enriched TFs are ploted on the x-axis and the level of significance are indicated in the color legend
Fig. 8
Fig. 8
Biological interpretation of sex-biased pQTLs variants (p value = 5 × 10–5). Pathway enrichment analysis using significantly enriched TFs matched to the sex-specific pQTL variants in males (A) and in females (B). Pathway enrichment analysis of annotated gene sets in males (C) and in females (D). P-value < 0.05 with Bonferroni multiple correction method was set for significantly enriched terms (category). Genes and or TF names related to the pathways are displayed on the circular plot

References

    1. Ober C, Loisel DA, Gilad Y. Sex-specific genetic architecture of human disease. Nat Rev Genet. 2008;9:911. doi: 10.1038/nrg2415. - DOI - PMC - PubMed
    1. Angum F, Khan T, Kaler J, Siddiqui L, Hussain A. The prevalence of autoimmune disorders in women: a narrative review. Cureus. 2020;12:e8094. doi: 10.7759/cureus.8094. - DOI - PMC - PubMed
    1. Bouman A, Jan Heineman M, Faas MM. Sex hormones and the immune response in humans. Hum Reprod Update. 2005;11:411. doi: 10.1093/humupd/dmi008. - DOI - PubMed
    1. Vemuri R, et al. The microgenderome revealed: sex differences in bidirectional interactions between the microbiota, hormones, immunity and disease susceptibility. Seminars Immunopathol. 2019;41:265. doi: 10.1007/s00281-018-0716-7. - DOI - PMC - PubMed
    1. Bianchi I, Lleo A, Gershwin ME, Invernizzi P. The X chromosome and immune associated genes. J Autoimmun. 2012;38:187. doi: 10.1016/j.jaut.2011.11.012. - DOI - PubMed

Publication types

LinkOut - more resources