. 2024 Feb 7;25(1):45.
doi: 10.1186/s13059-024-03172-3.

IDHwt glioblastomas can be stratified by their transcriptional response to standard treatment, with implications for targeted therapy

Affiliations

IDHwt glioblastomas can be stratified by their transcriptional response to standard treatment, with implications for targeted therapy

Georgette Tanner et al. Genome Biol. .

Abstract

Background: Glioblastoma (GBM) brain tumors lacking IDH1 mutations (IDHwt) have the worst prognosis of all brain neoplasms. Patients receive surgery and chemoradiotherapy but tumors almost always fatally recur.

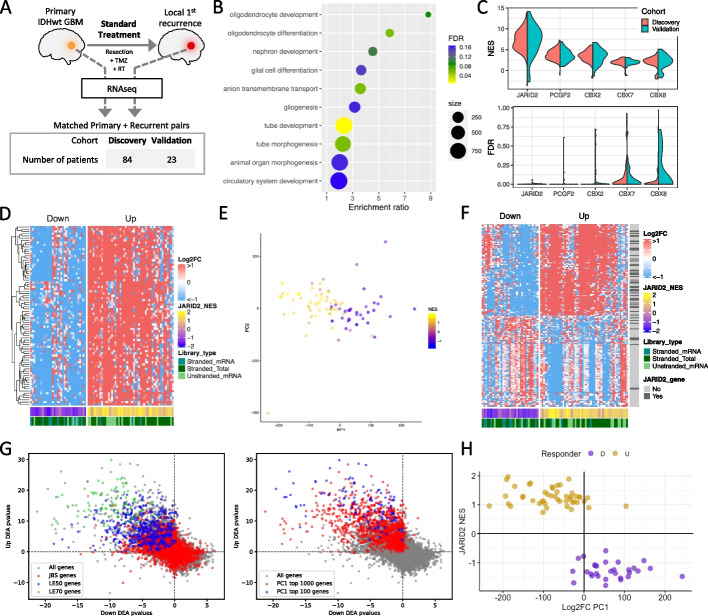
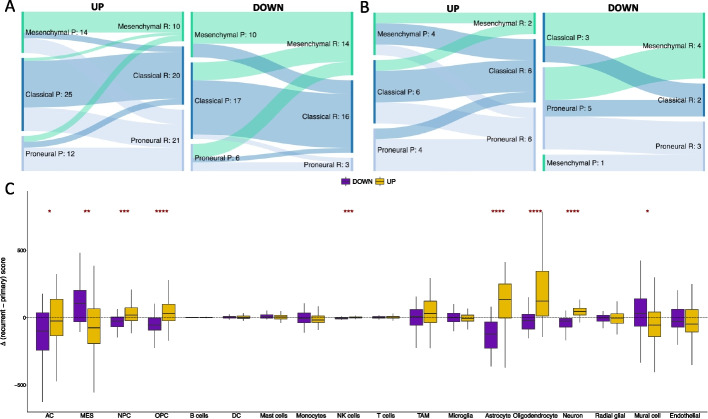
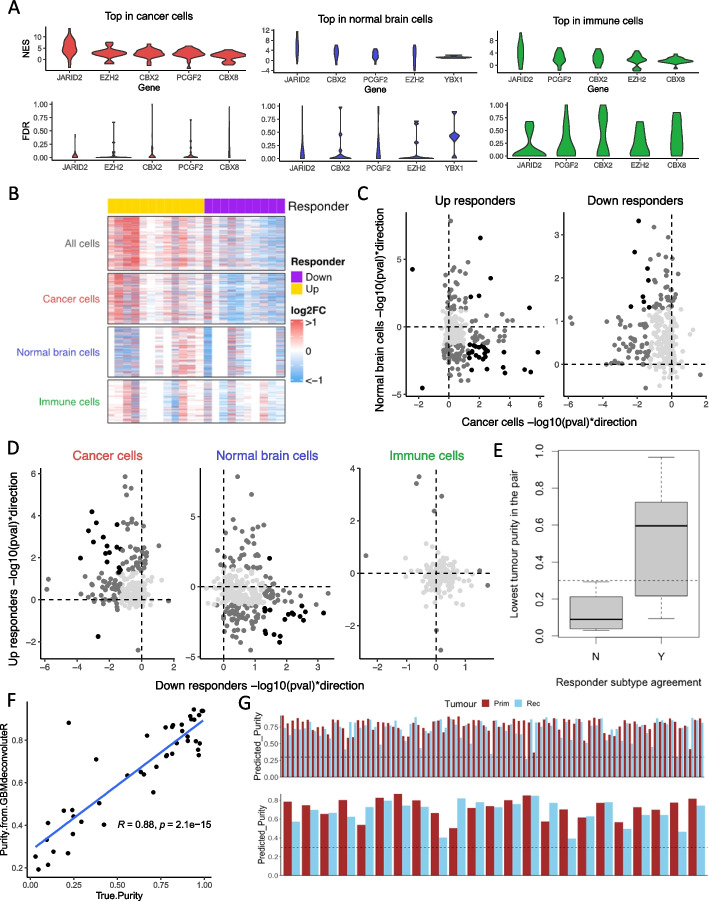
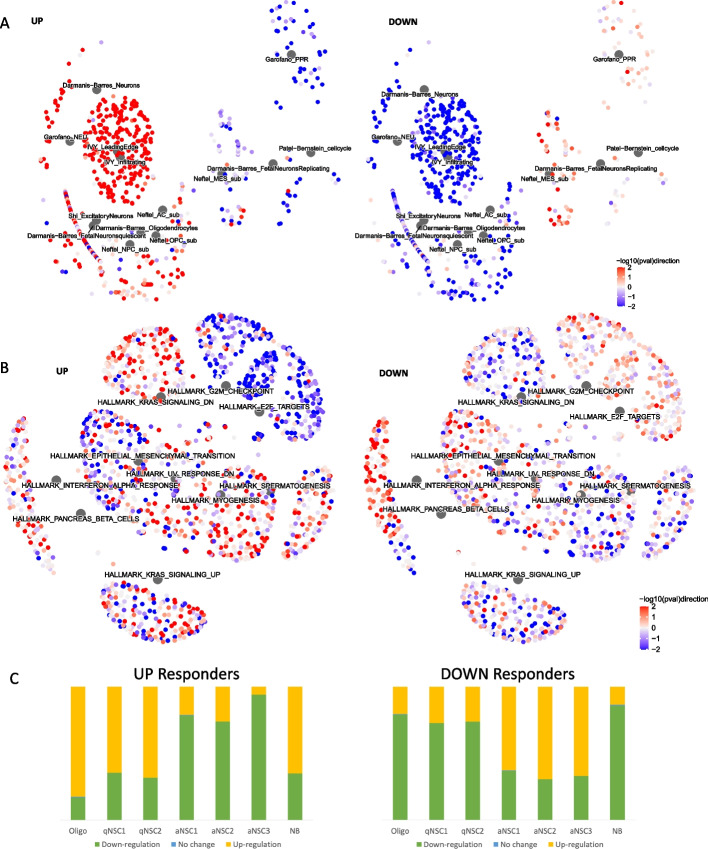
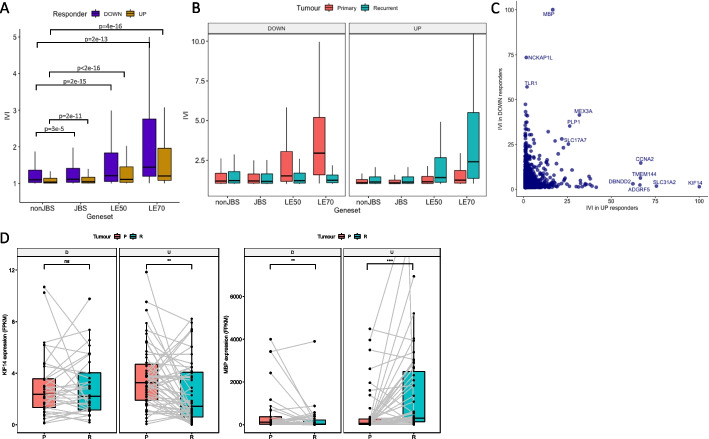
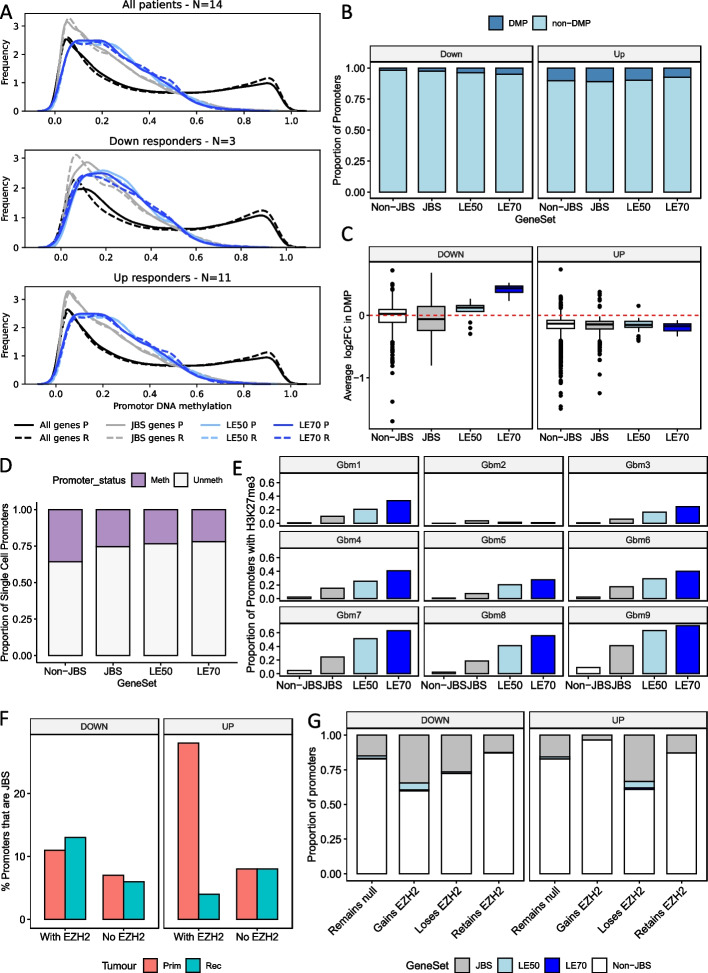
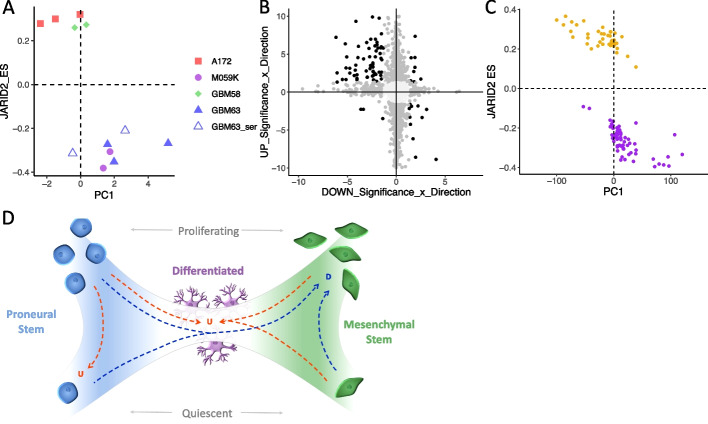
Results: Using RNA sequencing data from 107 pairs of pre- and post-standard treatment locally recurrent IDHwt GBM tumors, we identify two responder subtypes based on longitudinal changes in gene expression. In two thirds of patients, a specific subset of genes is upregulated from primary to recurrence (Up responders), and in one third, the same genes are downregulated (Down responders), specifically in neoplastic cells. Characterization of the responder subtypes indicates subtype-specific adaptive treatment resistance mechanisms that are associated with distinct changes in the tumor microenvironment. In Up responders, recurrent tumors are enriched in quiescent proneural GBM stem cells and differentiated neoplastic cells, with increased interaction with the surrounding normal brain and neurotransmitter signaling, whereas Down responders commonly undergo mesenchymal transition. ChIP-sequencing data from longitudinal GBM tumors suggests that the observed transcriptional reprogramming could be driven by Polycomb-based chromatin remodeling rather than DNA methylation.

Conclusions: We show that the responder subtype is cancer-cell intrinsic, recapitulated in in vitro GBM cell models, and influenced by the presence of the tumor microenvironment. Stratifying GBM tumors by responder subtype may lead to more effective treatment.


Conflict of interest statement

RGWV is a consultant for NeuroTrials, Inc, and Stellanova Therapeutics. AD is the director of AD Bioinformatics Ltd. LFS is on the Scientific Advisory Board for CoSyne Therapeutics Ltd.

Figures

Fig. 1
Fig. 1
A Schematic of the study design and cohort sizes. These panels visualize data from the Discovery cohort (Validation data is in supplemental figures). B Biological processes enriched in the genes differentially expressed between matched primary and recurrent GBMs. C Per-patient normalized enrichment scores (NES, top plot) and false discovery rates (FDR, bottom plot) for top-scoring promoter-binding factors associated with longitudinal gene expression changes. D Heatmap of the longitudinal fold change in expression for each patient (columns) for the JARID2 binding sites genes (JBSgenes) in the leading edge of > 50% of patients (LE50 genes, rows). Patients separate into Up (NES > 0) and Down (NES < 0) responders irrespective of RNAseq library preparation approach. E Patients are plotted, colored by JBSgenes NES, according to principal components 1 (PC1) and 2 (PC2) of their whole transcriptome longitudinal fold change in expression. F Heatmap of the longitudinal fold change in expression for each patient (columns) for the largest 100 positive and largest 100 negative weighted genes of PC1 from panel E (rows). Whether each gene is a JBSgene is also indicated. G Each gene is plotted according to its -log10p-value result of separate differential expression analyses (DEA) in matched recurrent vs primary tumors in Down (x-axis) and Up (y-axis) responders. Left plot: genes colored according to whether they are JBSgenes or, more specifically, LE50 and LE70 genes. Right plot: genes colored according to whether they are in the top 100 or 1000 genes ranked by the absolute value of PC1 from the analysis in panel E. H Plotting patients according to their JBSgene NES and PC1 score from panel E clearly separates Up and Down responders
Fig. 2
Fig. 2
A Sankey plots showing the prevalence of subtype switching from primary (P) to recurrent (R) GBM in the Up responders (left) and Down responders (right) in the Discovery cohort. B The same as panel A but for the Validation cohort. C The distributions of change in cell type score, assigned per sample by GBMdeconvoluteR, between primary and matched recurrent GBMs in Down (purple) and Up (gold) responders. The horizonal dotted line indicates no change. The median is denoted by a black horizontal line. Significance is denoted by asterisks: *p < 0.05; **p < 0.01; ***p < 0.001; ****p < 0.0001. Neoplastic GBM cells are on the left of the plot: AC, astrocyte-like; MES, mesenchymal-like; NPC, neural progenitor-like; OPC, oligodendrocyte progenitor-like
Fig. 3
Fig. 3
A Per-patient normalized enrichment scores (NES, top plot) and false discovery rates (FDR, bottom plot) for the top-scoring promoter-binding factors associated with longitudinal gene expression changes in purified pseudo-bulk samples formed by combining single-cell profiles for: cancer cells (left), normal brain cells (middle), and immune cells (right). B Heatmaps showing the longitudinal fold-change in expression (Log2FC) of LE50 genes (rows) in pseudo-bulk samples consisting of all cells, or purified cell subsets. The responder subtype for each patient (columns), derived from the “all cell” pseudo-bulk, is indicated by the top color bar. C, D LE50 genes plotted according to their direction and significance of dysregulation through treatment in cancer cells (x-axis) and normal brain cells (y-axis) when differential expression analysis is performed separately in Up (left) and Down (right) responders (C); or in Down responders (x-axis) versus Up responders (y-axis) when differential expression analysis is performed separately in pseudo-bulk samples of pure cancer cells (left), normal brain cells (middle), or immune cells (right) (D). Light gray: p > 0.05 in both comparison; dark gray: p < 0.05 in one; black: p < 0.05 in both. E Boxplots of lowest tumor purity (cancer cells as a proportion of all cells) in a longitudinal pair split by to whether that patient’s responder subtype agreed between the cancer cell subset and full tumor pseudo-bulk (Y) or not (N). Dotted line = 30% tumor purity. F True purity of each GBM sample plotted against the purity predicted by applying GBMdeconvoluteR and using the resulting scores in the formula (MES + AC)/(MES + AC + B + DC + Mast + NK + T + Oligodendrocytes). Shaded area: 95% confidence interval. G Predicted tumor purity for Discovery cohort (top) and the Validation cohort (bottom) samples. Dotted line: 30% tumor purity
Fig. 4
Fig. 4
A Network plots showing the GBM biology-specific gene sets (described in Additional file 1: Table S24) that are significantly enriched (FDR < 0.05) in either, or both, Up or Down responders through treatment. Large gray hub nodes indicate the gene sets. These have associated, smaller, leaf nodes signifying the genes in that set, colored according to the strength and direction of differential expression through treatment (quantified as -log10p-value multiplied by the direction of fold change: -log10(pval)direction) in Up responders (left image) or Down responders (right image). B As for panel C but visualizing the Hallmark gene sets from MSigDB that were enriched with an FDR < 0.25 in either, or both, responder subtypes. C The proportion of neural stem cell markers of quiescence (qNSC) or active cycling (aNSC), or markers of more differentiated neuroblasts (NB) or oligodendrocytes (Oligo), that were upregulated (yellow), downregulated (green), or stable (blue) in Up (left) and Down (right) responders
Fig. 5
Fig. 5
A The distribution of integrated value of influence (IVI) scores for different gene sets, calculated from log2FC (fold change in expression from recurrent to primary) correlation networks, for Down (purple) and Up (gold) responders. nonJBS: genes not in the JARID2 gene set; JBS: genes in the JARID2 gene set but excluding those in the leading edge of at least 50% of patients (LE50 genes); LE50: genes in the LE50 gene set but excluding those in the LE70 gene set; LE70: genes in the leading edge of at least 70% of patients. B As panel A except correlation networks were built from gene expression data in primary (salmon pink) or recurrent (teal) tumors in Down (left panel) or Up (right panel) responders, separately. C Genes are plotted according to their IVI score in log2FC networks of Down (x-axis) and Up (y-axis) responders. Genes that are high in both, or uniquely high in one, log2FC network are labeled. D The expression values for genes encoding Kinesin Family Member 14 (KIF14: left image) and Myelin Basic Protein (MBP: right image) are shown in the primary (salmon pink) and recurrent (teal) tumors of Down (D) and Up (U) responders. Gray lines indicate expression values in primary and recurrent GBMs from the same patient. Significance is denoted: ns, not significant; *p < 0.05; **p < 0.01; ***p < 0.001; ****p < 0.0001
Fig. 6
Fig. 6
A The distribution of average promoter DNA methylation for all genes, JARID2 binding site (JBS)genes, LE50 and LE70 genes in primary (P) and recurrent (R) GBM tumors from all patients (top) and once separated into Down (middle) and Up (bottom) responders. B The proportion of differentially methylated promoters (DMP) between primary and matched recurrent GBM. C The average change in methylation between primary and matched recurrent tumors for the DMP from panel B. D The proportion of single GBM cell promoters that have different methylation status. E The proportion of promoters with the H3K27me3 mark in nine patient GBMs. F The proportion of JBSgene promoters that had EZH2 bound according to ChIPseq of paired patient samples from an Up and a Down responder. G The proportion of promoters with a specific change in EZH2 occupancy that belonged to each gene set
Fig. 7
Fig. 7
A Replicate experiments in GBM cell line spheroids with and without chemoradiation are plotted according to the JARID2 gene set enrichment score (ES) and the value of first principal component (PC1) when results are projected onto the patient principal components in Fig. 1E. B Results of differential expression (DE) analysis between treated and untreated spheroids of Up responder and Down responder cell lines separately (n = 2 or 3). Genes are plotted according to their -log10-adjusted p-value multiplied by the log2fold change (FCp). Colors denote if the gene is significantly DE (FDR < 0.05) in none (light gray), one (dark gray), or both (black) responder subtypes. C Patient GBM samples cultured as organotypic slices and either treated with irradiation and TMZ or left untreated plotted according to the JARID2 gene set ES and PC1 when results are projected onto the patient principal components shown in Fig. 1E. Models are colored according to whether they are Up (gold) or Down (purple) responders. D Our working model to explain GBM responder subtypes: GBM cells are on a phenotypic axis between proneural and mesenchymal stem cells. These stem cells can be in a quiescent or actively cycling state. Differentiated, interconnected (with both each other and surrounding normal cells) cell states lie in the center of the axis. In Down responders, cells in the GBM tumor move towards the mesenchymal phenotype and increase proliferation rates over time. In Up responders, neoplastic GBM cells either become more differentiated and integrate with surrounding cells, upregulating neurotransmitter signaling as they do, or they convert to or remain as proneural stem cells but in a quiescent state over time

References

    1. Barthel FP, Johnson KC, Varn FS, Moskalik AD, Tanner G, Kocakavuk E, Anderson KJ, Abiola O, Aldape K, Alfaro KD, et al. Longitudinal molecular trajectories of diffuse glioma in adults. Nature. 2019;576:112–120. doi: 10.1038/s41586-019-1775-1. - DOI - PMC - PubMed
    1. Korber V, Yang J, Barah P, Wu Y, Stichel D, Gu Z, Fletcher MNC, Jones D, Hentschel B, Lamszus K, et al. Evolutionary trajectories of IDH(WT) glioblastomas reveal a common path of early tumorigenesis instigated years ahead of initial diagnosis. Cancer Cell. 2019;35(692–704):e612. - PubMed
    1. Neftel C, Laffy J, Filbin MG, Hara T, Shore ME, Rahme GJ, Richman AR, Silverbush D, Shaw ML, Hebert CM, et al. An integrative model of cellular states, plasticity, and genetics for glioblastoma. Cell. 2019;178(835–849):e821. - PMC - PubMed
    1. Couturier CP, Ayyadhury S, Le PU, Nadaf J, Monlong J, Riva G, Allache R, Baig S, Yan X, Bourgey M, et al. Single-cell RNA-seq reveals that glioblastoma recapitulates a normal neurodevelopmental hierarchy. Nat Commun. 2020;11:3406. doi: 10.1038/s41467-020-17186-5. - DOI - PMC - PubMed
    1. Wang L, Babikir H, Muller S, Yagnik G, Shamardani K, Catalan F, Kohanbash G, Alvarado B, Di Lullo E, Kriegstein A, et al. The phenotypes of proliferating glioblastoma cells reside on a single axis of variation. Cancer Discov. 2019;9:1708–1719. doi: 10.1158/2159-8290.CD-19-0329. - DOI - PMC - PubMed

Publication types