. 2024 Feb 7;13(1):14.
doi: 10.1186/s40164-024-00484-9.

The HSP90-MYC-CDK9 network drives therapeutic resistance in mantle cell lymphoma

Affiliations

The HSP90-MYC-CDK9 network drives therapeutic resistance in mantle cell lymphoma

Fangfang Yan et al. Exp Hematol Oncol. .

Abstract

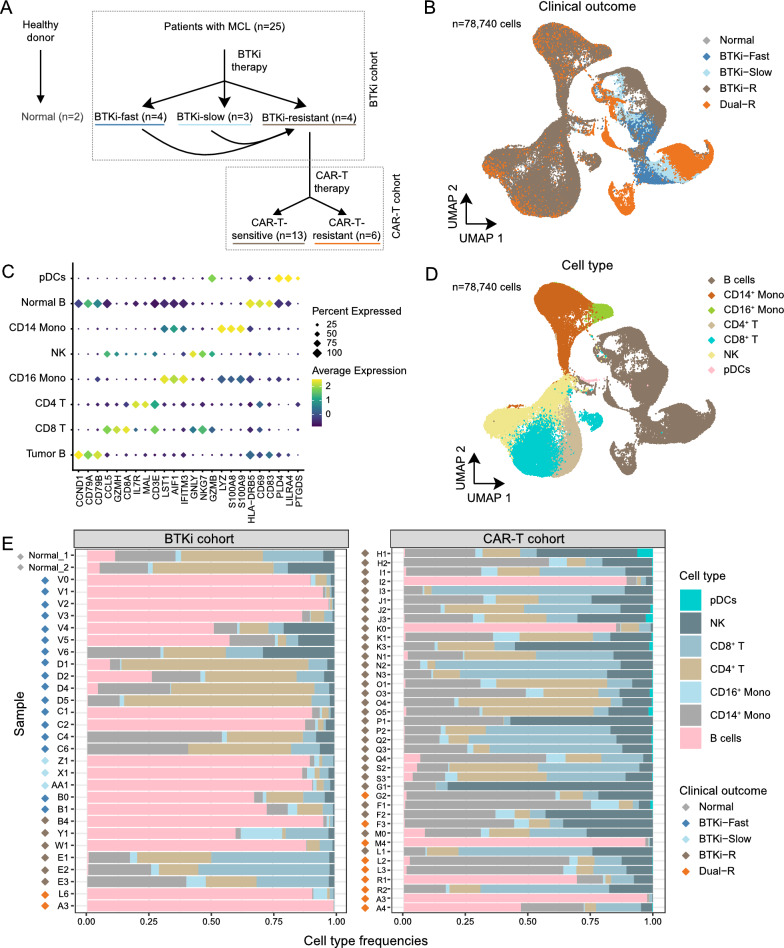
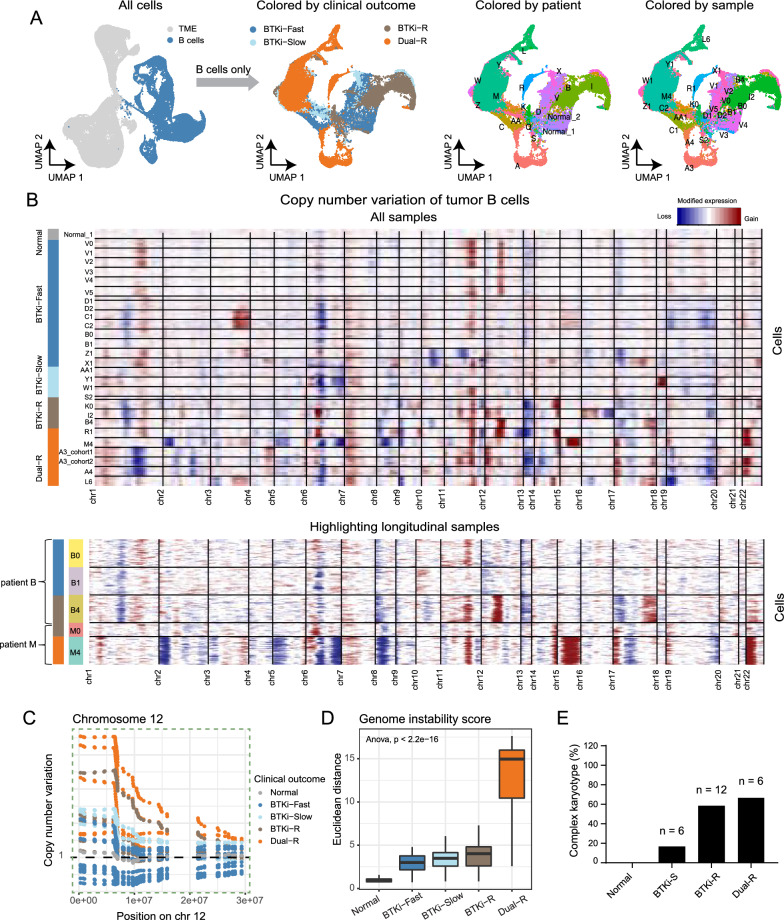
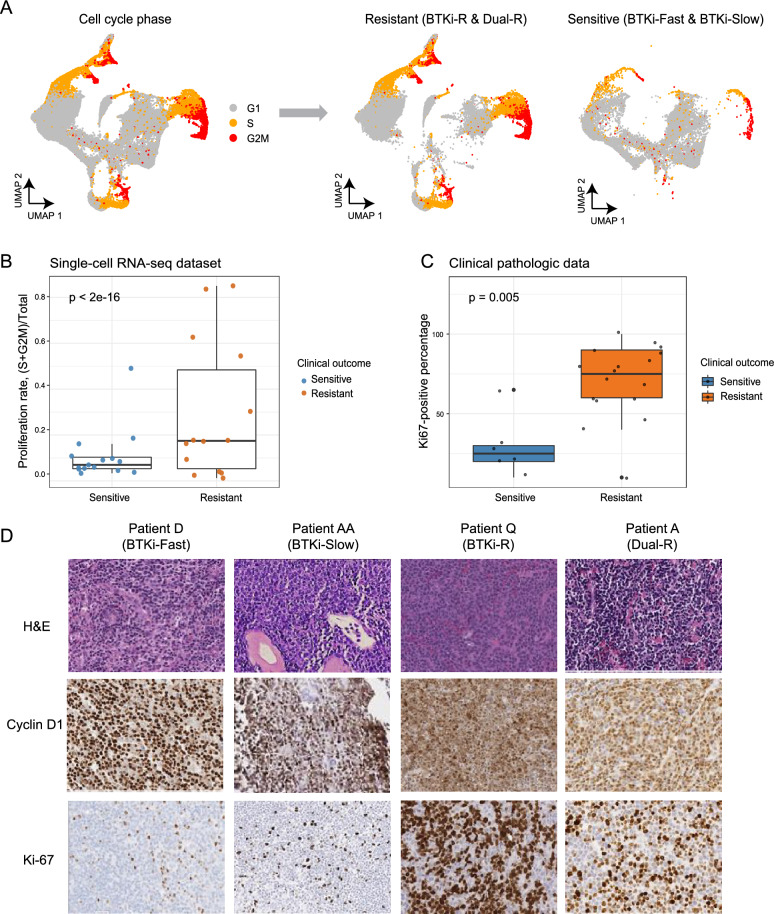
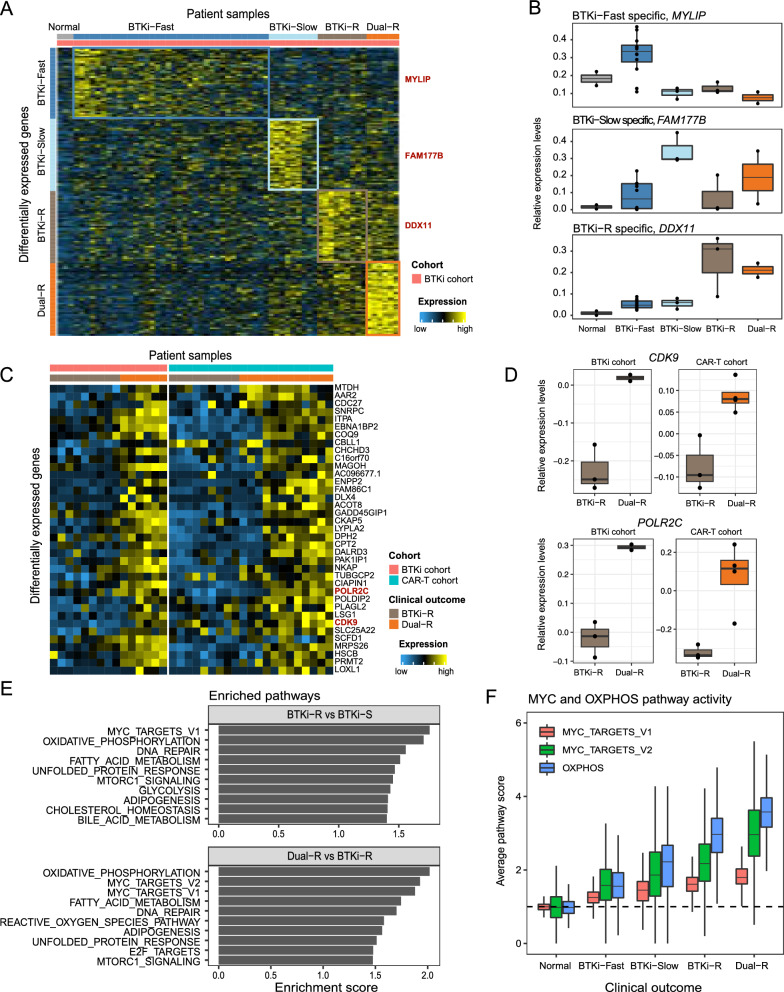
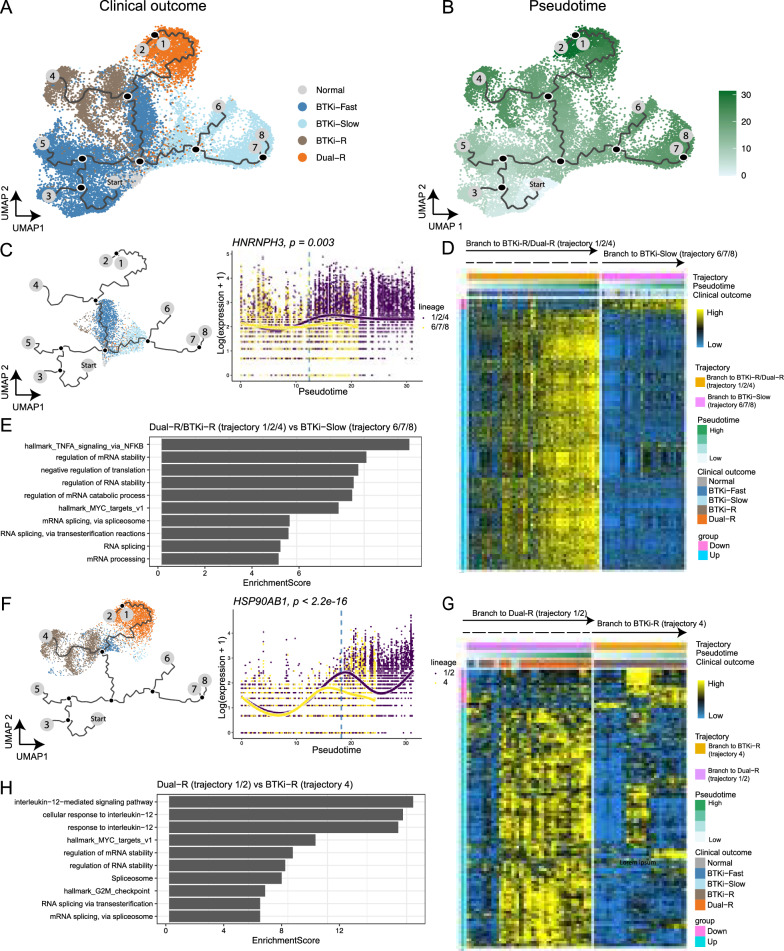
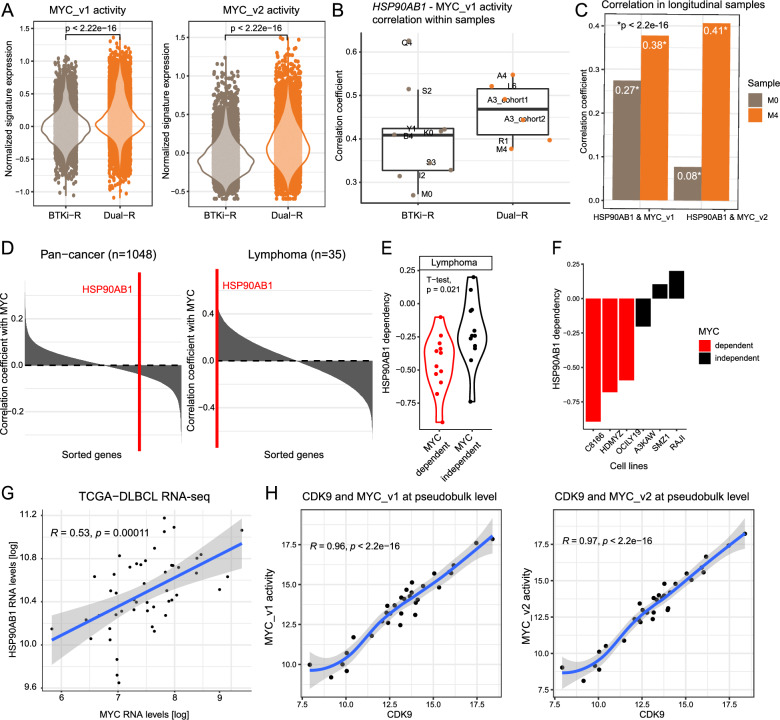
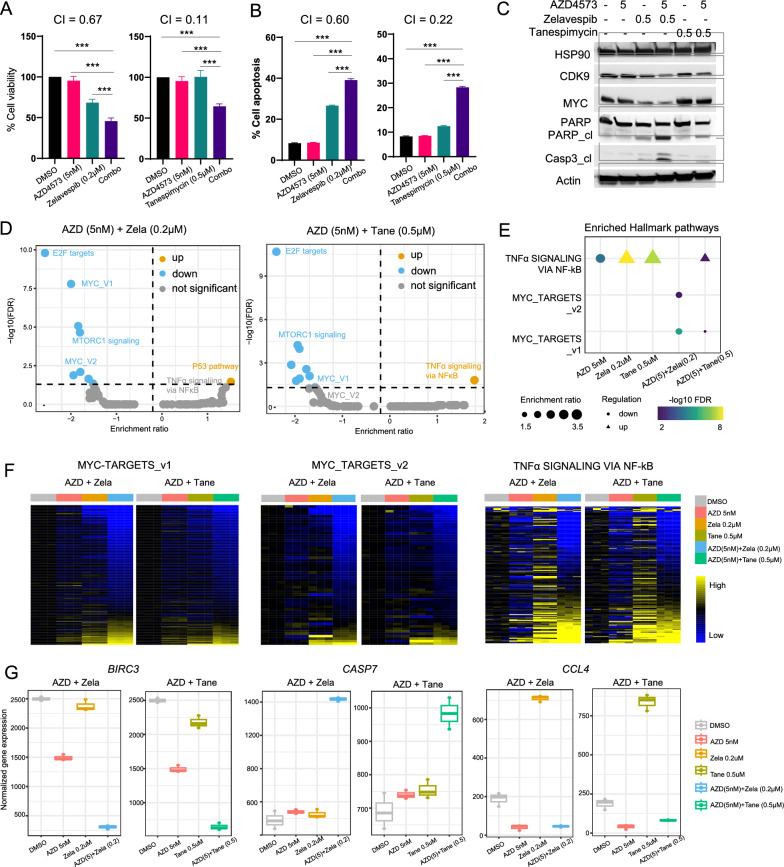
Brexucabtagene autoleucel CAR-T therapy is highly efficacious in overcoming resistance to Bruton's tyrosine kinase inhibitors (BTKi) in mantle cell lymphoma. However, many patients relapse post CAR-T therapy with dismal outcomes. To dissect the underlying mechanisms of sequential resistance to BTKi and CAR-T therapy, we performed single-cell RNA sequencing analysis for 66 samples from 25 patients treated with BTKi and/or CAR-T therapy and conducted in-depth bioinformatics™ analysis. Our analysis revealed that MYC activity progressively increased with sequential resistance. HSP90AB1 (Heat shock protein 90 alpha family class B member 1), a MYC target, was identified as early driver of CAR-T resistance. CDK9 (Cyclin-dependent kinase 9), another MYC target, was significantly upregulated in Dual-R samples. Both HSP90AB1 and CDK9 expression were correlated with MYC activity levels. Pharmaceutical co-targeting of HSP90 and CDK9 synergistically diminished MYC activity, leading to potent anti-MCL activity. Collectively, our study revealed that HSP90-MYC-CDK9 network is the primary driving force of therapeutic resistance.

Keywords: CAR-T therapy; Mantle cell lymphoma; Resistance; Single-cell RNA sequencing.


Conflict of interest statement

MW is consultant to AstraZeneca, BeiGene, BioInvent, CSTone, Deciphera, DTRM Biopharma (Cayman) Limited, Epizyme, Genentech, InnoCare, Janssen, Juno Therapeutics, Kite Pharma, Lilly, Loxo Oncology, Miltenyi Biomedicine GmbH, Oncternal, Pepromene Bio, Pharmacyclics, VelosBio. MW has received research support from Acerta Pharma, AstraZeneca, BeiGene, BioInvent, Celgene, Genmab, Genentech, Innocare, Janssen, Juno Therapeutics, Kite Pharma, Lilly, Loxo Oncology, Molecular Templates, Oncternal, Pharmacyclics, VelosBio, Vincerx. MW received a speaker honoraria from Acerta Pharma, Anticancer Association, AstraZeneca, BeiGene, BGICS, BioInvent, CAHON, Clinical Care Options, Dava Oncology, Eastern Virginia Medical School, Epizyme, Hebei Cancer Prevention Federation, Imedex, Janssen, Kite Pharma, Leukemia & Lymphoma Society, LLC TS Oncology, Medscape, Meeting Minds Experts, Miltenyi Biomedicine GmbH, Moffit Cancer Center, Mumbai Hematology Group, OMI, OncLive, Pharmacyclics, Physicians Education Resources (PER), Practice Point Communications (PPC), The First Afflicted Hospital of Zhejiang University. ZZ is a consultant of Melax.

Figures

Fig. 1
Fig. 1
scRNA-seq reveals transcriptomic heterogeneity in MCL patients with diverse clinical outcomes. A Experimental design summarizing patient sample information. Patient samples were categorized into five clinical outcomes according to their sensitivity to BTKi or CAR-T therapy. The number of patients (n) were denoted in the plot. B UMAP visualization represents cells colored by cell type. C Dot plot illustrates marker gene expression across cell types. Colors indicate low (purple) to high (yellow) expression. The circle size is proportional to the percentage of cells in which the gene was expressed. D UMAP visualization represents cells colored by clinical outcomes. E Bar plot shows cell type frequencies (x-axis) of each sample (y-axis) in the BTKi (left) or CAR-T (right) cohorts. Dot in front of each sample indicate clinical outcomes
Fig. 2
Fig. 2
Tumor B-cell copy number variation (CNV) promotes the evolution of therapeutic resistance. A Left: UMAP visualization of all cells with B cells highlighted in blue. Right: UMAP visualizations of B cells colored by clinical outcomes, patient, and sample. B Heatmap displays cellular CNV profiles (row) of each cell across chromosomes (columns) for all samples (top) and restricted to longitudinal samples (bottom). Colors reflect copy number gains (red) and losses (blue). Sample names and clinical outcomes are annotated on the left. Samples are ordered by aggressiveness from the top (normal) to the bottom (Dual-R). C Plot shows the inferred copy number estimates (y-axis) for samples across chromosome 12 (x-axis). Horizontal dashed line represents expected normal copy number. D Boxplot shows the Euclidean distance (y-axis) derived from the CNV profile-based low dimensional space across different clinical outcomes (x-axis). E Percentages of complex karyotype in each clinical outcome group
Fig. 3
Fig. 3
Resistant tumor cells acquire elevated proliferation rates. A Left: UMAP visualization of B cells colored by inferred cell cycle stages (G1, S, G2/M). Right: UMAP visualizations of B cells divided by clinical outcome: sensitive (BTKi-Fast and BTKi-Slow) and resistant (BTKi-R and Dual-R). Each dot represents one cell. Gray, orange, and red represent G1, S, and G2M cell cycle stages, respectively. B Boxplot shows inferred proliferation rates (y-axis) across clinical outcomes (x-axis) in single-cell RNA-seq dataset. Each dot represents one sample and is colored by clinical outcome. P-value was calculated using a generalized binomial model. C Boxplot shows proliferation rates as indicated by Ki-67-positive immunohistochemical staining across clinical outcomes from clinical pathologic data. Each dot represents one patient and is colored by clinical outcome. D Representative bone marrow images stained with hematoxylin and eosin (upper panels) or immunohistochemically stained for cyclin D1 (middle panels) or Ki-67 (bottom panels) on samples from representative patients D (BTKi-Fast), AA (BTKi-Slow), Q (BTKi-R), and A (Dual-R)
Fig. 4
Fig. 4
Sequential resistance to BTKi and CAR-T therapies is reflected by specific gene expression fingerprints. A Heatmap shows the expression profile of outcome-specific genes (rows) across samples. Columns represent averaged expression profile of random 10 cells for each sample. Bars on the top denote clinical outcomes (five groups). Bars on the left highlight the outcome specific genes (four groups). B Boxplots show the expression of three outcome-specific gene expression across samples for representative genes MYLIP, FAM177B, and DDX11. Each dot represents averaged expression profile of random 10 cells for each sample. C Heatmap shows the expression profile of genes (rows) with significant changes between the Dual-R and BTKi-R samples across both cohorts. Columns represent averaged expression profile of random 10 cells for each sample. Representative genes (CDK9 and POLR2C) are highlighted in red. D Boxplots show differential expression of CDK9 and POLR2C in Dual-R and BTKi-R samples of both cohorts. Each dot represents averaged expression profile of random 10 cells for each sample. E Bar plots summarize the enriched pathways in different contrasts. Top: BTKi-R vs BTKi-sensitive (BTKi-Fast/Slow). Bottom: Dual-R vs BTKi-R. F Boxplots show average pathway scores (y-axis) of MYC_TARGETS_v1, MYC_TARGETS_v2, and OXPHOS gene sets across clinical outcomes (x-axis). There is a progressive enrichment of MYC targets and the OXPHOS pathway across the clinical outcomes
Fig. 5
Fig. 5
Pseudotemporal analysis reveals early-stage drivers acting on therapeutic resistance. A UMAP visualization illustrates inferred trajectories. Starting and end points are labeled with gray circles. Branch points are shown in black circles. Each dot represents one cell and is colored according to clinical outcome. B UMAP visualization colored by inferred pseudotime. (C) Left: UMAP visualization of cells used for comparison of BTKi-R/Dual-R (1/2/4) and BTKi-Slow (6/7/8) trajectories. Right: Scatter plot with fitted smooth curves shows the expression of top hit HNRNPH3 across pseudotime in the BTKi-R/Dual-R (1/2/4, purple) and BTKi-Slow (6/7/8, yellow) trajectories. A vertical dashed blue line marks the pseudotime at the branch point. D Heatmap shows the expression pattern of differentially expressed genes (rows) at the bifurcation point between the BTKi-R/Dual-R (1/2/4) and BTKi-Slow (6/7/8) trajectories (columns). Columns are ordered by trajectory with increasing pseudotime. Blue and yellow colors represent low and high expression, respectively. Bars on top illustrate clinical outcome, pseudotime, and inferred trajectories. E Gene set enrichment analysis summarizes the top enriched pathways. x-axis: normalized enrichment score. (F–H) Similar visualization as in C–E, focusing on the comparison of the Dual-R (1/2) and BTKi-R (4) trajectories
Fig. 6
Fig. 6
Coordination of HSP90, MYC, and CDK9 drives therapeutic resistance. A Violin plots show inferred cellular pathway activity of MYC_TARGETS_v1 and MYC_TARGETS_v2 across the BTKi-R and Dual-R groups. HSP90AB1 is a part of the MYC_TARGETS_v1 gene set. To avoid bias, we removed it from the MYC_TARGETS_v1 gene set. B Boxplots show intra-sample correlation coefficients between HSP90AB1 expression and MYC_TARGETS_v1 activity in the BTKi-R and Dual-R groups. Each dot represents the correlation between HSP90AB1 expression and MYC_TARGETS_v1 activity across the individual cells within a single sample. C Barplots show increased correlation between HSP90AB1 and MYC activities in longitudinal samples. D Plots show the correlation between HSP90AB1 and MYC dependencies (y-axis) for all genes in DepMap (y-axis) across all cancer cell lines (top) and restricted to lymphoma cell lines (bottom). Red vertical line marks the position of HSP90AB1 in genome-wide ranking of genes based on correlation with MYC. E Violin plots show increased HSP90AB1 dependency (y-axis) across lymphoma cell lines divided into MYC-dependent and -independent groups (x-axis). Low values indicate greater dependency. F Barplot shows HSP90AB1 dependency (y-axis) across select lymphoma cell lines (x-axis). Colors indicate MYC dependency. G Scatter plot shows the correlation of MYC and HSP90AB1 RNA-seq expression across tumors in the TCGA DLBCL cohort. H Scatter plot shows the correlation of CDK9 expression and MYC activities at pseudobulk level
Fig. 7
Fig. 7
Combined treatment of CDK9 and HSP90 inhibitors shows synergistic potent anti-MCL activity. A-B AZD4573 in combination with zelavespib or tanespimycin synergistically suppressed cell viability (A) and induced apoptosis (B) in Z138 cells upon treatment for 72 h. CI = (Id1 + Id2)/I(d1+d2). CI, combination index; Id1, the percentage of viability inhibition or apoptosis induction by drug #1 treatment; Id2, the percentage of viability inhibition or apoptosis induction by drug #2 treatment; I(d1+d2), the percentage of viability inhibition or apoptosis induction by combination treatment of drug #1 and #2. The combination effect is considered synergistic if CI < 0.9. C Western blot shows HSP90 inhibitors zelavespib and tanespimycin in combination with CDK9 inhibitor AZD4573 induced marked reduction of MYC expression and cleavage of PARP and caspase 3. D Volcano plot shows the log2 fold change (x-axis) and -log10 adjusted p-value (y-axis) of enriched pathways in different treatments. Left: at 5 nM plus zelavespib at 0.2 µM. Right: AZD4573 at 5 nM plus tanespimycin at 0.5 µM. Each dot represents an enriched pathway and is colored by significance (up: yellow, down: blue, not significant: grey). E Dot plot shows significantly enriched hallmark pathways (y-axis) for each group (x-axis) compared to control (DMSO). Dot shape represent regulation direction (circle: down, triangle: up). F Heatmaps display expression of genes from relevant pathways (rows) across conditions (columns). Data was normalized to the vehicle (DMSO) condition. Blue and yellow reflect low and high expression, respectively. Dual targeting of HSP90 and CDK9 markedly suppressed MYC_TARGETS_v1 (left), MYC_TARGETS_v2 (middle), and NF-κB targets (right). G Boxplots show representative genes altered upon treatment with CDK9 inhibitor AZD4573 and HSP90 inhibitors, alone or in combination. **, p < 0.01; ***, p < 0.001; ****, p < 0.0001

References

    1. Jain P, Wang ML. Mantle cell lymphoma in 2022-A comprehensive update on molecular pathogenesis, risk stratification, clinical approach, and current and novel treatments. Am J Hematol. 2022;97(5):638–656. doi: 10.1002/ajh.26523. - DOI - PubMed
    1. Wang ML, Rule S, Martin P, Goy A, Auer R, Kahl BS, et al. Targeting BTK with ibrutinib in relapsed or refractory mantle-cell lymphoma. N Engl J Med. 2013;369(6):507–516. doi: 10.1056/NEJMoa1306220. - DOI - PMC - PubMed
    1. Wang M, Rule S, Zinzani PL, Goy A, Casasnovas O, Smith SD, et al. Acalabrutinib in relapsed or refractory mantle cell lymphoma (ACE-LY-004): a single-arm, multicentre, phase 2 trial. Lancet. 2018;391(10121):659–667. doi: 10.1016/S0140-6736(17)33108-2. - DOI - PMC - PubMed
    1. Song YQ, Zhou KS, Zou DH, Zhou JF, Hu JD, Yang HY, et al. Safety and activity of the investigational Bruton tyrosine kinase inhibitor zanubrutinib (BGB-3111) in patients with mantle cell lymphoma from a phase 2 trial. Blood. 2018;132(Suppl 1):148. doi: 10.1182/blood-2018-99-117956. - DOI
    1. Wang M, Munoz J, Goy A, Locke FL, Jacobson CA, Hill BT, et al. KTE-X19 CAR T-cell therapy in relapsed or refractory Mantle-Cell Lymphoma. N Engl J Med. 2020;382(14):1331–1342. doi: 10.1056/NEJMoa1914347. - DOI - PMC - PubMed

LinkOut - more resources