. 2024 Feb 7;22(1):54.
doi: 10.1186/s12951-024-02320-y.

Injectable ultrasound-powered bone-adhesive nanocomposite hydrogel for electrically accelerated irregular bone defect healing

Affiliations

Injectable ultrasound-powered bone-adhesive nanocomposite hydrogel for electrically accelerated irregular bone defect healing

Shiqi Zhou et al. J Nanobiotechnology. .

Abstract

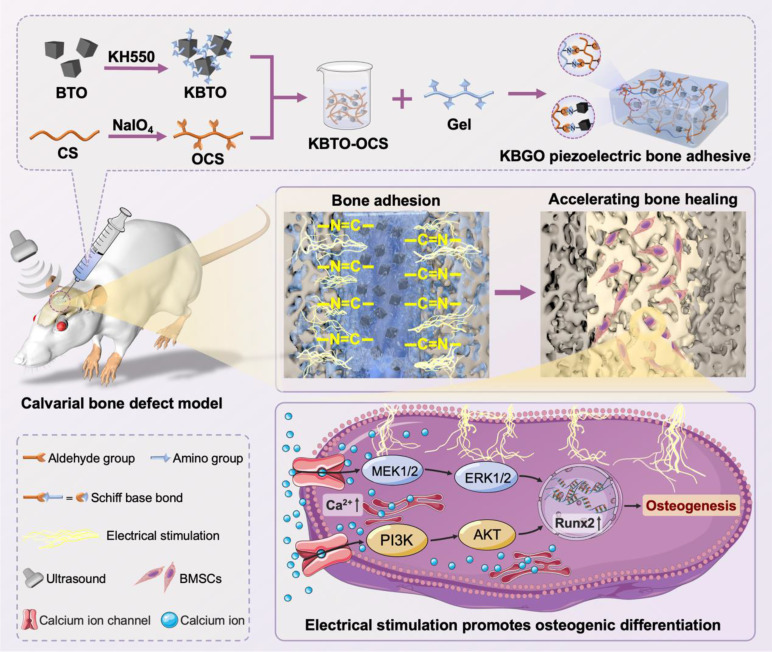
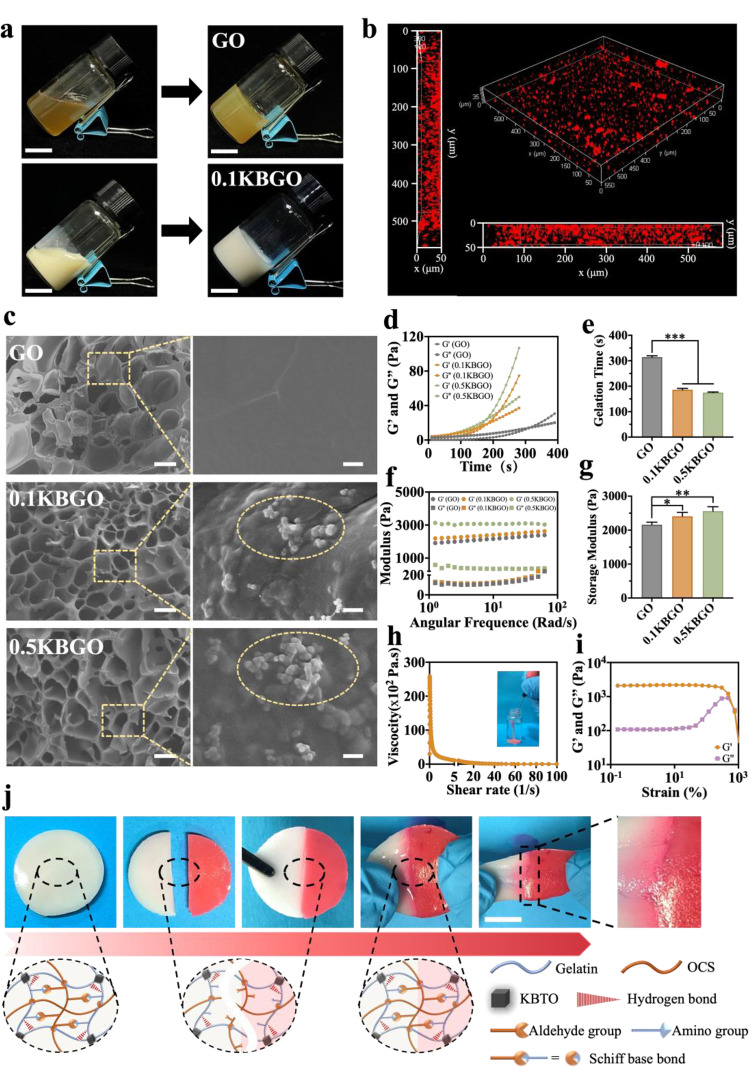
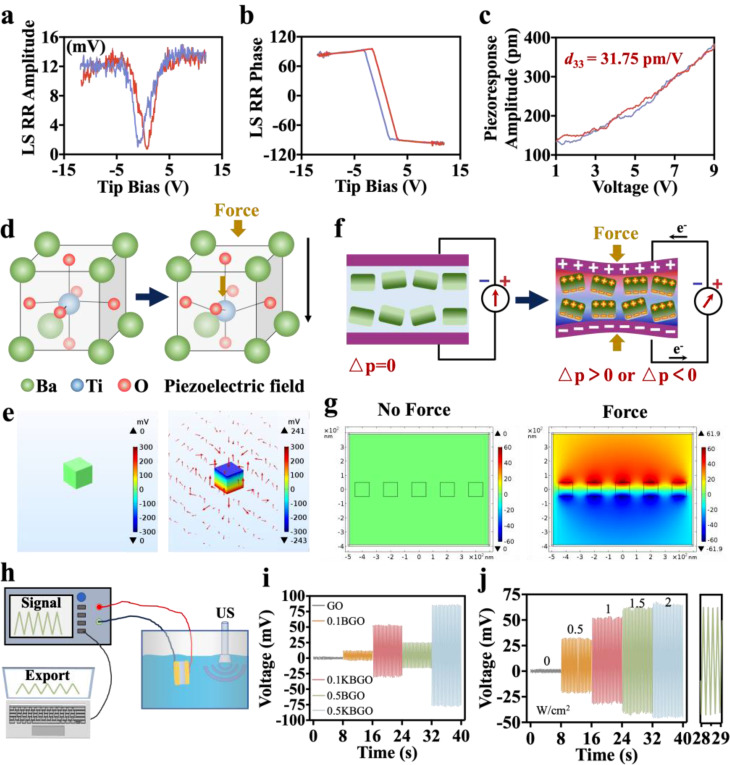
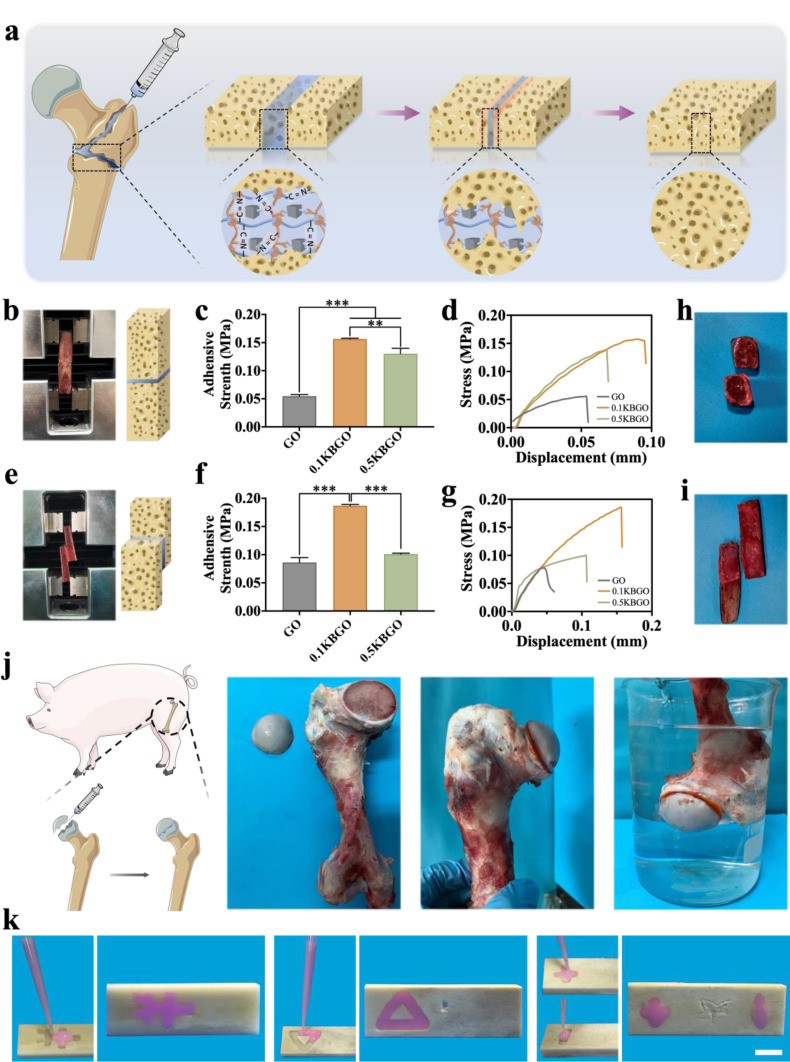
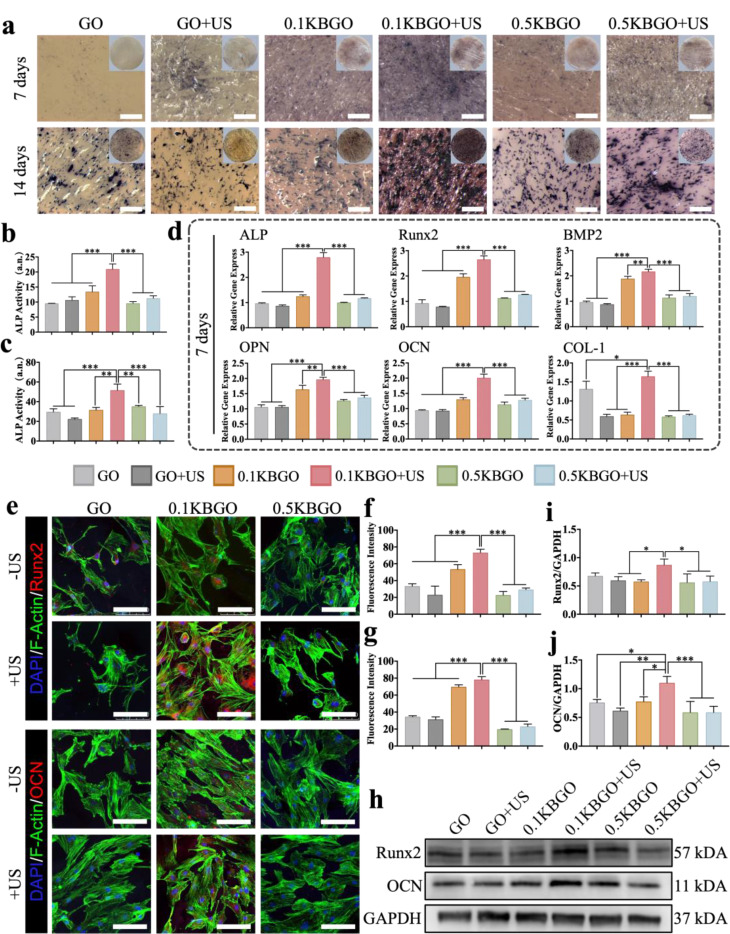
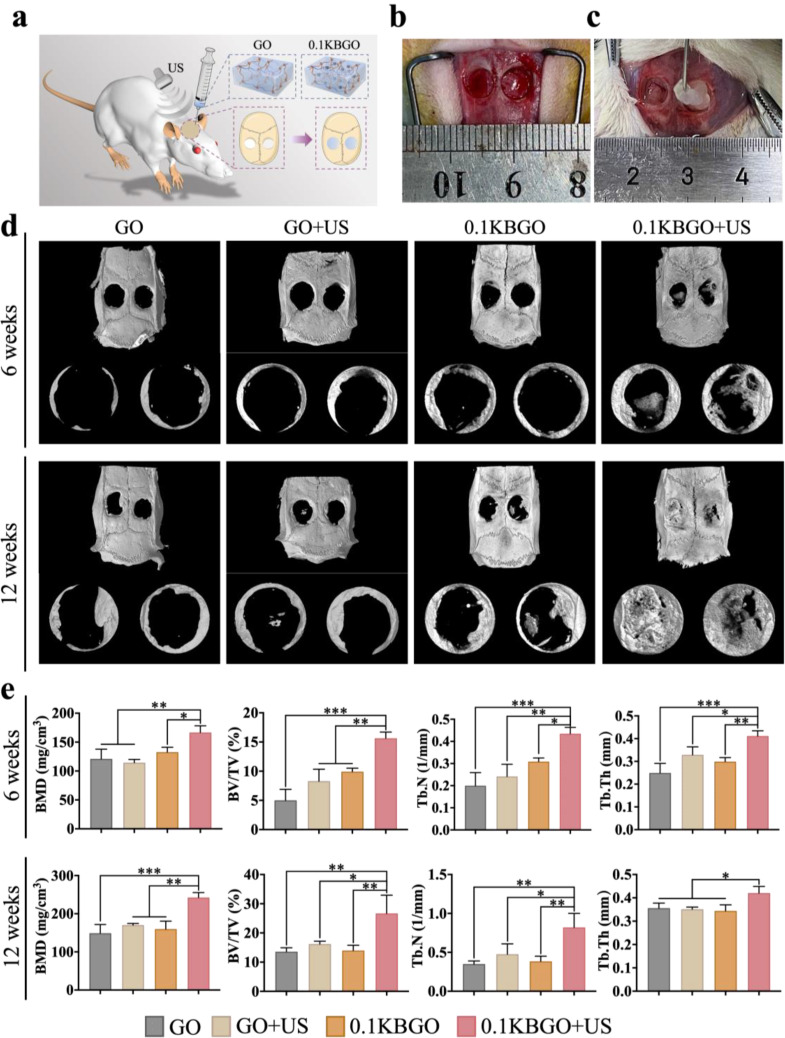
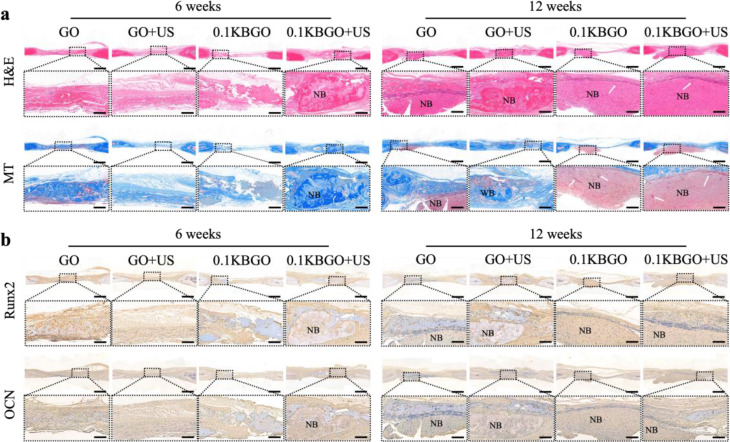
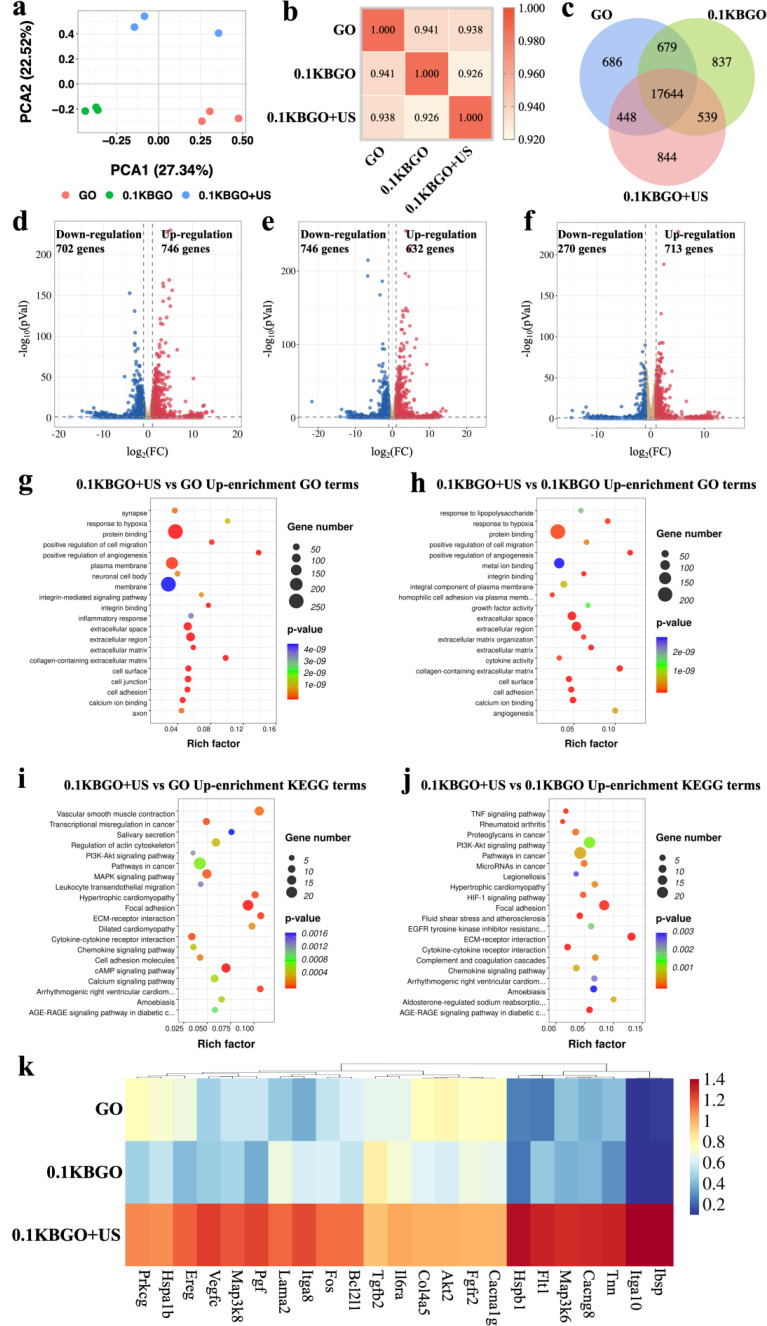
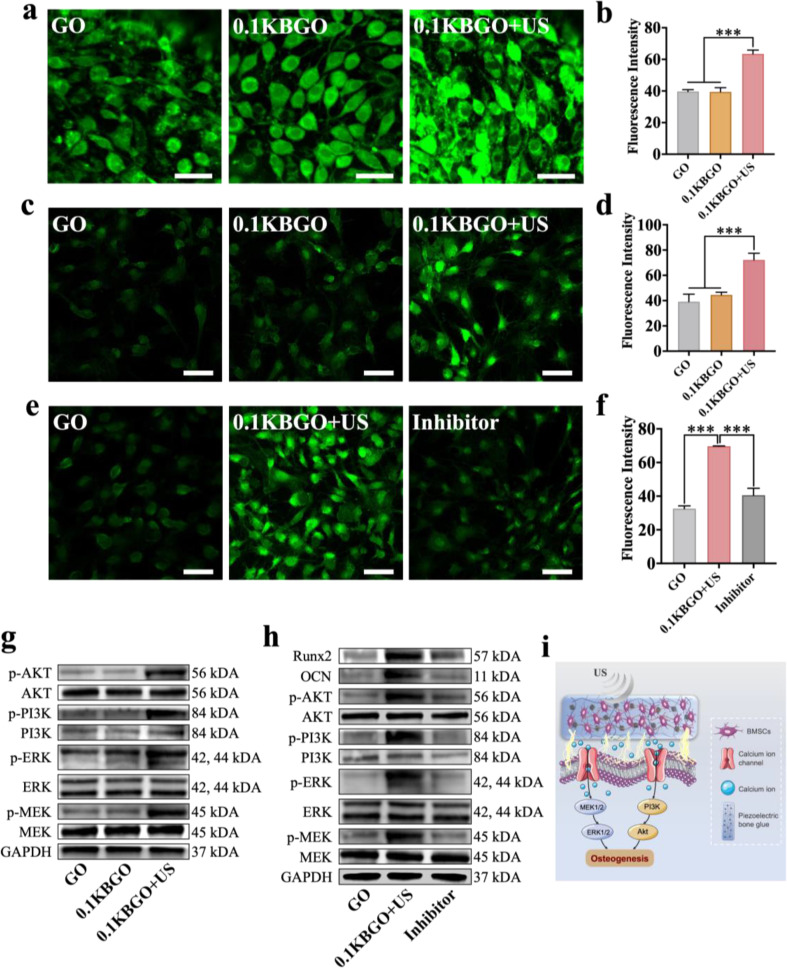
The treatment of critical-size bone defects with irregular shapes remains a major challenge in the field of orthopedics. Bone implants with adaptability to complex morphological bone defects, bone-adhesive properties, and potent osteogenic capacity are necessary. Here, a shape-adaptive, highly bone-adhesive, and ultrasound-powered injectable nanocomposite hydrogel is developed via dynamic covalent crosslinking of amine-modified piezoelectric nanoparticles and biopolymer hydrogel networks for electrically accelerated bone healing. Depending on the inorganic-organic interaction between the amino-modified piezoelectric nanoparticles and the bio-adhesive hydrogel network, the bone adhesive strength of the prepared hydrogel exhibited an approximately 3-fold increase. In response to ultrasound radiation, the nanocomposite hydrogel could generate a controllable electrical output (-41.16 to 61.82 mV) to enhance the osteogenic effect in vitro and in vivo significantly. Rat critical-size calvarial defect repair validates accelerated bone healing. In addition, bioinformatics analysis reveals that the ultrasound-responsive nanocomposite hydrogel enhanced the osteogenic differentiation of bone mesenchymal stem cells by increasing calcium ion influx and up-regulating the PI3K/AKT and MEK/ERK signaling pathways. Overall, the present work reveals a novel wireless ultrasound-powered bone-adhesive nanocomposite hydrogel that broadens the therapeutic horizons for irregular bone defects.

Keywords: Bone adhesive; Bone defects; Electrical stimulation; Injectability and self-healing; Nanocomposite hydrogel.


Conflict of interest statement

The authors declare no competing interests.

Figures

Scheme 1
Scheme 1
Schematic diagram illustrating the synthesis of an injectable ultrasound-powered bone-adhesive nanocomposite hydrogel and its application in electrically accelerated bone defect healing
Fig. 1
Fig. 1
Characteristic of injectable ultrasound-powered nanocomposite hydrogels. (a) Optical photos of hydrogels forming. Scale bar represents 1 cm. (b) 3D image of the distribution of KBTO nanoparticles (red fluorescence) in the 0.1KBGO hydrogel. (c) SEM images of GO, 0.1KBGO, and 0.5KBGO hydrogels and embedded KBTO nanoparticles (dotted bordered ellipse). Scale bars represent 60 µm and 2 µm (higher magnification). (d) Oscillation time sweep rheological behaviors of GO, 0.1KBGO, and 0.5KBGO hydrogels. (e) Gel time of hydrogels with different KBTO nanoparticles content. (f) Storage modulus (G’) and loss modulus (G”) of hydrogels at different shear frequencies. (g) Storage modulus at an angular frequency of 10 Rad/s. (h) Shear-thinning properties and the injectability image of 0.1KBGO hydrogel. (i) The strain amplitude sweep test of 0.1KBGO hydrogel. (j) Optical photos and schematic illustration of the self-healing behavior of 0.1KBGO hydrogel. Scale bar represents 1 cm. ANOVA followed by Tukey’s post hoc test was performed for statistical analysis (*p < 0.05, **p < 0.01, ***p < 0.001)
Fig. 2
Fig. 2
Mechano-electric response properties of the ultrasound-powered hydrogels. Piezo-response amplitude hysteresis loops (a) and phase curves (b) of KBTO nanoparticles. (c) Quantitative piezo-response amplitude measures the effective longitudinal piezoelectric coefficient of KBTO. (d) Schematic diagram of crystal structure changes of KBTO nanoparticle under mechanical force. (e) Finite-element simulation of the potential distribution of KBTO nanoparticle with COMSOL with or without pressure generated by ultrasound cavitation. (f) Schematic diagram of ultrasound-powered hydrogel generating voltage under pressure. (g) Finite-element simulation of the potential distribution of 0.1KBGO hydrogel without external force and under a constant 108 Pa force. (h) Schematic diagram of a laboratory-made piezoelectric voltage outputs test apparatus. (i) The output voltage of GO, 0.1BGO, 0.1KBGO, 0.5BGO, and 0.5KBGO hydrogels under ultrasonic stimulation with a sound intensity of 1 W/cm2. (j) The output voltage of 0.1KBGO hydrogel under ultrasonic stimulation with different sound intensities of 0 to 2 W/cm2 and the enlarged view under ultrasonic stimulation with a sound intensity of 1.5 W/cm2
Fig. 3
Fig. 3
Adhesion properties of ultrasound-powered hydrogels. (a) Schematic illustration of the KGBO piezoelectric hydrogel fixing bone fragments and facilitating bone regeneration. (b) The experiment of end-to-end adhesion strength test. (c) The end-to-end adhesion strength of GO, 0.1KBGO, and 0.5KBGO hydrogels. (d) Stress-displacement curves of end-to-end adhesion tensile test. (e) The experiment of lap-shear adhesion strength test. (f) The lap-shear adhesion strength of GO, 0.1KBGO, and 0.5KBGO hydrogels. (g) Stress-displacement curves of lap-shear adhesion tensile test. (h) Adhesion interfaces of end-to-end adhesion. (i) Adhesion interfaces of lap-shear adhesion. (j) Images of glued pig femur bone pieces with 0.1KBGO piezoelectric hydrogel. (k) The ultrasound-powered self-adaptive hydrogel filling irregularly shaped bovine bone defects. Scale bar represents 2 cm. ANOVA followed by Tukey’s post hoc test was performed for statistical analysis (*p < 0.05, **p < 0.01, ***p < 0.001)
Fig. 4
Fig. 4
In vitro osteogenic differentiation of BMSCs on ultrasound-powered hydrogel surfaces. (a) ALP staining of BMSCs incubated on each hydrogel surface for 7 and 14 days. Scale bar represents 500 μm. (b, c) Quantitative analysis of ALP staining for 7 and 14 days (n = 3). (d) The expression levels of osteogenic genes (ALP, Runx2, BMP2, OPN, OCN, and COL-I) of BMSCs cultured on different samples on day 7 (n = 3). (e) Immunofluorescent staining of osteogenesis-related protein Runx2 and OCN (red), cytoskeleton (green), and nuclei (blue) of BMSCs cultured on each hydrogel for 7 days. Scale bar represents 100 μm. (f, g) Quantitative analysis of fluorescence intensity of Runx2 and OCN (n = 3). (h) Western blot assay of Runx2 and OCN of BMSCs on day 7. (i, j) Quantitative analysis of protein band intensities (n = 3). ANOVA followed by Tukey’s post hoc test was performed for statistical analysis (*p < 0.05, **p < 0.01, ***p < 0.001)
Fig. 5
Fig. 5
In vivo new bone regeneration of rat critical-size calvarial defects in different groups. (a) Schematic illustration of the rat critical-size calvarial defects (d = 5 mm) surgical procedure and different treatments. (b, c) Optical photos of the implantation of the injectable GO and 0.1KBGO hydrogels into the 5 mm rat calvarial defects. (d) Micro-CT images showing cross-sectional bone regeneration in different groups at weeks 6 and 12 postoperatively. (e) Quantitative analysis of bone regeneration within ROI at weeks 6 and 12 (n = 3). ANOVA followed by Tukey’s post hoc test was performed for statistical analysis (*p < 0.05, **p < 0.01, ***p < 0.001)
Fig. 6
Fig. 6
Histological analysis of newly formed bone tissue at 6 weeks and 12 weeks after surgery. (a) H&E and MT staining of demineralized calvarial sections. Higher magnification images are taken from the areas enclosed by a square in the upper row. (b) Runx2 and OCN immunohistochemical staining of demineralized calvarial sections. Higher magnification images are taken from the areas enclosed by a square in the upper row. WB: woven bone, NB: newly formed bone. The white arrow represents newly formed bone marrow. Scale bars represent 1 mm (lower magnification) and 200 μm (higher magnification)
Fig. 7
Fig. 7
Transcriptome analysis of BMSCs gene expression in different groups. (a) PCA analysis of all data of GO, 0.1KBGO, and 0.1KBGO + US groups. (b) Pearson correlation coefficient heatmap of all samples. (c) Venn diagram of the number of differentially expressed genes among GO, 0.1KBGO, and 0.1KBGO + US groups. (d-f) Volcano analysis of differentially expressed genes of 0.1KBGO + US vs. GO, 0.1KBGO + US vs. 0.1KBGO, and 0.1KBGO vs. GO. (g-h) The top 20 significant up-enriched GO terms of 0.1KBGO + US vs. GO and 0.1KBGO + US vs. 0.1KBGO. (i-j) The top 20 significant up-enriched KEGG pathways of 0.1KBGO + US vs. GO and 0.1KBGO + US vs. 0.1KBGO. (k) Heatmap of the represented up-regulated genes in GO, 0.1KBGO, and 0.1KBGO + US. n = 3 biological replicates per group
Fig. 8
Fig. 8
Ultrasound-powered hydrogel facilitates BMSCs osteogenic differentiation by increasing Ca2+ influx and active PI3K/AKT and MEK/ERK pathways. (a) Detections of Vm in different groups. Scale bar represents 50 μm. (b) Quantitative analysis of immunofluorescence intensity of Vm (n = 3). (c) Immunofluorescent staining of intracellular Ca2+ (green) of BMSCs in GO, 0.1KBGO, and 0.1KBGO + US groups. Scale bar represents 100 μm. (d) Quantitative analysis of immunofluorescence intensity of intracellular Ca2+ (n = 3). (e) Immunofluorescent staining of intracellular Ca2+ (green) of BMSCs in GO, 0.1KBGO, and 0.1KBGO + US groups after Ca2+ influx inhibited by GdCl3. Scale bar represents 100 μm. (f) Quantitative analysis of immunofluorescence intensity of intracellular Ca2+ after Ca2+ influx inhibited by GdCl3 (n = 3). (g) Western blot assay of the phosphorylation levels of PI3K, AKT, MEK, and ERK in BMSCs in different groups. (h) Western blot assay of the phosphorylation levels of PI3K, AKT, MEK, and ERK and osteogenesis-related proteins Runx2 and OCN in BMSCs after Ca2+ influx inhibited by GdCl3. (i) Schematic illustration of the molecular mechanism of the ultrasound-powered hydrogel facilitating osteogenesis. ANOVA followed by Tukey’s post hoc test was performed for statistical analysis (*p < 0.05, **p < 0.01, ***p < 0.001)

References

    1. Johnson L, Igoe E, Kleftouris G, Papachristos I, Papakostidis C, Giannoudis P. Physical Health and psychological outcomes in adult patients with long-bone fracture non-unions: evidence today. J Clin Med. 2019;8:1998. doi: 10.3390/jcm8111998. - DOI - PMC - PubMed
    1. Li ZH, Liu JH, Li CZ, Wu MJ, Li YC, Cui Y, Xiong WQ, Yang F, Liu BY. Advances in the application of bone transport techniques in the treatment of bone Nonunion and Bone defects. Orthop Surg. 2023;15:3046–54. doi: 10.1111/os.13936. - DOI - PMC - PubMed
    1. Hu SS, Wang S, He QQ, Li DZ, Xin LJ, Xu CH, Zhu XY, Mei L, Cannon RD, Ji P, et al. A mechanically Reinforced Super Bone glue makes a Leap in Hard tissue strong adhesion and augmented bone regeneration. Adv Sci. 2023;10:2206450. doi: 10.1002/advs.202206450. - DOI - PMC - PubMed
    1. Laubach M, Suresh S, Herath B, Wille ML, Delbruck H, Alabdulrahman H, Hutmacher DW, Hildebrand F. Clinical translation of a patient-specific scaffold-guided bone regeneration concept in four cases with large long bone defects. J Orthop Transl. 2022;34:73–84. - PMC - PubMed
    1. Huang WJ, Cheng S, Wang XL, Zhang Y, Chen LY, Zhang LN. Noncompressible Hemostasis and Bone Regeneration Induced by an Absorbable Bioadhesive Self-Healing Hydrogel. Adv Funct Mater. 2021;31:2009189. doi: 10.1002/adfm.202009189. - DOI

LinkOut - more resources