

Effect of low oxygen stress on the metabolic responses of tomato fruit cells
- PMID: 38327398
- PMCID: PMC10847614
- DOI: 10.1016/j.heliyon.2024.e24566
Effect of low oxygen stress on the metabolic responses of tomato fruit cells
Abstract
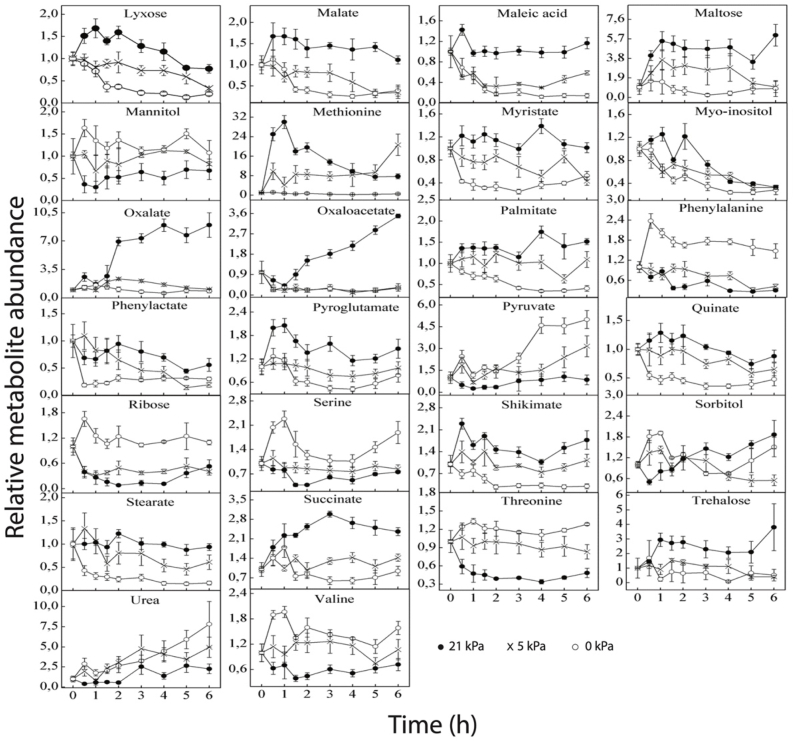
Postharvest losses of fruits and vegetables can occur due to cell breakdown and browning during controlled atmosphere storage as a result of low oxygen (O2) stress. Therefore, the study was designed to better understand the underlying mechanisms of the response of isolated tomato fruit cells incubated at low O2 (hypoxic and anoxic) conditions as a model system. The O2 stress conditions used for the experiment were based on the results of the Michaelis-Menten constant (Km) of respiration. A total of 56 polar metabolites belonging mainly to different functional groups, including amino acids, organic acids, sugars and sugar alcohols, were identified using GC-MS. O2 stress stimulated the biosynthesis of most of the free amino acids while decreasing the synthesis of most of the organic acids (especially those linked to the tricarboxylic acid cycle), sugars (except for ribose) and other nitrogen-containing compounds. The down-regulation of these TCA cycle metabolites served to provide energy to ensure the survival of the cell. Increases in the sugar alcohol levels and induction of fermentative metabolism were observed under low O2 stress. By employing multivariate statistics, metabolites were identified that were essential to the oxygen stress response and establishing the correlation between metabolite abundance, oxygen levels, and incubation period were achievable. A higher correlation was observed between the O2 levels and most of the metabolites.
Keywords: Anoxic stress; Cell culture; Hypoxic stress; Metabolomics; Tomato fruit.
© 2024 The Authors.
Conflict of interest statement
The authors declare the following financial interests/personal relationships which may be considered as potential competing interests:Md. Sultan Mahomud reports equipment, drugs, or supplies was provided by Laboratory of Mechatronics, Biostatistics and Sensors, KULeuven, Belgium.
Figures


References
-
- Ghosh U., Islam M., Siddiqui M., Cao X., Khan M. Proline, a multifaceted signalling molecule in plant responses to abiotic stress: understanding the physiological mechanisms. Plant Biol. 2022;24:227–239. - PubMed
-
- Noctor G., De Paepe R., Foyer C.H. Mitochondrial redox biology and homeostasis in plants. Trends Plant Sci. 2007;12:125–134. - PubMed
-
- Van Dongen J.T., Licausi F. Springer; 2016. Low-oxygen Stress in Plants.
-
- Sachs M., Vartapetian B. Plant anaerobic stress I. Metabolic adaptation to oxygen deficiency. Plant Stress. 2007;1:123–135.
LinkOut - more resources
Full Text Sources
Miscellaneous
