. 2024 Jan 26;27(2):109003.
doi: 10.1016/j.isci.2024.109003. eCollection 2024 Feb 16.

A single cell atlas of circulating immune cells involved in diabetic retinopathy

Affiliations

A single cell atlas of circulating immune cells involved in diabetic retinopathy

Dan Liao et al. iScience. .

Abstract

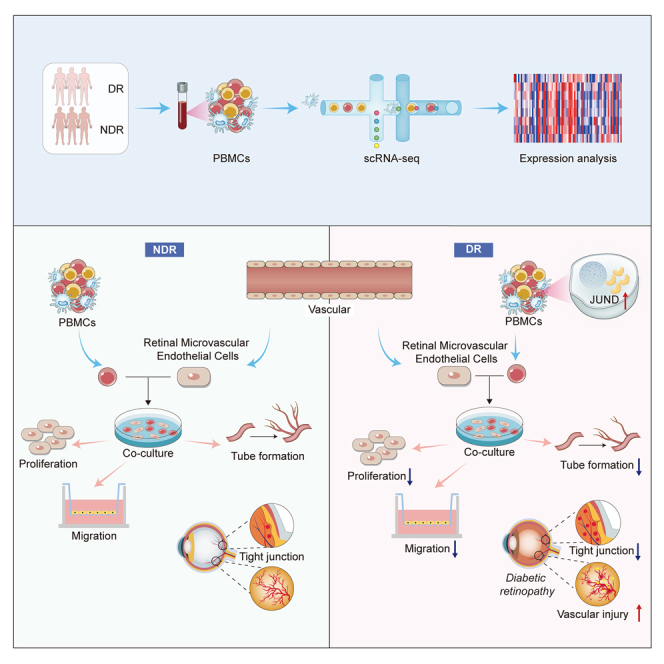
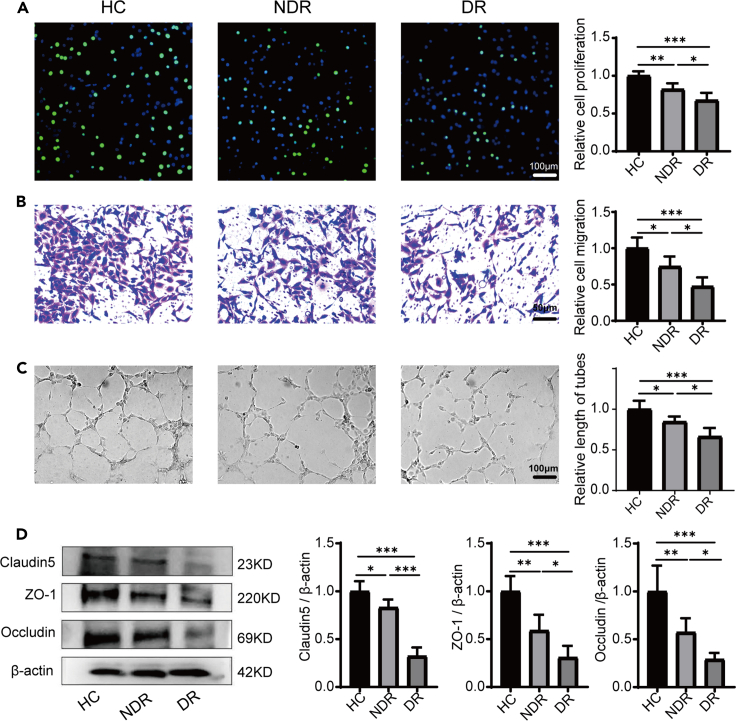
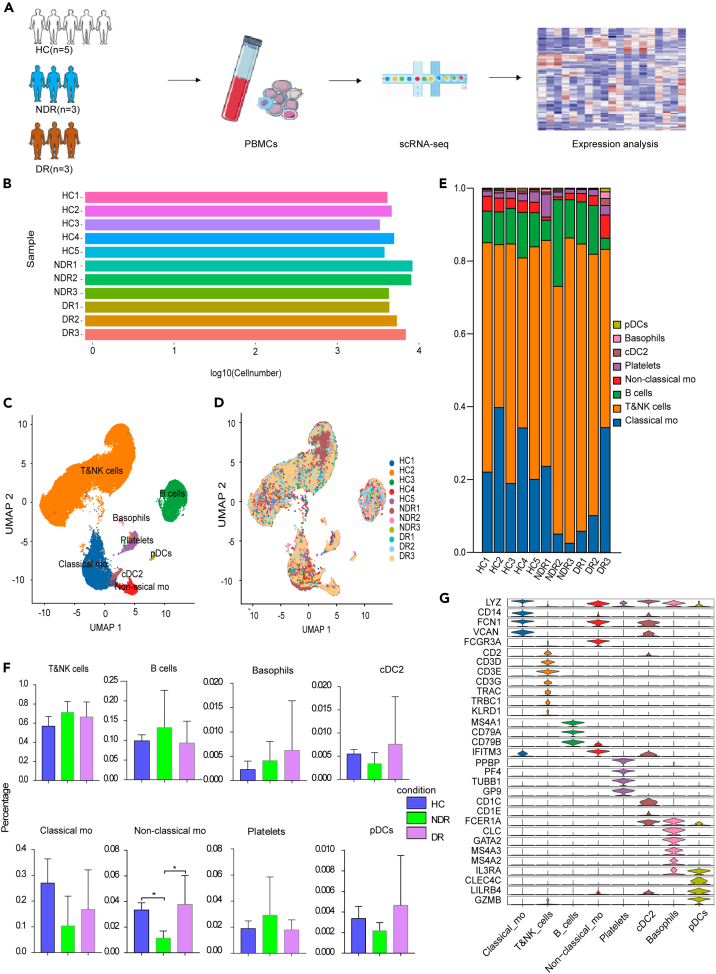
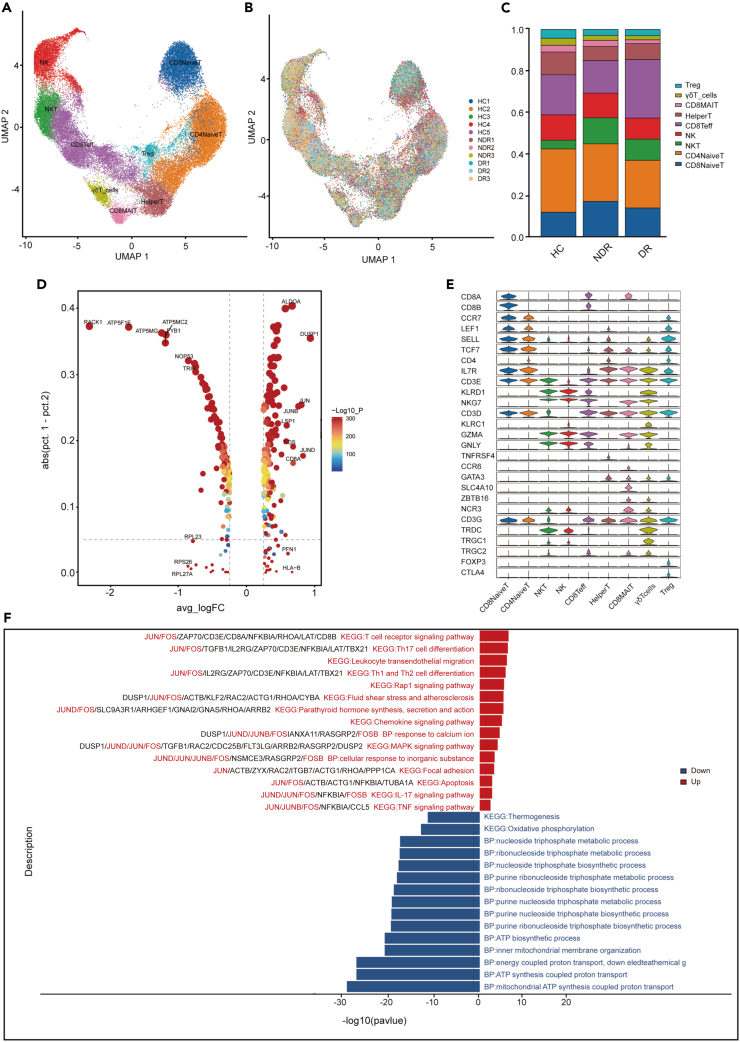
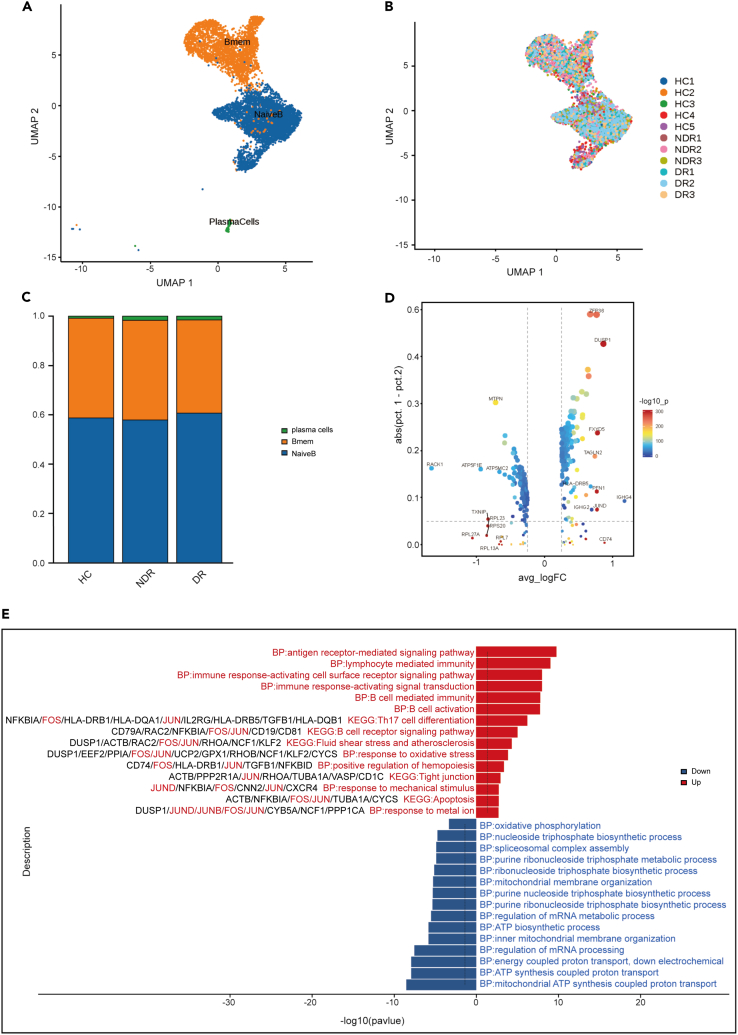
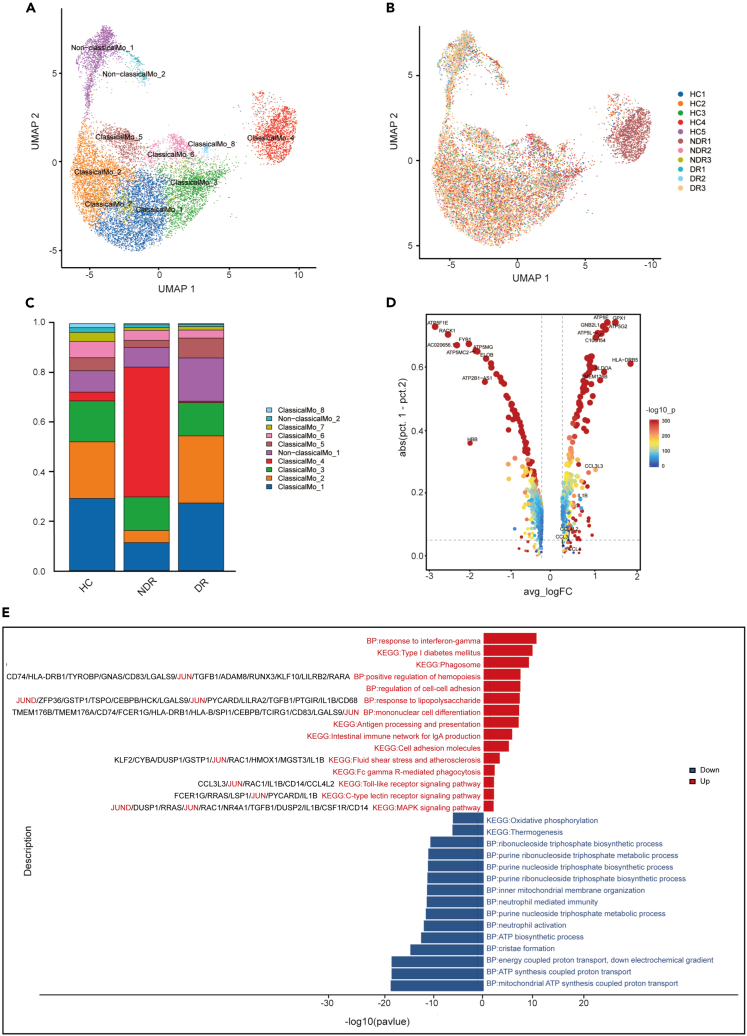
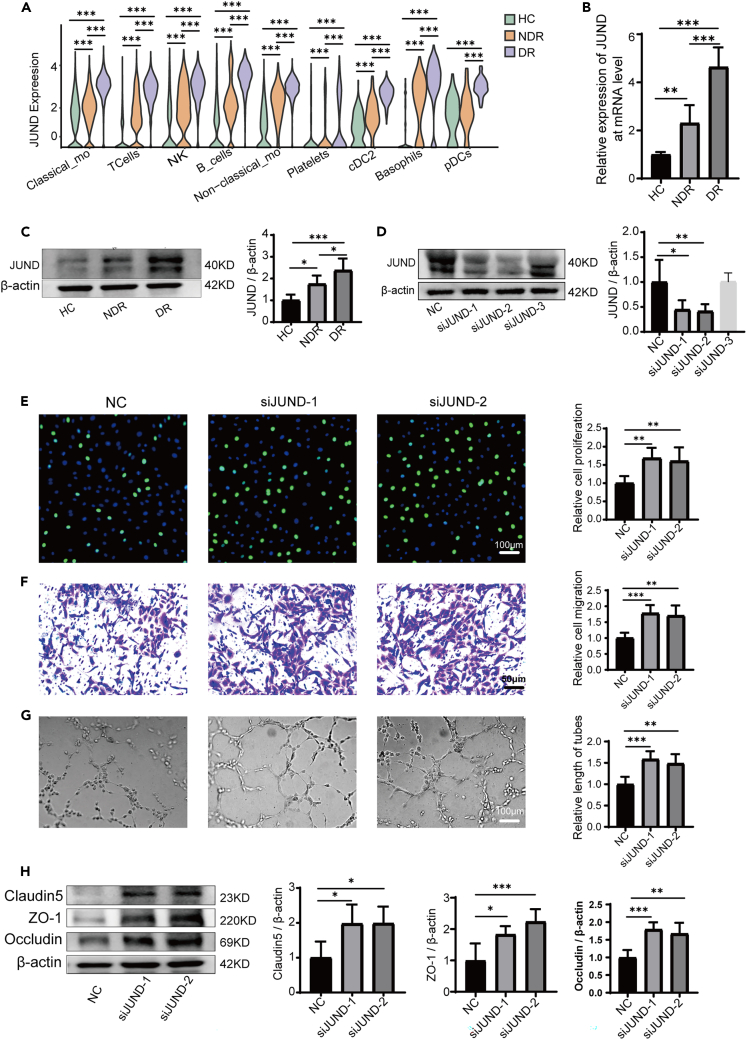
This study focused on examining the exact role of circulating immune cells in the development of diabetic retinopathy (DR). In vitro co-culture experiments showed that peripheral blood mononuclear cells (PBMCs) from patients with type 1 DR crucially modulated the biological functions of human retinal microvascular endothelial cells (HRMECs), consequently disrupting their normal functionality. Single-cell RNA sequencing (scRNA-seq) study revealed unique differentially expressed genes and pathways in circulating immune cells among healthy controls, non-diabetic retinopathy (NDR) patients, and DR patients. Of significance was the observed upregulation of JUND in each subset of PBMCs in patients with type 1 DR. Further studies showed that downregulating JUND in DR patient-derived PBMCs led to the amelioration of HRMEC dysfunction. These findings highlighted the notable alterations in the transcriptomic patterns of circulating immune cells in type 1 DR patients and underscored the significance of JUND as a key factor for PBMCs in participating in the pathogenesis of DR.

Keywords: Cell biology; Components of the immune system; Gene network; Transcriptomics.


Conflict of interest statement

The authors declare no competing interests.

Figures

None
Graphical abstract
Figure 1
Figure 1
Effects of PBMCs on the function of HRMECs in vitro (A) The proliferation of HRMECs tested by EdU (n = 8). (B) The migration of HRMECs detected by cell migration test (n = 8). (C) The tube forming ability of HRMECs detected by the tube formation test (n = 8). (D) The expression of claudin-5, ZO-1, and occludin in HRMECs of each group tested by western blot (n = 6). HC, healthy control. NDR, non-diabetic retinopathy. DR, diabetic retinopathy. Bars: 50 μm in (B) and 100 μm in (A and C). ∗p < 0.05, ∗∗p < 0.01, ∗∗∗p < 0.001.
Figure 2
Figure 2
Study design and single-cell transcription map of PBMCs from HCs, NDR, and DR patients (A) The schematic representation of experimental strategy in scRNA-seq. (B) Display of cell numbers of each sample. (C) The UMAP projection of 71,545 single cells colored by cell types, showing the formation of 9 clusters with the respective labels. (D) UMAP colored by sample. (E) Bar plot showing the overall cell composition of each sample, colored by cell types. (F) Comparison of the proportion of cell subsets between different groups. (G) Violin plot showing the relative expression of cell-type-specific markers in each cluster.
Figure 3
Figure 3
Single-cell analysis of T cells (A) UMAP of 9 clusters of T and NK cells, colored by cell types. (B) UMAP colored by sample. (C) Bar plot showing the composition of T and NK cells in each group. (D) Top 10 up- and downregulated genes in T cells of DR patients compared to NDR patients. (E) Violin plot showing the relative expression of cell-type-specific markers in each cluster. (F) Enrichment analysis of up- and downregulated DEGs in T cells of DR patients compared to NDR patients, sorted by -log10 (P) value.
Figure 4
Figure 4
Single-cell analysis of B cells (A) UMAP of 3 clusters of B cells, colored by cell types. (B) UMAP colored by sample. (C) Bar plot showing the composition of B cells in each group. (D) Top10 up- and downregulated genes in B cells of DR patients compared to NDR patients. (E) Enrichment analysis of up- and downregulated DEGs in B cells of DR patients compared to NDR patients, sorted by -log10 (P) value.
Figure 5
Figure 5
Single-cell analysis of monocytes (A) UMAP of 10 clusters of monocytes, colored by cell types. (B) UMAP colored by sample. (C) Bar plot showing the composition of monocytes in each group. (D) Up- and downregulated genes in monocytes of DR patients compared to NDR patients. (E) Enrichment analysis of up- and downregulated DEGs in monocytes of DR patients compared to NDR patients, sorted by -log10 (P) value.
Figure 6
Figure 6
JUND regulated PBMCs-mediated endothelial dysfunction (A) The expression of JUND was upregulated in each cell subset of PBMCs in DR patients via scRNA-seq. (B) JUND expression in different groups at the mRNA level tested by real-time qPCR (n = 6). (C) JUND expression in different groups at the protein level tested by western blot (n = 6). (D) The expressions of JUND protein were inhibited by JUND siRNAs in PBMCs. NC represents the non-specific siRNA transfection group. siJUND-1, siJUND-2, and siJUND-3 represent the first, second, and third JUND siRNA transfection groups, respectively. (E) The proliferation of HRMECs was enhanced after co-culture with transfected PBMCs (n = 6). (F) The migration of HRMECs was enhanced after co-culture with transfected PBMCs (n = 6). (G) The tube forming ability of HRMECs was enhanced after co-culture with transfected PBMCs (n = 6). (H) The expression of claudin-5, ZO-1, and occludin in HRMECs increased after co-culture with transfected PBMCs (n = 6). Bars: 50 μm in (F) and 100 μm in (E and G). ∗p < 0.05, ∗∗p < 0.01, ∗∗∗p < 0.001.

References

    1. Zhang X., Saaddine J.B., Chou C.F., Cotch M.F., Cheng Y.J., Geiss L.S., Gregg E.W., Albright A.L., Klein B.E.K., Klein R. Prevalence of diabetic retinopathy in the United States, 2005-2008. JAMA. 2010;304:649–656. doi: 10.1001/jama.2010.1111. - DOI - PMC - PubMed
    1. Wong T.Y., Cheung N., Tay W.T., Wang J.J., Aung T., Saw S.M., Lim S.C., Tai E.S., Mitchell P. Prevalence and risk factors for diabetic retinopathy: the Singapore Malay Eye Study. Ophthalmology. 2008;115:1869–1875. doi: 10.1016/j.ophtha.2008.05.014. - DOI - PubMed
    1. Jee D., Lee W.K., Kang S. Prevalence and risk factors for diabetic retinopathy: the Korea National Health and Nutrition Examination Survey 2008-2011. Invest. Ophthalmol. Vis. Sci. 2013;54:6827–6833. doi: 10.1167/iovs.13-12654. - DOI - PubMed
    1. Teo Z.L., Tham Y.C., Yu M., Chee M.L., Rim T.H., Cheung N., Bikbov M.M., Wang Y.X., Tang Y., Lu Y., et al. Global Prevalence of Diabetic Retinopathy and Projection of Burden through 2045: Systematic Review and Meta-analysis. Ophthalmology. 2021;128:1580–1591. doi: 10.1016/j.ophtha.2021.04.027. - DOI - PubMed
    1. Xu H., Chen M. Diabetic retinopathy and dysregulated innate immunity. Vision Res. 2017;139:39–46. doi: 10.1016/j.visres.2017.04.013. - DOI - PubMed