. 2024 Jan 22;32(1):101192.
doi: 10.1016/j.omtm.2024.101192. eCollection 2024 Mar 14.

Expanded specific T cells to hypomutated regions of the SARS-CoV-2 using mRNA electroporated antigen-presenting cells

Affiliations

Expanded specific T cells to hypomutated regions of the SARS-CoV-2 using mRNA electroporated antigen-presenting cells

Elizabeth Ogando-Rivas et al. Mol Ther Methods Clin Dev. .

Abstract

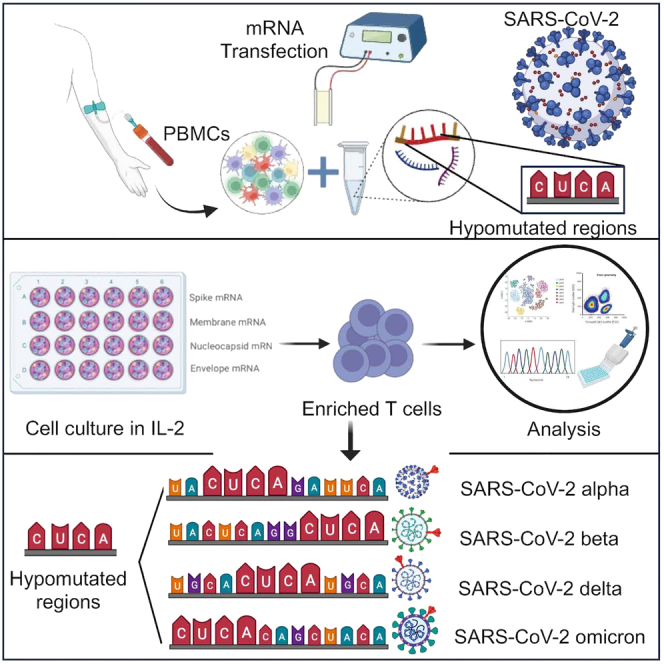
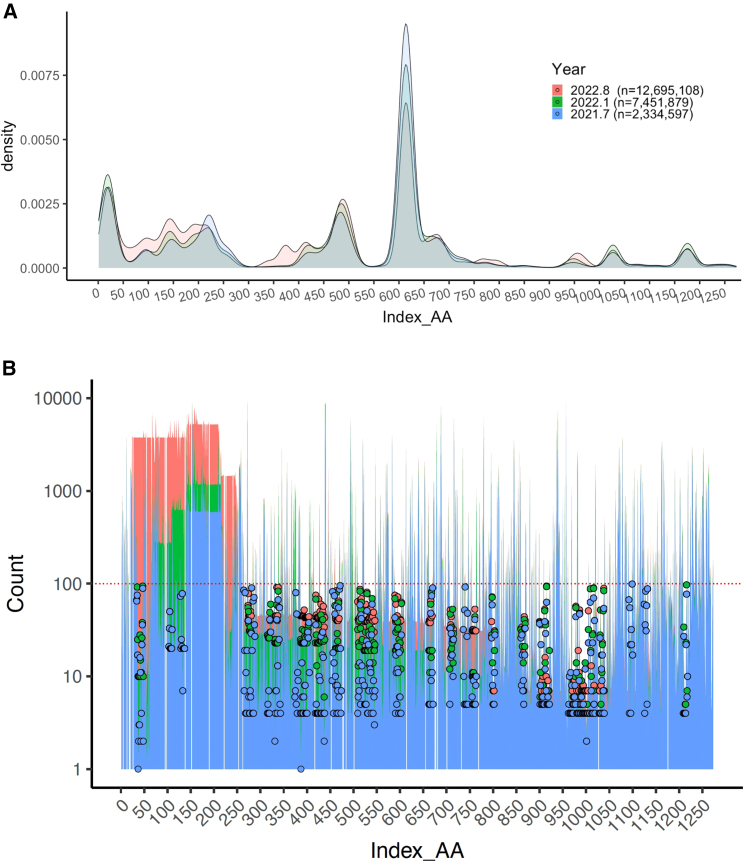
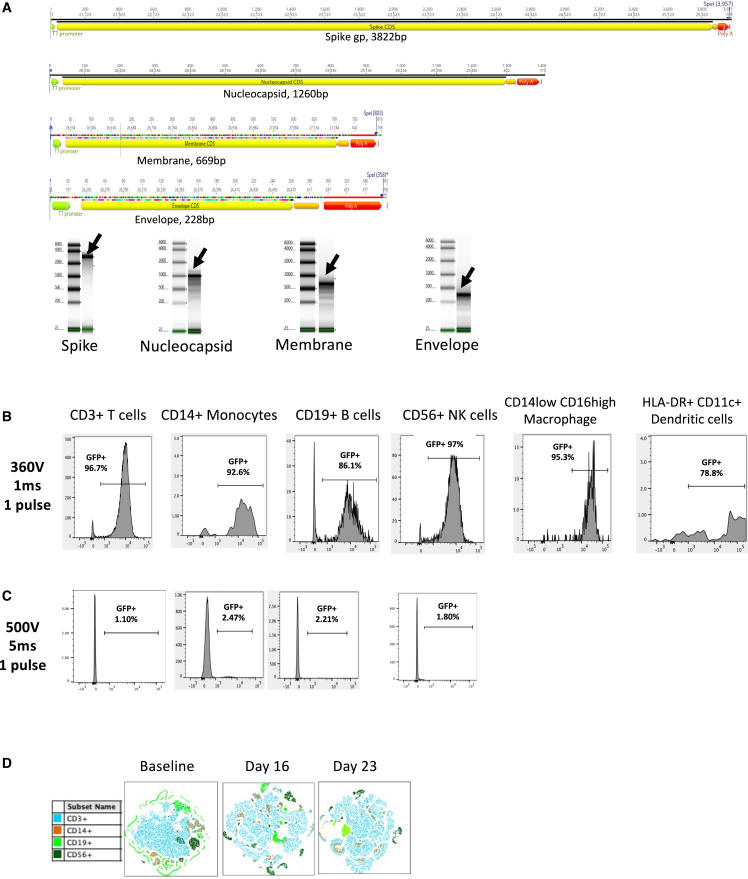
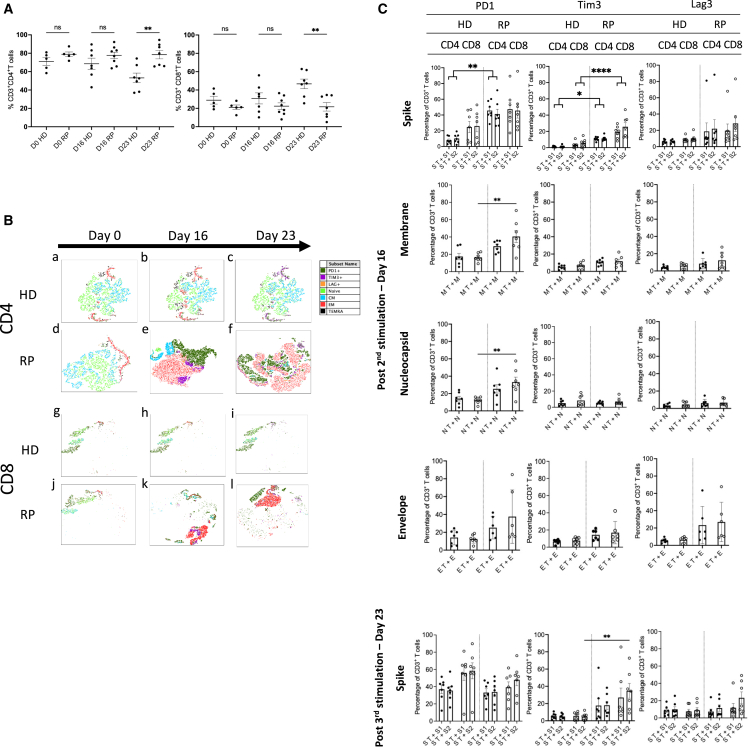
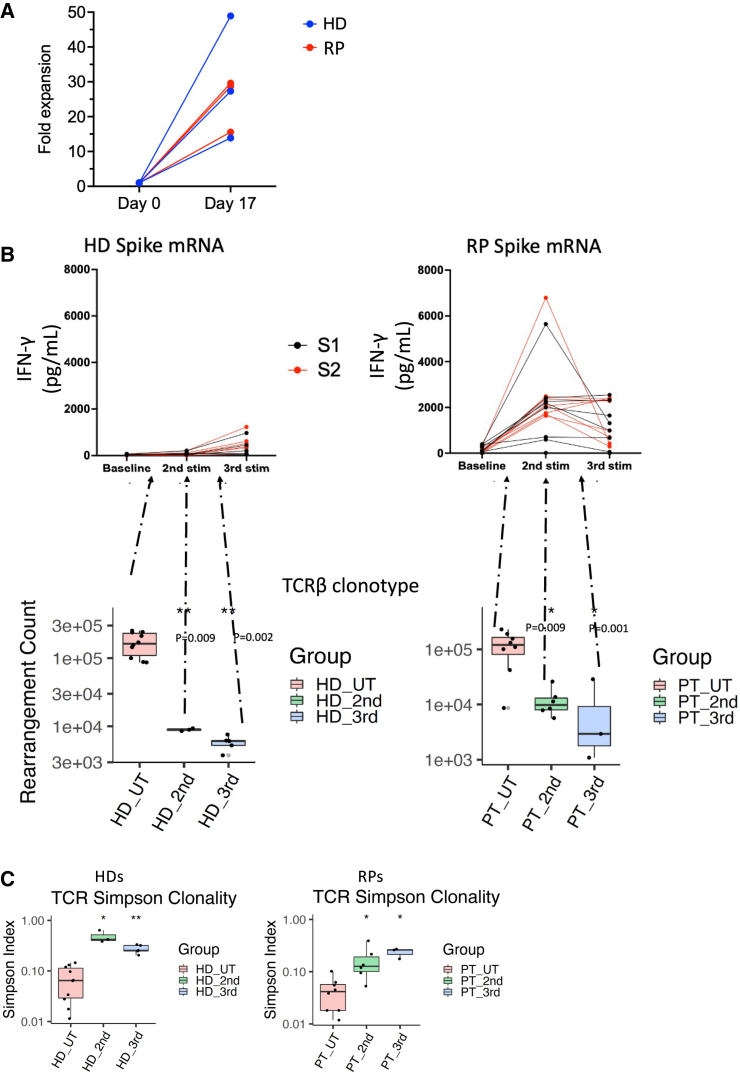
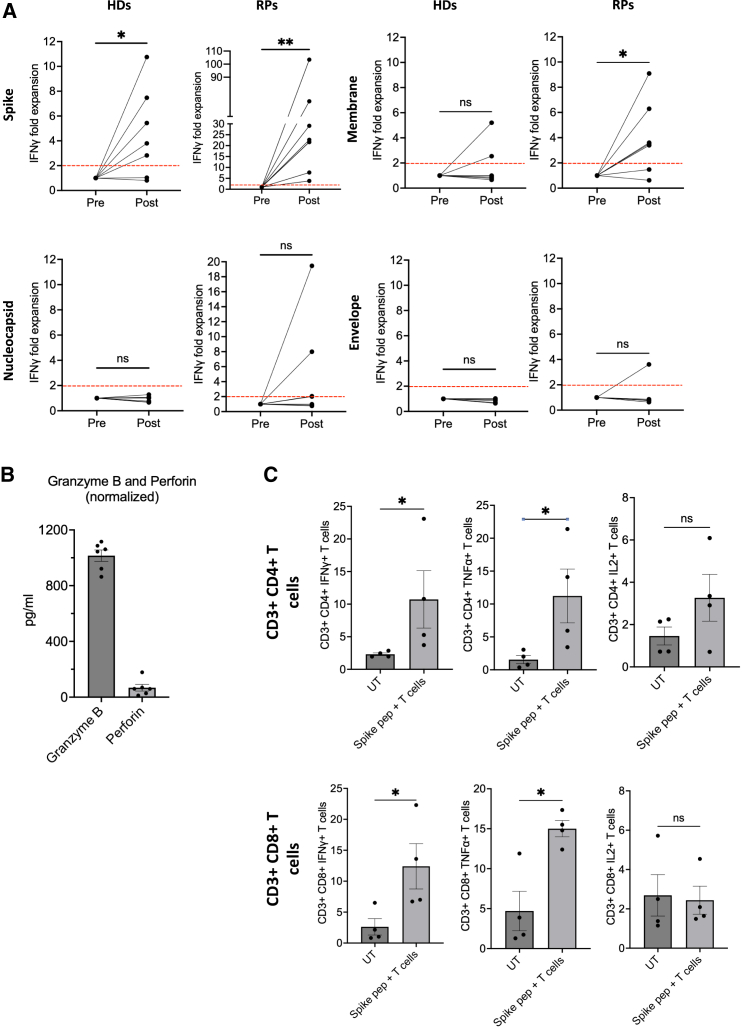
The COVID-19 pandemic has caused about seven million deaths worldwide. Preventative vaccines have been developed including Spike gp mRNA-based vaccines that provide protection to immunocompetent patients. However, patients with primary immunodeficiencies, patients with cancer, or hematopoietic stem cell transplant recipients are not able to mount robust immune responses against current vaccine approaches. We propose to target structural SARS-CoV-2 antigens (i.e., Spike gp, Membrane, Nucleocapsid, and Envelope) using circulating human antigen-presenting cells electroporated with full length SARS-CoV-2 structural protein-encoding mRNAs to activate and expand specific T cells. Based on the Th1-type cytokine and cytolytic enzyme secretion upon antigen rechallenge, we were able to generate SARS-CoV-2 specific T cells in up to 70% of unexposed unvaccinated healthy donors (HDs) after 3 subsequent stimulations and in 100% of recovered patients (RPs) after 2 stimulations. By means of SARS-CoV-2 specific TCRβ repertoire analysis, T cells specific to Spike gp-derived hypomutated regions were identified in HDs and RPs despite viral genomic evolution. Hence, we demonstrated that SARS-CoV-2 mRNA-loaded antigen-presenting cells are effective activating and expanding COVID19-specific T cells. This approach represents an alternative to patients who are not able to mount adaptive immune responses to current COVID-19 vaccines with potential protection across new variants that have conserved genetic regions.

Keywords: RNA-based immunotherapy; SARS-CoV-2; adoptive T cells; antigen-presenting cells; hypomutated regions.


Conflict of interest statement

The disclosures from D.A.M. are as follows: holds patented technologies that have been licensed or have exclusive options to license to Celldex Therapeutics, Annias, Immunomic Therapeutics, and iOncologi; receives research funding from Immunomic Therapeutics; he is also the cofounder of iOncologi, Inc., an immuno-oncology biotechnology company. The other authors have no conflicts of interest to disclose. E.O.R., V.T., F.P.G., C.Y., H.M.G, P.C, E.J.S, and D.A.M. have patents on mRNA technologies for COVID-19 and related to cellular therapy methods for viral vaccines.

Figures

None
Graphical abstract
Figure 1
Figure 1
Evolution of Spike protein genome since the beginning of the COVID-19 pandemic (A) density plot and (B) mutation count represent the mutational evolution of SARS-CoV-2 over 3 timepoints July 2021 (blue), January 2022 (green) and August 2022 (red). (A) Text boxes. represent the peaks of patient sample mutations corresponding to a different SARS-CoV-2 variant breakthrough. (B) Segmented red line represents the cut-off definition according to NCBI Virus by which at least 100 samples of different COVID-19 infected patients with the same mutation in the same position are considered single nucleotide variant (SNV). Thus, less than 100 samples with the same mutation in the same position at the amino acid level are defined as hypomutated regions in this study. Colored circles represent number of samples/patients with the same mutation that is below hypomutated region cut-off (segmented red line, <100 hits). Blue circles correspond to hypomutated regions for July 2021 period; green circles, hypomutated regions for January 2022; and red circles, conserved region for August 2022 time point.
Figure 2
Figure 2
Generation of SARS-CoV-2 mRNAs for transfection of peripheral blood mononuclear cells (A) represents plasmid constructs for Spike, Membrane, Nucleocapsid, and Envelope structural proteins and shows electrophoresis gels with RNA bands (black arrows) corresponding to Spike, Membrane, Nucleocapsid, and Envelope structural proteins. (B, and C) shows electroporation parameters and the type of cell subsets transduced. (D) Progression of cell subsets over the duration of cell culture for activation of antigen specific T cells.
Figure 3
Figure 3
TCRβ count specific SARS-CoV-2 structural antigens (A) TCRβs specific against SARS-CoV-2 antigens in healthy donors and recovered patients pre- and post-stimulation. (B) TCRβs specific to hypomutated regions pre- and post-stimulation. (C) Distribution of all TCRβs against SARSp-CoV-2 structural antigens (S, M, N, E) pre- and pos-stimulation in HDs. Distribution of Spike hypomutated region specific TCRβs pre- and post-stimulation in HDs. (D) Distribution of all TCRβs against SARSp-CoV-2 structural antigens (S, M, N, E) pre- and pos-stimulation in RPs. Distribution of Spike hypomutated region specific TCRβs pre- and post-stimulation in RPs.
Figure 4
Figure 4
Immunophenotypic characterization of SARS-CoV-2 specific T cells (A) CD3+CD4+ and CD3+CD8+ T cell distribution across HDs and RPs at baseline and over the course of cell culture. (B) tSNE representation of maturation stages (naive, central memory CM, effector memory EM, and TEMRA). (C) Checkpoint (PD1, Tim3, Lag3) immunophenotypic characterization across HDs and RPs and analysis across T cell subsets upon antigen challenge of activated T cells.
Figure 5
Figure 5
Characterization of functional specificity of SARS-CoV-2 expanded T cells (A) Cell proliferation after two stimulations for HDs (n = 3) and RPs (n = 3). (B) IFNγ release after 2nd and 3rd stimulations for T cells isolated from HDs and RPs in correlation with TCRβ count over time per MIRA and ImmunoCODE database (Adaptive Biotechnologies, WA). (C) TCRβ clonality for HDs and RPs over time after subsequent stimulations.
Figure 6
Figure 6
Cytotoxic profile of SARS-CoV-2 T cells (A) IFNγ fold expansion are shown from T cells stimulated with all 4 structural protein encoding mRNA (spike, membrane, nucleocapsid, envelope). Red dotted line represents the cut-off to define responders (refer to materials and methods for definition). “Pre” indicates controls (i.e., unstimulated T cells, T cell alone, and T cell plus actin peptides). “Post” indicates SARS-CoV-2 stimulated T cells rechallenged with cognate peptides. (B) Granzyme B and perforin levels of T cells after two stimulations. Values were normalized by subtracting background control conditions. (C) Intracellular cytokine levels (i.e., IFNγ, TNFα, and IL-2) compared with untreated T cells (T cells alone). (∗p < 0.05; ∗∗p < 0.001).

Similar articles

Cited by

  • RNA aggregates harness the danger response for potent cancer immunotherapy.
    Mendez-Gomez HR, DeVries A, Castillo P, von Roemeling C, Qdaisat S, Stover BD, Xie C, Weidert F, Zhao C, Moor R, Liu R, Soni D, Ogando-Rivas E, Chardon-Robles J, McGuiness J, Zhang D, Chung MC, Marconi C, Michel S, Barpujari A, Jobin GW, Thomas N, Ma X, Campaneria Y, Grippin A, Karachi A, Li D, Sahay B, Elliott L, Foster TP, Coleman KE, Milner RJ, Sawyer WG, Ligon JA, Simon E, Cleaver B, Wynne K, Hodik M, Molinaro AM, Guan J, Kellish P, Doty A, Lee JH, Massini T, Kresak JL, Huang J, Hwang EI, Kline C, Carrera-Justiz S, Rahman M, Gatica S, Mueller S, Prados M, Ghiaseddin AP, Silver NL, Mitchell DA, Sayour EJ. Mendez-Gomez HR, et al. Cell. 2024 May 9;187(10):2521-2535.e21. doi: 10.1016/j.cell.2024.04.003. Epub 2024 May 1. Cell. 2024. PMID: 38697107 Free PMC article.

References

    1. Johns Hopkins University; 2020. Center for Systems Science and Engineering (CSSE) at the.
    1. Nasserie T., Hittle M., Goodman S.N. Assessment of the Frequency and Variety of Persistent Symptoms Among Patients With COVID-19: A Systematic Review. JAMA Netw. Open. 2021;4 doi: 10.1001/jamanetworkopen.2021.11417. - DOI - PMC - PubMed
    1. Perlis R.H., Santillana M., Ognyanova K., Safarpour A., Lunz Trujillo K., Simonson M.D., Green J., Quintana A., Druckman J., Baum M.A., Lazer D. Prevalence and Correlates of Long COVID Symptoms Among US Adults. JAMA Netw. Open. 2022;5 doi: 10.1001/jamanetworkopen.2022.38804. - DOI - PMC - PubMed
    1. Astuti I., Ysrafil Severe Acute Respiratory Syndrome Coronavirus 2 (SARS-CoV-2): An overview of viral structure and host response. Diabetes Metab. Syndr. 2020;14:407–412. doi: 10.1016/j.dsx.2020.04.020. - DOI - PMC - PubMed
    1. JHU. https://coronavirus.jhu.edu/map.html

LinkOut - more resources