[Preprint]. 2024 May 24:2024.01.23.576837.
doi: 10.1101/2024.01.23.576837.

Intra-condensate demixing of TDP-43 inside stress granules generates pathological aggregates

Affiliations

Intra-condensate demixing of TDP-43 inside stress granules generates pathological aggregates

Xiao Yan et al. bioRxiv. .

Update in

  • Intra-condensate demixing of TDP-43 inside stress granules generates pathological aggregates.
    Yan X, Kuster D, Mohanty P, Nijssen J, Pombo-García K, Garcia Morato J, Rizuan A, Franzmann TM, Sergeeva A, Ly AM, Liu F, Passos PM, George L, Wang SH, Shenoy J, Danielson HL, Ozguney B, Honigmann A, Ayala YM, Fawzi NL, Dickson DW, Rossoll W, Mittal J, Alberti S, Hyman AA. Yan X, et al. Cell. 2025 Jul 24;188(15):4123-4140.e18. doi: 10.1016/j.cell.2025.04.039. Epub 2025 May 23. Cell. 2025. PMID: 40412392

Abstract

Cytosolic aggregation of the nuclear protein TDP-43 is associated with many neurodegenerative diseases, but the triggers for TDP-43 aggregation are still debated. Here, we demonstrate that TDP-43 aggregation requires a double event. One is up-concentration in stress granules beyond a threshold, and the other is oxidative stress. These two events collectively induce intra-condensate demixing, giving rise to a dynamic TDP-43 enriched phase within stress granules, which subsequently transitions into pathological aggregates. Mechanistically, intra-condensate demixing is triggered by local unfolding of the RRM1 domain for intermolecular disulfide bond formation and by increased hydrophobic patch interactions in the C-terminal domain. By engineering TDP-43 variants resistant to intra-condensate demixing, we successfully eliminate pathological TDP-43 aggregates in cells. We conclude that up-concentration inside condensates and simultaneous exposure to environmental stress could be a general pathway for protein aggregation, with intra-condensate demixing constituting a key intermediate step.

Keywords: ALS; TDP-43; intra-condensate demixing; multiphasic condensate; neurodegenerative diseases; phase separation; protein aggregation; stress granules.


Figures
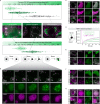
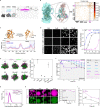
Figure 1.
Figure 1.. TDP-43 undergoes intra-condensate demixing inside stress granules and results in pathological aggregates
(A) Three different cellular phenotypes of TDP-43 in HeLa cells. The cytosolic concentration of TDP-43ΔNLS in low, medium and high expression cells was measured before stress (top), and TDP-43ΔNLS concentration inside mCherry-tagged G3BP1 stress granules was measured right before its intra-condensate demixing under stress with 100 μM arsenite (bottom). The cellular and nucleus boundaries are indicated by dashed lines (middle). Scale bar, 10 μm. (B) The time evolution of a representative stress granule with intra-condensate demixing of TDP-43ΔNLS in medium expression cells. Stress granules marked by squares under confocal fluorescence microscopy were zoomed in. Scale bar, 10 μm and 1 μm for confocal and zoomed in images, respectively. (C) Representative STED images of HeLa cells expressing TDP-43ΔNLS after addition of 100 μM arsenite from 30 min to 120 min. Stress granules marked by squares under confocal microscopy were further visualized by STED microscopy. Scale bar, 10 μm and 500 nm for confocal and STED images, respectively. (D) FRAP of TDP-43ΔNLS and mCherry-tagged G3BP1 in medium expression cells after addition of 100 μM arsenite over time. Data represent the mean ± SD. (E) HSPB1 recognition of TDP-43 aggregates upon intra-condensate demixing by STED. Cells expressing TDP-43ΔNLS were stressed with 100 μM arsenite and images were acquired before and after demixing. Scale bar, 10 μm and 500 nm for confocal and STED images, respectively. (F) Ubiquitination of TDP-43 aggregates upon intra-condensate demixing by STED. Cells expressing TDP-43ΔNLS were stressed with 100 μM arsenite and images were acquired before and after demixing. Scale bar, 10 μm and 500 nm for confocal and STED images, respectively. (G) mRNA-FISH assay in HeLa cells expressing TDP-43ΔNLS by STED. Cells expressing TDP-43ΔNLS were stressed with 100 μM arsenite. Atto647N-labeled oligo-dT oligonucleotides were used to stain poly(A)-containing mRNA. Images were acquired before and after demixing. Scale bar, 10 μm and 500 nm for confocal and STED images, respectively. See also Figure S1 and Videos S1–S3.
Figure 2.
Figure 2.. Intra-condensate demixing of TDP-43 promotes a liquid-to-solid phase transition in reconstituted stress granules
(A) TDP-43 recruitment into minimal stress granules. Recombinant G3BP1 (20 μM) and Poly(A) RNA (80 ng/μl) were incubated to form minimal stress granules. TDP-43 WT or ΔRRM1-2 (0.5 μM) was included as a client of stress granules. Scale bar for Figure 2, 10 μm. (B) Intra-condensate demixing of TDP-43 inside minimal stress granules. TDP-43 (10 μM) was added into minimal stress granules in the presence of 2.5% dextran. Pearson colocalization between G3BP1 and TDP-43 was analyzed by Coloc 2 plugin in Fiji, and 0.85 was set as an apparent demixing threshold. Data represent the mean ± SD. (C) TDP-43 concentrations in the mixed and demixed phases within minimal stress granules along the intra-condensate demixing process. The time point for demixing is indicated by the dash line. (D) Representative images of demixed TDP-43 puncta fusion. Puncta undergoing fusion are indicated by white arrowheads. (E) 3D reconstruction of minimal stress granules upon intra-condensate demixing of TDP-43 at 10 h. (F) FRAP of TDP-43 in the mixed and demixed phases inside minimal stress granules along the intra-condensate demixing process. Data represent the mean ± SD. (G) Increasing recognition of demixed TDP-43 by HSPB1 along the intra-condensate demixing process. Alexa 546-labeled HSPB1 (0.5 μM) was added into minimal stress granules and the ratio of fluorescent intensity between HSPB1 and TDP-43 was measured to show the increased stoichiometry and represented as mean ± SD. Representative images of HSPB1 and TDP-43 at 10 h are shown. See also Figure S2 and Video S4.
Figure 3.
Figure 3.. Oxidation is a prerequisite for intra-condensate demixing of TDP-43
(A) Oxidization on intra-condensation demixing of TDP-43 in HeLa cells assayed by STED. Cells expressing TDP-43ΔNLS were treated with 100 μM arsenite or 10 μg/ml puromycin for 120 min. Scale bar, 10 μm and 500 nm for confocal and STED images, respectively. (B) FRAP of TDP-43ΔNLS and G3BP1 in stress granules in HeLa cells after addition of 10 μg/ml puromycin for 180 min or 100 μM arsenite for 60 min. Data represent the mean ± SD. (C) Disulfide bond formation of TDP-43 in minimal stress granules. Stress granules with demixed TDP-43 at 10 h were dissolved with SDS-containing loading buffer and loaded onto SDS-PAGE in the absence or presence of β-ME. (D and E) Redox modifications governing intra-condensate demixing of TDP-43 in minimal stress granules. GSSG (1 mM), β-ME (10 mM), GSH (10 mM) or TCEP (10 mM) were used to treat the stress granules and representative images at 10 h are shown (D). The demixing kinetics, including the demixing time (tdemix) and correlation coefficient at 10 h (R10h), were quantified (E). Data represent the mean ± SD. Scale bar, 10 μm. See also Figure S3.
Figure 4.
Figure 4.. Hydrophobic patch interactions and disulfide bond formation constitute homotypic TDP-43 interactions that govern intra-condensate demixing
(A) Schematic of folded and disordered regions in TDP-43 (1–414 aa). NTD, N-terminal domain (1–80 aa); RRM1 and RRM2, RNA recognition motif 1 (106–176 aa) and 2 (191–262 aa); CTD, C-terminal domain (263–414 aa); G, glycine-rich (274–314 aa); HP, hydrophobic patch region (318–343 aa); Q/N, Q and N-rich (344–365 aa); S, serine-rich (370–402 aa). Point mutations studied in the following sections are also shown here. (B) Representative snapshot from an atomistic MD simulation (3 µs) of a full-length TDP-43 condensate composed of 25 chains using a slab-geometry setup (left), close-up of two interacting TDP-43 chains within the condensate (middle) and the corresponding two-dimensional, intermolecular contact map showing pairwise, residue-level interactions (right). In the contact map, contact propensity for a specific residue refers to the average number of contacts (ij>) per frame of the trajectory summated over the pairwise contributions of all TDP-43 chains and normalized by the total number of chains (n=25). (C) Structures of folded (PDB: 4IUF) and partially unfolded RRM1 domain in simulation of the TDP-43 condensed phase (top), and comparison between per-residue root-mean-square fluctuation (RMSF) for RRM1 in the dilute and condensed phases (bottom). The RRM1 domains are shown in ribbon representation with cysteine residues (173/175) shown as sticks. RMSF analysis for each residue, which is used to quantify the local flexibility of proteins, was computed over three independent trajectories for the monomer in the dilute phase (4.5 μs each) and over 25 chains in the condensed phase (2.5 μs each), respectively. Data represent the mean ± SD. (D) The HP interactions and disulfide bond formation favor TDP-43 condensation. Phase separation of TDP-43 WT or ΔHP with titrated concentrations in the absence or presence of GSSG (5 mM) are shown. Relative droplet fraction of TDP-43 versus the total protein concentration is quantified and shown as mean ± SD. Scale bar, 10 μm. (E) Cross-section of TDP-43/G3BP1 droplet snapshots (left) and protein concentration ratio (CG3BP1/CTDP-43) at the droplet center obtained from the simulations (right). The droplets comprised of an equal number of TDP-43 and G3BP1 chains (25 each). Simulation was computed over 5 blocks of 1–1.1 µs duration after excluding the initial 2 μs as equilibration. A ratio of 1 corresponds to a well-mixed droplet while values approaching 0 indicate strong demixing. Data represent the mean ± SEM. (F) Intra-condensate demixing of TDP-43 variants (10 μM) in minimal stress granules. Pearson colocalization between G3BP1 and TDP-43 was analyzed and the demixing time (tdemix) is shown. Data represent the mean ± SD. (G) DLS assay for TDP-43 HPmt5. The mutated residues are shown based on the cryo-EM structure of the TDP-43 amyloid cross-β core (PDB: 6n37). HPmt5 (80 μM) was incubated in 500 mM KCl. At the time indicated, samples (5 μM) were assayed by DLS. Data represented as the mean ± SD. (H) Intra-condensate demixing of TDP-43 HPmt5 in minimal stress granules. HPmt5 (10 μM) was added into minimal stress granules. Pearson colocalization between G3BP1 and TDP-43 was analyzed. Data represent the mean ± SD. Scale bar, 10 μm. (I) FRAP assay for mobile fractions of TDP-43 WT and HPmt5 within the demixed phase along intra-condensate demixing in minimal stress granules. Data represent the mean ± SD. See also Figure S4.
Figure 5.
Figure 5.. Oxidation-resistant TDP-43 variants with lowered self-assembly propensity abrogate pathological demixing in vivo
(A) Pearson colocalization between G3BP1 and TDP-43ΔNLS variants under 100 μM arsenite stress for 120 min. (B) Representative STED images of HeLa cells expressing TDP-43ΔNLS variants after addition of 100 μM arsenite for 120 min. Stress granules marked by squares under confocal microscopy were further visualized by STED microscopy. Scale bar, 10 μm and 500 nm for confocal and STED images, respectively. (C and D) Prevention of intra-condensate demixing of TDP-43 abolishing the formation of pathological aggregates. Cells expressing TDP-43ΔNLS variants were stressed with 100 μM arsenite for 120 min and images were acquired for HSPB1 (C) and ubiquitin (D) by confocal microscopy. Stress granules marked by squares were zoomed in. Scale bar, 10 μm and 5 μm for confocal and zoomed in images, respectively. (E) Quantification of dissolution of TDP-43ΔNLS aggregates. HeLa cells expressing TDP-43ΔNLS variants were stressed with 100 μM arsenite for 60 min following 120 min recovery. The demixed TDP-43ΔNLS aggregates were monitored in cells capable of dissolving stress granules, and data were presented as the fraction of these cells able to dissolve TDP-43ΔNLS aggregates. Data represent the mean ± SD. (F) Live imaging of cells expressing TDP-43ΔNLS variants during stress with 100 μM arsenite for 60 min and recovery for 120 min. Stress granules marked by squares were zoomed in. Scale bar, 10 μm and 1 μm for fluorescent and zoomed in images, respectively. See also Figure S5, Videos S5 and S6.
Figure 6.
Figure 6.. Intra-condensate demixing results in pathological aggregates in motor neurons, accompanied by impairment of nucleocytoplasmic transport
(A) Representative images of intra-condensate demixing of TDP-43ΔNLS in iPS-MN. The cells were cotransfected with GFP-tagged TDP-43ΔNLS and mCherry-tagged G3BP1 and live-cell imaging was performed after addition of 100 μM arsenite. Scale bar, 10 μm and 5 μm for whole-cell and zoomed in images, respectively. (B) Oxidization on intra-condensation demixing of TDP-43 in iPS-MN cells. Motor neurons expressing TDP-43ΔNLS were treated with 10 μg/ml puromycin or 100 μM arsenite for 60 min. Normalized fluorescent intensities for TDP-43 and stress granules along the straight line are shown. Scale bar, 10 μm and 2 μm for confocal and zoomed in images, respectively. (C) FRAP of TDP-43ΔNLS in stress granules in iPS-MN cells after addition of 100 μM arsenite or 10 μg/ml puromycin for 60 min. Data represent the mean ± SD. (D) TDP-43 demixing generating pathological aggregates. Motor neurons expressing TDP-43ΔNLS were stressed with 100 μM arsenite for 90 min, and images were acquired for HSPB1 or ubiquitin staining by confocal microscopy. Normalized fluorescent intensities for each channel along the straight line are shown. Scale bar, 2 μm. (E) TDP-43 aggregation impairing nucleocytoplasmic transport in iPS-MN. Motor neurons expressing TDP-43ΔNLS alone or TDP-43ΔNLS together with TDP-43-myc with intact NLS were stressed with 100 μM arsenite for 90 min, and images were acquired for importin-α or TDP-43-myc staining by confocal microscopy. Normalized fluorescent intensities for each channel along the straight line are shown. Scale bar, 2 μm. See also Video S7.
Figure 7.
Figure 7.. Model of intra-condensate demixing of TDP-43 inside stress granules generating pathological aggregates
The intra-condensate demixing of TDP-43 inside stress granules generating pathological aggregates at different scales, from cells to condensates to molecular basis, is shown schematically. Intra-condensate demixing of TDP-43 occurs by up-concentration inside stress granules under oxidation (step 3a). The demixed but dynamic TDP-43 phase facilitates a liquid-to-solid transition into pathological aggregates (steps 3b and 4a). See Discussion for details.

References

    1. Iqbal K., Liu F., Gong C.-X., and Grundke-Iqbal I. (2010). Tau in Alzheimer disease and related tauopathies. Curr. Alzheimer Res. 7, 656–664. 10.2174/156720510793611592. - DOI - PMC - PubMed
    1. Bartels T., Choi J.G., and Selkoe D.J. (2011). α-Synuclein occurs physiologically as a helically folded tetramer that resists aggregation. Nature 477, 107–110. 10.1038/nature10324. - DOI - PMC - PubMed
    1. Ciryam P., Tartaglia G.G., Morimoto R.I., Dobson C.M., and Vendruscolo M. (2013). Widespread aggregation and neurodegenerative diseases are associated with supersaturated proteins. Cell Rep. 5, 781–790. 10.1016/j.celrep.2013.09.043. - DOI - PMC - PubMed
    1. Cosacak M.I., Bhattarai P., Bocova L., Dzewas T., Mashkaryan V., Papadimitriou C., Brandt K., Hollak H., Antos C.L., and Kizil C. (2017). Human TAUP301L overexpression results in TAU hyperphosphorylation without neurofibrillary tangles in adult zebrafish brain. Sci. Rep. 7, 12959. 10.1038/s41598-017-13311-5. - DOI - PMC - PubMed
    1. Guo J.L., Buist A., Soares A., Callaerts K., Calafate S., Stevenaert F., Daniels J.P., Zoll B.E., Crowe A., Brunden K.R., et al. (2016). The Dynamics and Turnover of Tau Aggregates in Cultured Cells: INSIGHTS INTO THERAPIES FOR TAUOPATHIES. J. Biol. Chem. 291, 13175–13193. 10.1074/jbc.M115.712083. - DOI - PMC - PubMed

Publication types