[Preprint]. 2024 Jan 24:2024.01.22.576735.
doi: 10.1101/2024.01.22.576735.

An optimized live imaging and growth analysis approach for Arabidopsis Sepals

Affiliations

An optimized live imaging and growth analysis approach for Arabidopsis Sepals

Avilash Singh Yadav et al. bioRxiv. .

Update in

Abstract

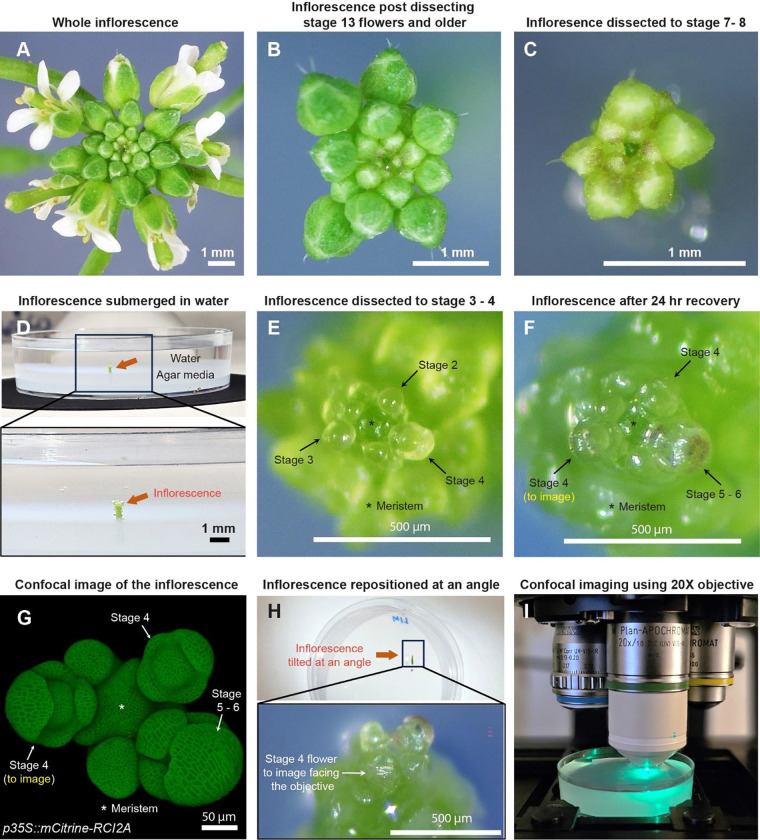
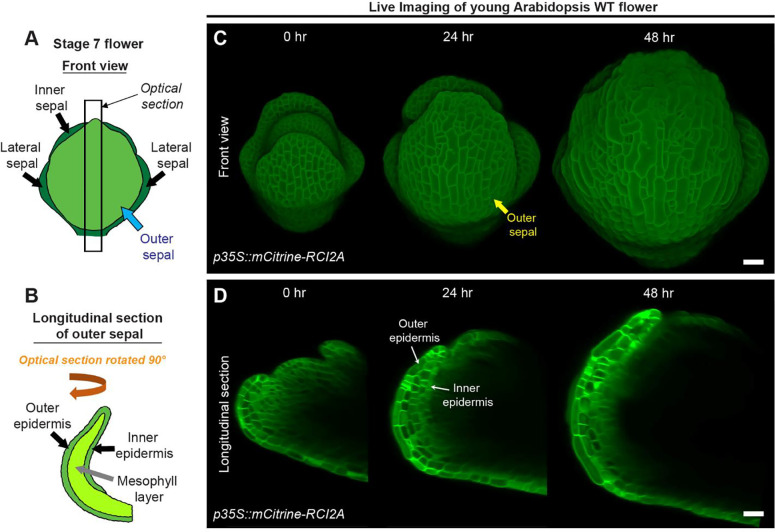
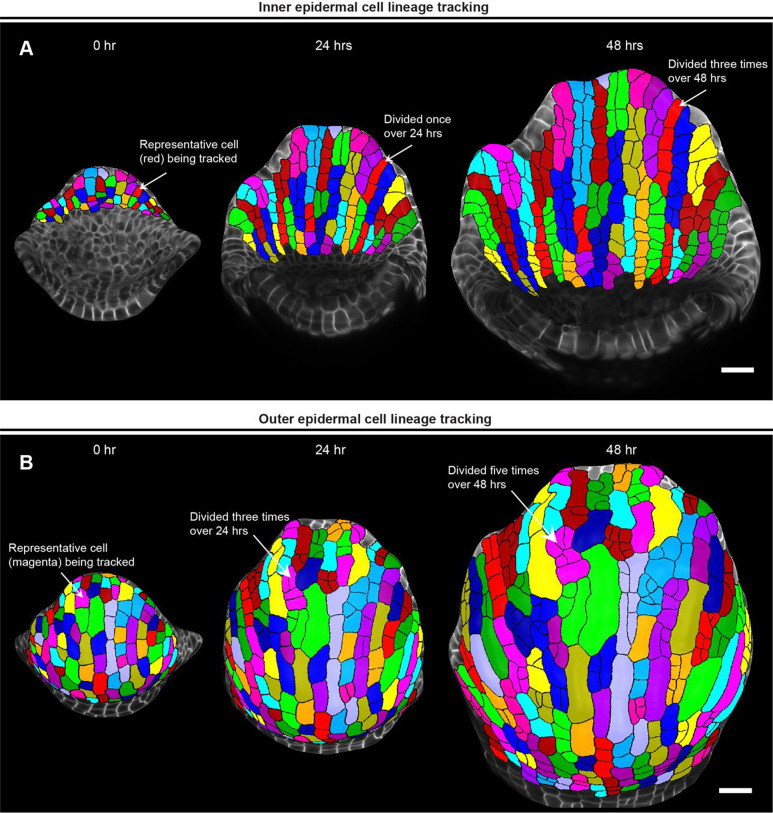
Background: Arabidopsis thaliana sepals are excellent models for analyzing growth of entire organs due to their relatively small size, which can be captured at a cellular resolution under a confocal microscope [1]. To investigate how growth of different tissue layers generates unique organ morphologies, it is necessary to live-image deep into the tissue. However, imaging deep cell layers of the sepal is practically challenging, as it is hindered by the presence of extracellular air spaces between mesophyll cells, among other factors which causes optical aberrations. Image processing is also difficult due to the low signal-to-noise ratio of the deeper tissue layers, an issue mainly associated with live imaging datasets. Addressing some of these challenges, we provide an optimized methodology for live imaging sepals and subsequent image processing. This helps us track the growth of individual cells on the outer and inner epidermal layers, which are the key drivers of sepal morphogenesis.

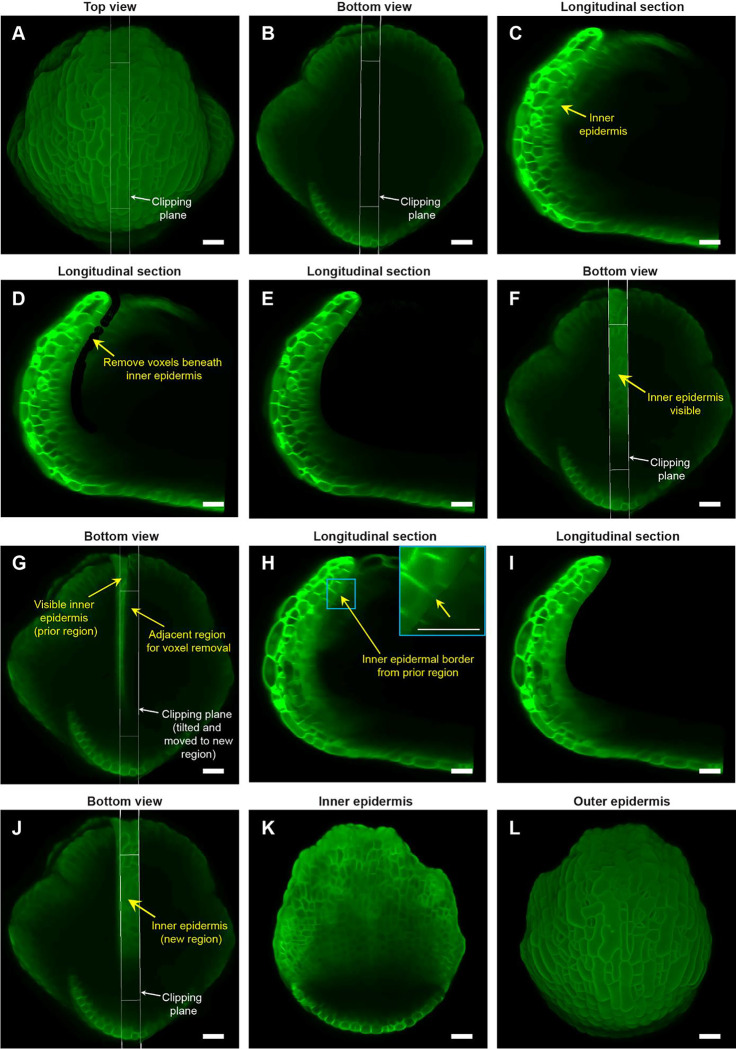
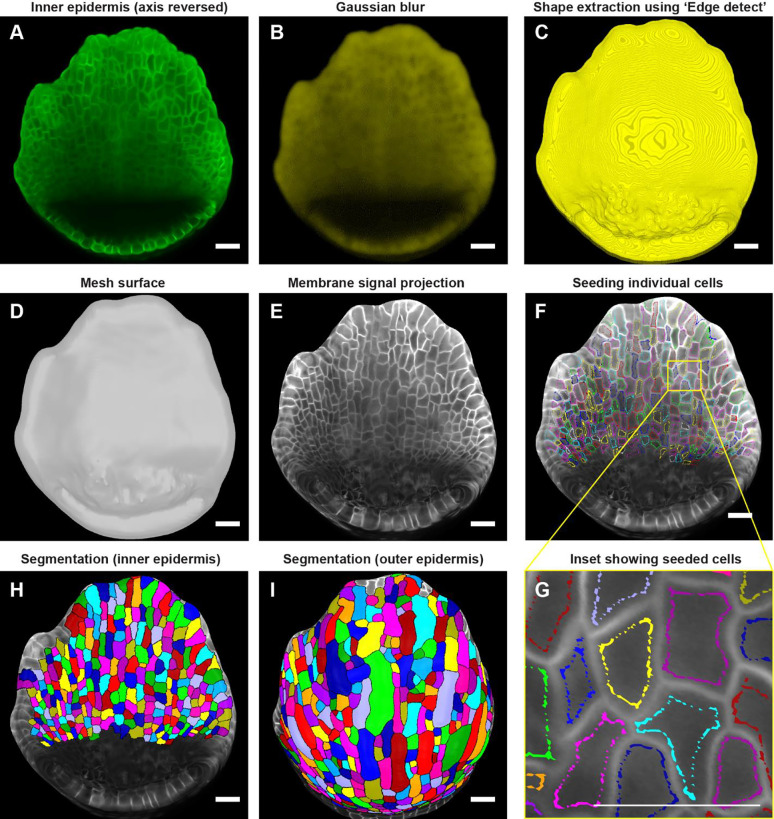
Results: For live imaging sepals across all tissue layers at early stages of development, we found that the use of a bright fluorescent membrane marker, coupled with increased laser intensity and an enhanced Z- resolution produces high-quality images suitable for downstream image processing. Our optimized parameters allowed us to image the bottommost cell layer of the sepal (inner epidermal layer) without compromising viability. We used a 'voxel removal' technique to visualize the inner epidermal layer in MorphoGraphX [2, 3] image processing software. Finally, we describe the process of optimizing the parameters for creating a 2.5D mesh surface for the inner epidermis. This allowed segmentation and parent tracking of individual cells through multiple time points, despite the weak signal of the inner epidermal cells.

Conclusion: We provide a robust pipeline for imaging and analyzing growth across inner and outer epidermal layers during early sepal development. Our approach can potentially be employed for analyzing growth of other internal cell layers of the sepals as well. For each of the steps, approaches, and parameters we used, we have provided in-depth explanations to help researchers understand the rationale and replicate our pipeline.


Figures

Fig. 1:
Fig. 1:. Sample preparation for live imaging sepals.
A Whole inflorescence image of Arabidopsis thaliana Ler-0 ecotype harboring pLH13 (p35S::mCitrine-RCI2A) membrane marker. B Same inflorescence after dissecting flowers that are stage 13 (flower buds open with visible petals) or older. Staging performed in accordance with Smyth et. al [14]. C Inflorescence dissected down to flowers of stages 8 or below. Below this stage, it’s preferable to perform the dissection in water. D Inflorescence (from Panel C, red arrow) set in agar media containing petri plate is submerged in water for rehydration. E Inflorescence dissected down to flowers of stage 4 or below in water. Flowers of stages 2, 3, and 4 are indicated by arrows, with the meristem marked by an asterisk (*). F Inflorescence post recovery for 24 hours in growth chamber. Note the progression of flowers through the developmental stages. The stage 4 flower to be imaged is shown. G Confocal image of the inflorescence (panel F) under 20X magnification. H The inflorescence (panel F, G) is angled such the stage 4 flower faces the objective for imaging. I The flower being imaged under confocal microscope under 20X objective using 514 nm excitation laser.
Fig. 2:
Fig. 2:. Live imaging of growing sepals.
A Schematic diagram representing a typical stage 7 flower. The four sepals comprise an outer sepal (blue arrow) shown in light green, one inner sepal and two lateral sepals (black arrows) shown in dark green. B The schematic illustrates the optical longitudinal section of the outer sepal from the region marked by the black rectangle (panel A). The outer, inner epidermal layers (black arrows) in green and the mesophyll layer (grey arrow) in lime color are shown. C Confocal live imaging of a growing Arabidopsis flower imaged every 24 hours over a course of 48 hours with a high laser intensity for 514 nm wavelength on an argon laser at 20X magnification. The flower harbors pLH13 (p35S::mCitrine-RCI2A) membrane marker. The yellow arrow points to the outer sepal. Scale bar, 20 μm. D Longitudinal optical sections of growing flower (panel C) are shown. Note the reducing visibility of the inner layers over time. The inner and outer epidermal layers are marked (white arrows). This image series is one of the three replicates used for growth analysis in our previous study [9]. Scale bar, 20 μm.
Fig. 3:
Fig. 3:. Image processing steps to expose the inner (adaxial) epidermis of the sepal.
A Top view of the stage 7 flower imaged at the 48-hour time point of live imaging, with the longitudinal clipping plane (white rectangular box) through the center of the outer sepal blade. B Bottom view of the flower (panel A) with the longitudinal clipping plane positioned through the same region. C Longitudinal section of the flower within the clipping plane region. The inner epidermis is marked (yellow arrow). D Floral meristem voxels beneath the inner epidermis are removed using the voxel edit tool in MorphoGraphX [2] image processing software. E Longitudinal optical section post removal of all voxels beneath the inner epidermis within the clipping plane region. F Bottom view of the flower post voxel removal. Note the visibility of the inner epidermis compared to surrounding regions. G Clipping plane tilted and moved to the adjacent region on the right with some overlap with the previously edited region (panels C-E). H Longitudinal section displays the inner epidermal border (yellow arrow; also see inset) created by voxel removal in the previously edited region, serving as a guide for voxel removal in the adjacent region. I Longitudinal section post voxel removal in the adjacent region. J Bottom view of the flower post voxel removal of the adjacent floral meristem region. K Complete view of the inner epidermis of the sepal, exposed after voxel removal. L Outer epidermis of the sepal. Scale bars (panel A – L) represent 20 μm.
Fig. 4:
Fig. 4:. Downstream image processing for cell segmentation.
A MorphoGraphX [2] processed image of the inner epidermis after reversing the axis along the Z direction. B Inner epidermal image stack post running Gaussian Blur filter. C Extraction of the global shape of the inner epidermis using MorphoGraphX [2] process “Edge detect”. D Mesh surface generated using “Marching Cubes Surface” followed by smoothing and subdividing the mesh. E Plasma membrane marker signal projected onto the mesh. F Cells seeded (labeled) throughout the inner epidermis. Colors represent individual labels. G Inset (panel F) demonstrates how the cell label follows the cell shape. Note that the labeling close to the cell boundary is essential for accurate segmentation especially when the membrane signal is weak. Scale bar, 2 μm. H-I Watershed segmentation of H Inner epidermal cells and I Outer epidermal cells. Scale bars across panels A-I represent 20 μm.
Fig. 5:
Fig. 5:. Parent tracking to quantify cell growth properties.
A MorphoGraphX [2] generated meshes of growing inner epidermis showing segmented cells parent tracked over 48 hours. The arrow shows a representative cell (red) that divided once to generate two daughter cells in 24 hours, and thrice to generate four daughter cells in 48 hours. Scale bar, 20 μm. B Meshes showing segmented cells of the outer epidermis parent tracked over 48 hours. The arrow points to a representative cell (magenta) that has divided thrice times over 24 hours and an additional two times over 48 hours. Note the development of meristemoid cell in this lineage, which will eventually differentiate into a stoma. Scale bar, 20 μm.

Similar articles

References

    1. Roeder A.H.K., Arabidopsis sepals: A model system for the emergent process of morphogenesis. Quantitative Plant Biology, 2021. 2: p. e14. - PMC - PubMed
    1. Strauss S., et al., Using positional information to provide context for biological image analysis with MorphoGraphX 2.0. eLife, 2022. 11: p. e72601. - PMC - PubMed
    1. Barbier de Reuille P., et al., MorphoGraphX: A platform for quantifying morphogenesis in 4D. eLife, 2015. 4: p. e05864. - PMC - PubMed
    1. Richman D.P., et al., Mechanical model of brain convolutional development. Science, 1975. 189(4196): p. 18–21. - PubMed
    1. Varner V.D., et al., Mechanically patterning the embryonic airway epithelium. Proceedings of the National Academy of Sciences, 2015. 112(30): p. 9230–9235. - PMC - PubMed

Publication types