[Preprint]. 2025 Feb 19:2024.01.18.576317.
doi: 10.1101/2024.01.18.576317.

CHOIR improves significance-based detection of cell types and states from single-cell data

Affiliations

CHOIR improves significance-based detection of cell types and states from single-cell data

Cathrine Sant et al. bioRxiv. .

Update in

Abstract

Clustering is a critical step in the analysis of single-cell data, as it enables the discovery and characterization of putative cell types and states. However, most popular clustering tools do not subject clustering results to statistical inference testing, leading to risks of overclustering or underclustering data and often resulting in ineffective identification of cell types with widely differing prevalence. To address these challenges, we present CHOIR (clustering hierarchy optimization by iterative random forests), which applies a framework of random forest classifiers and permutation tests across a hierarchical clustering tree to statistically determine which clusters represent distinct populations. We demonstrate the enhanced performance of CHOIR through extensive benchmarking against 14 existing clustering methods across 100 simulated and 4 real single-cell RNA-seq, ATAC-seq, spatial transcriptomic, and multi-omic datasets. CHOIR can be applied to any single-cell data type and provides a flexible, scalable, and robust solution to the important challenge of identifying biologically relevant cell groupings within heterogeneous single-cell data.


Conflict of interest statement

COMPETING INTERESTS The authors declare no competing interests.

Figures

Extended Data Fig. 1:
Extended Data Fig. 1:. CHOIR effectively clusters multi-omic data and identifies cluster-specific features in both modalities.
a. Example of a hierarchical clustering tree generated by applying the default parameters of CHOIR to the RNA-seq and ATAC-seq features of the Wang et al. 2022 multi-omic dataset from human retinal cells. Final clusters identified are shown in color, pruned branches are shown in light grey. P1–P3 refer to parent clusters identified by maximizing the silhouette score, highlighted by the grey box. b. UMAP embedding colored according to the 22 clusters identified by CHOIR. Parent clusters identified by maximizing the silhouette score are outlined in dashed lines. c. Mean prediction accuracy scores indicated by color of lines connecting pairs of final clusters identified by CHOIR. Each line connects the two clusters compared and is colored by the mean prediction accuracy. Not all final cluster pairs were directly compared by permutation testing because some pairs did not meet distance or adjacency criteria. d. Dot plot comparing the feature importances extracted from the random forest comparisons computed by CHOIR for cluster 1 (rod cells) versus cluster 4 (cone cells) with the log fold change of gene expression between cluster 1 and cluster 4 identified using Seurat. Each dot represents an individual gene and all genes are shown. e–g. UMAP embeddings colored according to the expression level of the three RNA-seq features with the highest feature importances in the comparison of CHOIR cluster 1 versus cluster 4: KCNB2 (e), NEDD4L (f), and GALNT13 (g) were all enriched in cone cells. h–j. Genome track visualizations of the three ATAC-seq features with the highest feature importance in the comparison of CHOIR cluster 1 versus cluster 4: the GALNT13 locus (chr2:153,851,499–153,892,000) (h), SALL3 locus (chr18:78,959,999–79,000,500) (i), and HIST3H2BB locus (chr1:228,437,499–228,478,000) (j).
Extended Data Fig. 2:
Extended Data Fig. 2:. Computational time across clustering methods.
a. Line plots showing computational time required for the best-performing parameter setting for each of the 15 clustering methods applied to simulated data, averaged across all simulated datasets of each size. Methods with a maximum runtime under one hour are highlighted in the box to the right. Symbols indicate clustering methods that failed to run or did not complete within the maximum allotted runtime of 96 hours for at least one dataset. b–e. Computational time of each parameter setting tested for each method for the Wang et al. 2022 multi-omic ATAC-seq and RNA-seq dataset (b), Kinker et al. 2020 cancer cell line dataset (c), Hao et al. 2021 CITE-seq dataset (d), and Srivatsan et al. 2021 sci-Space dataset (e). Symbols indicate clustering methods in which one or more parameter settings failed to run.
Extended Data Fig. 3:
Extended Data Fig. 3:. CHOIR cluster 28 represents a population of neurons localized within the developing thalamus characterized by high Gbx2 expression.
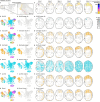
a–g. UMAP embedding of the Srivatsan et al. 2021 whole mouse embryo sci-Space dataset, colored according to the expression level of thalamic marker gene Gbx2 (a), or the clusters identified by the default parameters of CHOIR (b), Cytocipher (c), GiniClust3 (d), SCCAF (e), sc-SHC (f), or Seurat (g). A zoom in of Gbx2 expression is shown to the right of panel (a). h–m. UMAP embedding of the Srivatsan et al. 2021 whole mouse embryo sci-Space dataset, colored by the cluster shown in panels (a–g) that harbors the Gbx2-expressing thalamic neurons for each of the methods shown to the left. n. Distribution of thalamic marker gene Gbx2 in all sections with >25 cells belonging to CHOIR cluster 28 (thalamic neurons). o–t. Distribution of the method-specific cluster shown to the left in panels (h–m) across all sections shown in panel (n). The darker the shade of the cluster color, the more cells of the respective cluster were detected at the indicated location.
Fig. 1:
Fig. 1:. CHOIR is a hierarchical clustering algorithm that uses permutation testing for cluster identification by statistical inference.
a. Schematic demonstrating how CHOIR identifies clusters that should be merged by applying a permutation test approach to assess the accuracy of random forest classifiers in predicting cluster assignments from a normalized feature matrix. b. Schematic demonstrating how CHOIR constructs and iteratively prunes a hierarchical clustering tree using statistical inference to prevent underclustering and overclustering.
Fig. 2:
Fig. 2:. CHOIR outperforms 14 existing clustering methods across 100 simulated datasets.
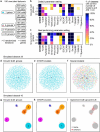
a. Schematic summarizing the 100 simulated datasets created using the R package Splatter. b–c. Heatmaps showing the percentage of simulated datasets in which the correct number of clusters was identified (all datasets) and with an ARI >0.9 (datasets with >1 ground truth groups) for the default parameter setting (b) or the best performing parameter setting (c) for each method. Symbols indicate clustering methods that *assumed ≥2 clusters, had some parameter settings that failed to run, or had some parameter settings that did not complete within the maximum allotted runtime of 96 hours. For the CHOIR, CIDR, scCAN, SHARP, and Spectrum methods, the best-performing parameter setting in (c) was the same as the default parameter setting in (b). d–f. UMAP embeddings for simulated dataset 25, consisting of 2,500 cells and a single ground truth group of cells colored by the ground truth grouping (d) or the clusters achieved using the default parameters of CHOIR (e) or Seurat (f). g–i. UMAP embeddings for simulated dataset 45, consisting of 20,000 cells and five ground truth groups of cells colored by the ground truth groupings (g), the clusters achieved using the default parameters of CHOIR (h), and the agreement between these CHOIR clusters and the ground truth labels (i).
Fig. 3:
Fig. 3:. CHOIR prevents underclustering in an scRNA-seq dataset consisting of pooled cell lines.
a. UMAP embedding of a pooled cancer cell line scRNA-seq dataset from Kinker et al. 2020 consisting of 48,879 cells, colored according to the 190 cancer cell lines. b–h. UMAP embedding showing the cells within the highlighted square in (a), colored by cell line (b) and the clusters identified by CHOIR (c), Cytocipher (d), GiniClust3 (e), SCCAF (f), sc-SHC (g), and Seurat (h), using the default parameters for each method. Dashed lines indicate instances where the clustering method failed to distinguish individual cell lines, resulting in multiple cell lines grouped within a single cluster. i. The entropy of cluster accuracy for all method and parameter combinations tested, representing the degree of underclustering. *Some parameters tested for GiniClust3 and sc-SHC resulted in a single cluster, for which the entropy of cluster accuracy could not be computed. j. UMAP embedding showing CHOIR cluster 13 and cluster 29 identified within the A375 cell line projected onto the dimensionality reduction space of an independent scRNA-seq dataset consisting of 4,794 A375 cells. k. Expression levels of proliferation marker MKI67 and tumor suppressor DEPTOR across the A375 cells from the Yang et al. 2021 independent dataset (left) and the projected cells from Kinker et al 2020 (right). l. UMAP embedding showing CHOIR cluster 75 and cluster 346 identified within the T47D cell line projected onto the dimensionality reduction space of an independent scRNA-seq dataset consisting of 4,582 T47D cells. m. Expression levels of proliferation marker MKI67 and growth arrest marker GAS5 across the T47D cells from the Dave et al. 2023 independent dataset (left) and the projected cells from Kinker et al 2020 (right).
Fig. 4:
Fig. 4:. Multi-omic data enables orthogonal validation of identified clusters
a. A stacked barplot showing the percentage of parameter settings for each method tested on the Hao et al. 2021 human PBMC CITE-seq dataset that did (not overclustered) or did not (likely overclustered) result in at least one differentially expressed protein in all 50 closest pairwise cluster comparisons, or that failed to run. b. A dot plot showing the number of clusters that was identified by the subset of all method and parameter combinations tested that did not result in likely overclustering (a). c. UMAP embedding of cells from the Hao et al. 2021 human PBMC CITE-seq dataset colored according to the 23 clusters identified by the parameter settings for CHOIR that maximized the number of clusters while preventing likely overclustering. d–e. UMAP embedding as in panel (c), but colored according to the expression level of naïve T cell marker CCR7 (d) or the expression level of conventional dendritic cell type 1 marker CLEC9A (e). Because of the small size of Cluster 23, a zoom-in window was used to display CLEC9A expression in panel (e).
Fig. 5:
Fig. 5:. CHOIR identifies anatomically localized clusters in a spatially resolved snRNA-seq dataset
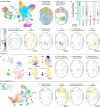
a. UMAP embedding colored according to the 42 clusters identified by applying the default parameters of CHOIR to the snRNA-seq features of the Srivatsan et al. 2021 whole mouse embryo sci-Space dataset. Cluster colors persist throughout this figure. b. CHOIR cluster with the highest number of cells at each spatial coordinate position mapped onto a single section. Slide 14 is shown throughout this figure because it had the highest number of recovered nuclei and positions. c. Anatomical boundaries, adapted from annotations used in Srivatsan et al. 2021. d–f. Cluster distributions and corresponding marker gene expression levels for CHOIR cluster 10, keratinized epithelium cells (d); cluster 14, hepatocytes (e); and cluster 18, lung mesenchyme cells (f) mapped onto spatial coordinates. For plots showing CHOIR clusters, the darker the shade of any given color, the more cells of the respective cluster were detected at the indicated location. g. Mean percentage of all clusters per section that had a highly localized spatial distribution for all method and parameter combinations tested (see Methods). For Cytocipher, some parameter settings failed to run. h–i. UMAP embedding computed on the subsetted dimensionality reduction of parent cluster P4 identified using default parameters of CHOIR colored by CHOIR cluster (h) and the expression levels of connective tissue marker gene Col1a1, cardiomyocyte marker gene Myh7, and endothelial cell marker genes Nos3 and Cdh5 (i). See inset legend next to panel (d). j–l. Cluster distributions for CHOIR cluster 24, Col1a1-expressing cardiac interstitial cells (j), cluster 29, Myh7-expressing cardiomyocytes (k), and cluster 37, Nos3/Cdh5-expressing heart endothelial cells (l) mapped onto spatial coordinates. The darker the shade of any given color, the more cells of the respective cluster were detected at the indicated location. See inset legend next to panel (d). m. UMAP embedding computed on the subsetted dimensionality reduction of parent cluster P3 consisting of nervous system cells colored by the clusters identified by CHOIR using the default parameters. n–o. Cluster distributions and corresponding marker gene expression levels for CHOIR cluster 28, Gbx2-expressing thalamic neurons (n), and cluster 36, Lhx6-expressing medial ganglionic eminence interneuron progenitors (o). For plots showing CHOIR clusters, the darker the shade of any given color, the more cells of the respective cluster were detected at the indicated location. See inset legend next to panel (d).

Similar articles

References

    1. Tabula Sapiens C. et al. The Tabula Sapiens: A multiple-organ, single-cell transcriptomic atlas of humans. Science 376, eabl4896 (2022). - PMC - PubMed
    1. Blondel V. D., Guillaume J. L., Lambiotte R. & Lefebvre E. Fast unfolding of communities in large networks. J. Stat. Mech. P10008, 1–12 (2008).
    1. Traag V. A., Waltman L. & van Eck N. J. From Louvain to Leiden: guaranteeing well-connected communities. Sci. Rep. 9, 1–12 (2019). - PMC - PubMed
    1. Kiselev V. Y., Andrews T. S. & Hemberg M. Challenges in unsupervised clustering of single-cell RNA-seq data. Nat. Rev. Genet. 20, 273–282 (2019). - PubMed
    1. Herman J. S., Sagar & Grun, D. FateID infers cell fate bias in multipotent progenitors from single-cell RNA-seq data. Nat. Methods 15, 379–386 (2018). - PubMed

METHODS-ONLY REFERENCES

    1. Peng M. et al. Cell type hierarchy reconstruction via reconciliation of multi-resolution cluster tree. Nucleic Acids Res. 49, e91 (2021). - PMC - PubMed
    1. Zappia L., Phipson B. & Oshlack A. Splatter: simulation of single-cell RNA sequencing data. Genome Biol. 18, 1–15 (2017). - PMC - PubMed
    1. Mölder F. et al. Sustainable data analysis with Snakemake. F1000Res. 10, 1–29 (2021). - PMC - PubMed
    1. Stolarczyk M., Reuter V. P., Smith J. P., Magee N. E. & Sheffield N. C. Refgenie: a reference genome resource manager. GigaScience 9, 1–6 (2020). - PMC - PubMed
    1. Stolarczyk M., Xue B. & Sheffield N. C. Identity and compatibility of reference genome resources. NAR Genom. Bioinform. 3, 1–6 (2021). - PMC - PubMed

Publication types