[Preprint]. 2024 Jan 28:2024.01.24.577060.
doi: 10.1101/2024.01.24.577060.

Comprehensive single-cell atlas of the mouse retina

Affiliations

Comprehensive single-cell atlas of the mouse retina

Jin Li et al. bioRxiv. .

Update in

  • Comprehensive single-cell atlas of the mouse retina.
    Li J, Choi J, Cheng X, Ma J, Pema S, Sanes JR, Mardon G, Frankfort BJ, Tran NM, Li Y, Chen R. Li J, et al. iScience. 2024 May 8;27(6):109916. doi: 10.1016/j.isci.2024.109916. eCollection 2024 Jun 21. iScience. 2024. PMID: 38812536 Free PMC article.

Abstract

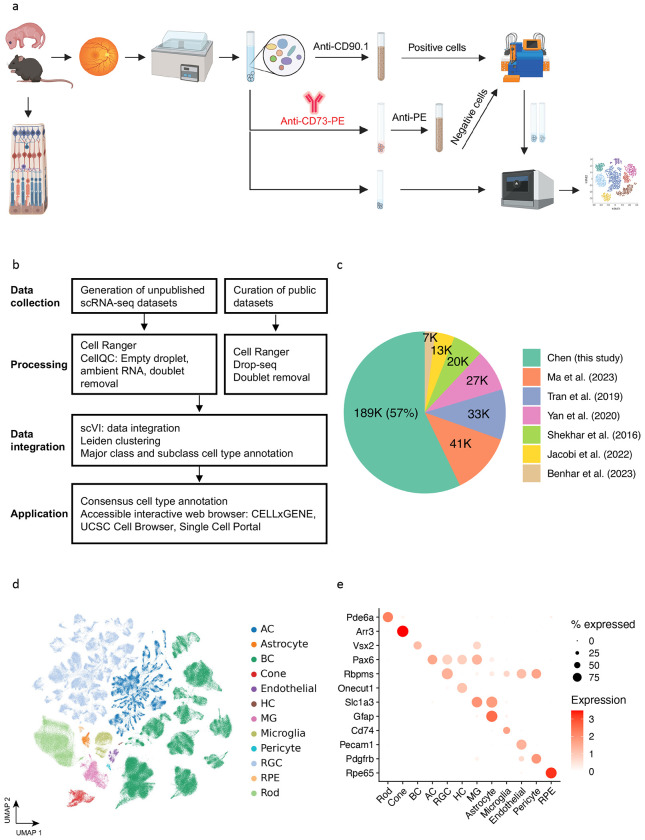
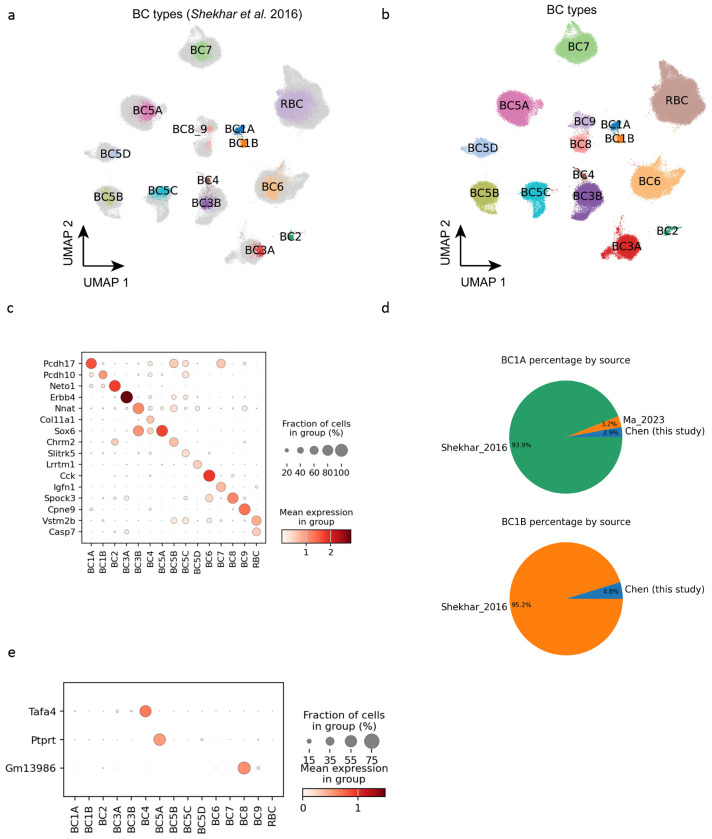
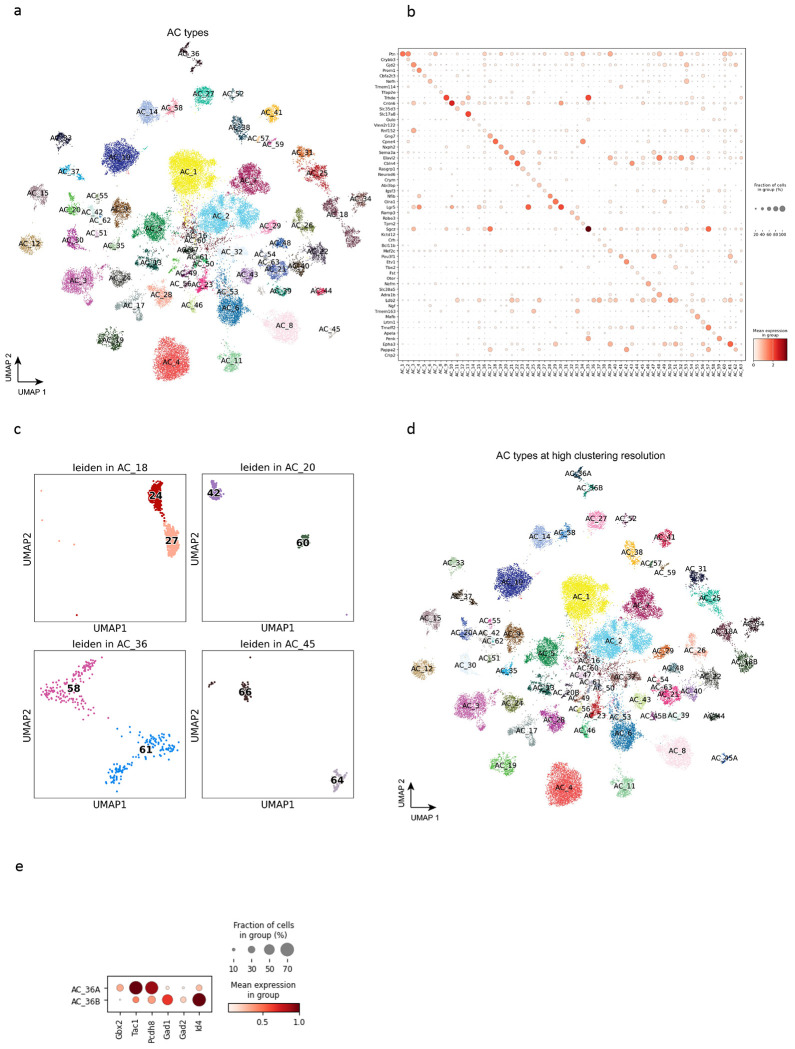
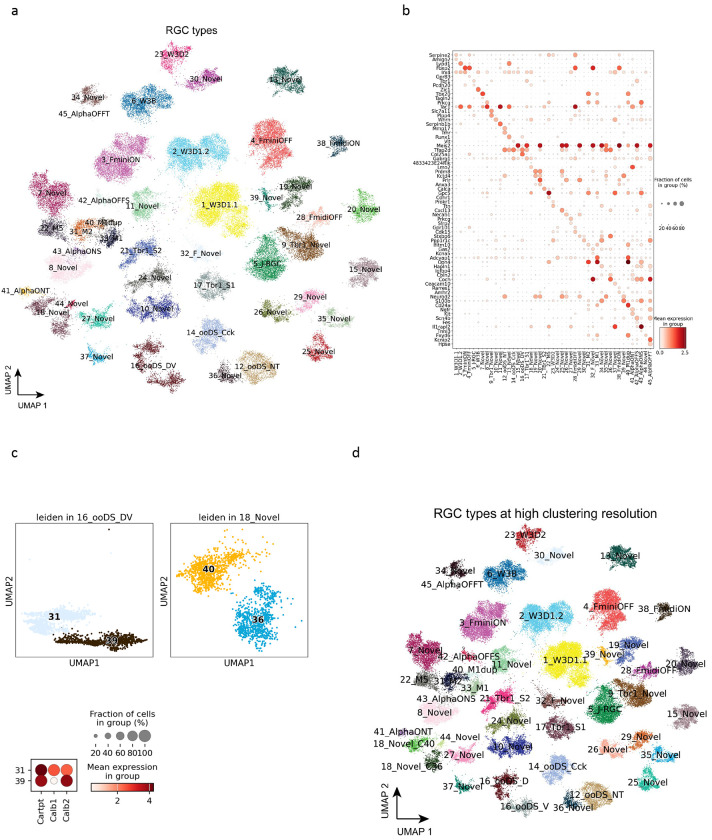
Single-cell RNA sequencing (scRNA-seq) has advanced our understanding of cellular heterogeneity at the single-cell resolution by classifying and characterizing cell types in multiple tissues and species. While several mouse retinal scRNA-seq reference datasets have been published, each dataset either has a relatively small number of cells or is focused on specific cell classes, and thus is suboptimal for assessing gene expression patterns across all retina types at the same time. To establish a unified and comprehensive reference for the mouse retina, we first generated the largest retinal scRNA-seq dataset to date, comprising approximately 190,000 single cells from C57BL/6J mouse whole retinas. This dataset was generated through the targeted enrichment of rare population cells via antibody-based magnetic cell sorting. By integrating this new dataset with public datasets, we conducted an integrated analysis to construct the Mouse Retina Cell Atlas (MRCA) for wild-type mice, which encompasses over 330,000 single cells. The MRCA characterizes 12 major classes and 138 cell types. It captured consensus cell type characterization from public datasets and identified additional new cell types. To facilitate the public use of the MRCA, we have deposited it in CELLxGENE, UCSC Cell Browser, and the Broad Single Cell Portal for visualization and gene expression exploration. The comprehensive MRCA serves as an easy-to-use, one-stop data resource for the mouse retina communities.


Conflict of interest statement

Competing interests The authors declare no competing interests.

Figures

Figure 1.
Figure 1.. Overview of single cell atlas of the mouse retina
(a) The workflow for generating unpublished scRNA-seq datasets. The data generation process involved using mice aged from P14 to 12 months. Following retina dissection and cell dissociation, single cells were enriched using autoMACS with Anti-CE73-PE antibodies or Anti-CD90.1 beads for specific amacrine, bipolar, and retinal ganglion cells. Subsequently, 10X single-cell RNA sequencing was performed on both the unenriched and enriched single cells. The retained single cells were then utilized in downstream atlas construction. (b) The integrated analysis workflow for constructing the MRCA. To construct a comprehensive unified single-cell reference of the mouse retina, we generated 16 unpublished scRNA-seq samples of the mouse retina and incorporated four curated public datasets to enhance specific amacrine, bipolar and retinal ganglion cells. The collected data were processed using the Cell Ranger and CellQC pipeline to produce feature count matrices. Feature counts were then processed to remove estimated empty droplets, ambient RNA, and doublets. The retained cells were integrated using scVI to eliminate batch effects across samples. The trained low-dimensional embeddings were used to calculate cell dissimilarities and identify clustering through a two-level clustering approach. Major class and subclass cell types were annotated using canonical marker genes and public labeling. To facilitate user-friendly access and exploration, the MRCA was deployed on accessible interactive web browsers, including CELLxGENE, UCSC Cell Browser, and Single Cell Portal. (c) Pie chart displaying the percentage of cells contributed by each dataset used in the MRCA. (d) UMAP visualization of the MRCA colored by major classes. (e) Dot plot illustrating the expression of canonical markers for major classes.
Figure 2.
Figure 2.. Bipolar cells
(a) UMAP visualization of BCs colored by public cell type labels from Shekhar et al. 2016. The newly discovered cells without public labeling are colored in gray. (b) BCs colored by the 15 annotated annotated cell types. (c) Dot plot of BC type marker gene expression in the 15 types. (d) Pie chart showing the percentage each data source making up BC1A and BC1B population. (e) Dot plot of new markers for three BC types: BC4, BC5A, and BC8. The three new markers exhibit more exclusive expression patterns.
Figure 3.
Figure 3.. Amacrine cells
(a) UMAP visualization of AC cells colored by the annotated types. (b) Dot plot of canonical marker gene expression in AC types. (c) Four previously under-clustered AC types, i.e., AC18, AC20, AC36, and AC45, are split into two distinct clusters at a high resolution of clustering. (d) Visualization of AC cells colored by AC types at a high clustering resolution. (e) Dot plot of DEGs expressed in two split clusters for AC_36, stratifying Gbx2+ AC types in AC_36.
Figure 4.
Figure 4.. Retinal ganglion cells
(a) UMAP visualization of RGC cells colored by the annotated types. (b) Dot plot of canonical marker gene expression in RGC types. (c) Two previously under-clustered RGC types, i.e., 16_ooDS_DV and 18_Novel, are split into two distinct clusters at a high resolution of clustering. Dot plot of Calb1 and Calb2 in the two split clusters of 16_ooDS_DV. (d) Visualization of RGC cells colored by RGC types at a high clustering resolution.
Figure 5.
Figure 5.. Visualization of MRCA in accessible interactive browsers
(a) Visualization of the MRCA in the CELLxGENE browser. The homepage depicts three panels to explore the MRCA. The left panel contains the pre-computed features facilitating the selection of cells by interested categories. The middle panel is the UMAP of the MRCA, colored by the annotated major classes. The right panel allows input of quick gene symbols and gene sets. (b) Visualization of the subclass RGC atlas in the CELLxGENE browser. The middle panel depicts RGCs colored by the reclassified names selected in the left panel. (c) Visualization of gene expression for a BC9 marker, Cpne9, in the BC atlas. The left subfigure shows the BC types, and the right subfigure highlights the normalized gene expression values of Cpne9 for BC9 type in the middle panel.

Similar articles

References

    1. Masland R. H. The neuronal organization of the retina. Neuron 76, 266–280 (2012). 10.1016/j.neuron.2012.10.002 - DOI - PMC - PubMed
    1. Jeon C. J., Strettoi E. & Masland R. H. The major cell populations of the mouse retina. J Neurosci 18, 8936–8946 (1998). - PMC - PubMed
    1. Grunert U. & Martin P. R. Cell types and cell circuits in human and non-human primate retina. Prog Retin Eye Res, 100844 (2020). 10.1016/j.preteyeres.2020.100844 - DOI - PubMed
    1. Vecino E., Rodriguez F. D., Ruzafa N., Pereiro X. & Sharma S. C. Glia-neuron interactions in the mammalian retina. Prog Retin Eye Res 51, 1–40 (2016). 10.1016/j.preteyeres.2015.06.003 - DOI - PubMed
    1. Boulton M. & Dayhaw-Barker P. The role of the retinal pigment epithelium: topographical variation and ageing changes. Eye (Lond) 15, 384–389 (2001). 10.1038/eye.2001.141 - DOI - PubMed

Publication types