[Preprint]. 2024 Jan 28:2024.01.27.577585.
doi: 10.1101/2024.01.27.577585.

A Conserved Mechanism of Cardiac Hypertrophy Regression through FoxO1

Affiliations

A Conserved Mechanism of Cardiac Hypertrophy Regression through FoxO1

Thomas G Martin et al. bioRxiv. .

Update in

Abstract

The heart is a highly plastic organ that responds to diverse stimuli to modify form and function. The molecular mechanisms of adaptive physiological cardiac hypertrophy are well-established; however, the regulation of hypertrophy regression is poorly understood. To identify molecular features of regression, we studied Burmese pythons which experience reversible cardiac hypertrophy following large, infrequent meals. Using multi-omics screens followed by targeted analyses, we found forkhead box protein O1 (FoxO1) transcription factor signaling, and downstream autophagy activity, were downregulated during hypertrophy, but re-activated with regression. To determine whether these events were mechanistically related to regression, we established an in vitro platform of cardiomyocyte hypertrophy and regression from treatment with fed python plasma. FoxO1 inhibition prevented regression in this system, while FoxO1 activation reversed fed python plasma-induced hypertrophy in an autophagy-dependent manner. We next examined whether FoxO1 was implicated in mammalian models of reversible hypertrophy from exercise and pregnancy and found that in both cases FoxO1 was activated during regression. In these models, as in pythons, activation of FoxO1 was associated with increased expression FoxO1 target genes involved in autophagy. Taken together, our findings suggest FoxO1-dependent autophagy is a conserved mechanism for regression of physiological cardiac hypertrophy across species.


Conflict of interest statement

COMPETING INTERESTS LAL is a Co-Founder of MyoKardia, acquired by Bristol Myers Squibb. MyoKardia and Bristol Myers Squibb were not involved in this study. The other authors have no competing interests to disclose.

Figures

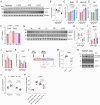
Figure 1.
Figure 1.. Post-prandial ventricular remodeling in the Burmese python is associated with dynamic regulation of FoxO1 signaling and autophagy.
A. Heat map of differentially expressed python genes after feeding identified by RNA sequencing and partitioned into 3 clusters by K-means clustering. mat = matrix, representing the Z-score. B. Volcano plot 1DPF vs. Fasted gene expression highlighting FoxO gene targets FBXO32 and BNIP3 as the most significantly downregulated genes. C. Volcano plot of 6DPF vs. 1DPF indicating restored expression of FoxO target genes. D-E. Reactome pathway (D) and GO Biological Process (E) enrichment of differentially expressed genes in Cluster 3. F. Downregulated genes at 1DPF vs Fasted enriched by target genes of transcription factors in the ChEA 2022 database. G. Significantly differentially expressed genes identified in Cluster 3 in the RNAseq data enriched by target genes of transcription factors in the ChEA 2022 database. FDR = false discovery rate adjusted p-value, FC = fold-change.
Figure 2.
Figure 2.. FoxO1 and autophagy activity are suppressed during hypertrophy development in the Burmese python and re-activated with regression.
A. Python heart weight normalized to body weight throughout the feeding paradigm; F = fasted. B. Western blots for phosphorylated FoxO1, phosphorylated ULK1, and LC3B. C-E. p-FoxO1 (C), p-ULK1 (D), and LC3-II (E) expression normalized to total protein. F-I. qPCR analysis of the autophagy genes BNIP3 (F), CTSL (G), MAP1LC3B (H), and ULK1 (I) normalized to HPRT. For all, n = 4 pythons/group and data were analyzed by one-way ANOVA.
Figure 3.
Figure 3.. Mammalian cardiomyocytes treated with fed python plasma recapitulate molecular features of python post-prandial cardiac remodeling.
A. Experimental paradigm. PE = phenylephrine, Fast = fasted python plasma, FPP = fed python plasma. B. Percent change in cell particle diameter compared with control for NRVMs treated with PE, 3% Fast, or 3% FPP during the Treatment and Chase. n = 10,000–30,000 cells/replicate, 8 biological replicates/group; two-way ANOVA. C. qPCR analysis for Nppa gene expression normalized to 18S; n = 5/group, two-way ANOVA. D. Immunoblots for puromycin, representing protein synthesis rates. E-G. Representative immunoblots (E) and normalized expression of p-mTOR (F) and p-Akt (G); n = 4/group; two-way ANOVA. H. Representative immunoblot for LC3B in NRVMs during Treatment and Chase with and without BafA1. I. LC3-II expression normalized to GAPDH during the Chase. n = 4/group, two-way ANOVA. J. qPCR analysis for Bnip3, Map1lc3b, and Ulk1 expression normalized to 18S during the Chase. n = 5/group, two way-ANOVA. Con, C = control.
Figure 4.
Figure 4.. FoxO1 inhibition prevents regression of fed python plasma-induced hypertrophy.
A-B. Representative immunoblot (A) and normalized expression of (B) phosphorylated FoxO1 (Threonine 24) during Treatment (24 hours) and Chase (6 hours post agonist withdrawal); n = 4/group; two-way ANOVA; C = control, Tx = treatment. C. Representative immunofluorescence microscopy images for NRVMs transduced with Ad-GFP-FOXO1WT treated with FPP (Treatment) or 12 hours after withdrawal of FPP (Chase); 100X magnification, scale bar = 15 μm. D. Percent change in cell particle diameter compared with control for NRVMs treated with FPP, 24 hours after FPP removal with addition of DMSO vehicle or 2 μM AS1842856 (AS, FoxO1-specific inhibitor; n = 10,000–30,000 cells/replicate, 5 biological replicates/group; one-way ANOVA. E-H. qPCR analysis of autophagy genes Bnip3 (E), Gabarapl1 (F), Map1lc3b (G), and Ulk1 (H) normalized to Gapdh; n = 6/group; one-way ANOVA. I-J. Representative immunoblot (I) and normalized expression of (J) LC3B 24 hours after FPP withdrawal and addition of AS; two-way ANOVA. K-L. Representative immunofluorescence microscopy images (K) and quantification (L) of LC3B-positive area (Green) in NRVMs transduced with Ad-GFP-LC3B after FPP withdrawal with or without the FoxO1 inhibitor AS1842856 and ± BafA1; 100X magnification, scale bar = 15 μm; n = 42 FPP→C/DMSO, 52 FPP→C/BafA1, 48 FPP→AS/DMSO, 49 FPP→AS/BafA1; two-way ANOVA.
Figure 5.
Figure 5.. FoxO1 activation stimulates regression of fed python plasma-induced hypertrophy through autophagy.
A. Experimental paradigm for FoxO1 constitutive activation. B. Representative immunofluorescence microscopy images showing localization of adenovirally expressed GFP-FOXO1ΔDB and GFP-FOXO1CA counterstained with α-actinin; 100X magnification, scale bars = 15 μm. C. Percent change in cell particle diameter compared to control; n = 10,000–30,000 cells/replicate, 5 biological replicates/group. D-G. qPCR analysis for the autophagy genes Bnip3 (D), Gabarapl1 (E), Map1lc3b (F), and Ulk1 (G) normalized to Gapdh; n = 6/group. H-I. Representative immunoblot (H) and normalized expression of (I) LC3-II with and without BafA1; n = 6/group. J. Representative immunoblot for LC3B and GAPDH in NRVMs exposed to BafA1 ± 10 mM 3-MA. K. LC3-II expression normalized to GAPDH. n = 3/group, two-way ANOVA. L. Percent change in particle diameter compared to control ± 3-methyl adenine (3-MA); n = 10,000–30,000 cells/replicate, 6 biological replicates/group. For all except K, data were analyzed by one-way ANOVA.
Figure 6.
Figure 6.. FoxO1 is activated during regression in mammalian models of reversible physiological cardiac hypertrophy.
A. Western blot for p-FoxO1 (T24), FoxO1, and GAPDH in sedentary and exercised mice; DPR = days post-running. B. p-FoxO1 expression normalized to GAPDH in the exercise paradigm. C-E. qPCR analysis for Bnip3 (C), Map1lc3b (D), and Ulk1 (E) expression normalized to 18S; for B-E, n = 6/group; one-way ANOVA. F. Heart weight normalized to tibia length for non-pregnant (NP), middle pregnant (MP, 13 days), late pregnant (LP, 17 days), 7 days post-partum (7PP), and 21 days post-partum (21PP). Post-partum mice were non-lactating, as pups were immediately removed from the cage following birth. n = 14 NP, 11 MP, 9 LP, 16 7PP, and 7 21PP. G. Western blot for p-FoxO1 (T24), FoxO1, and GAPDH in NP, MP, LP, 7PP, and 21PP mice. H. p-FoxO1 expression normalized to GAPDH in the pregnancy paradigm. I-K. qPCR analysis for Bnip3 (I), Map1lc3b (J), and Ulk1 (K) expression normalized to Gapdh; for H-K, n = 5 NP, 4 MP, 4 LP, 5 7PP, and 5 21PP; one-way ANOVA. M. % change in NRVM cell particle diameter after 24 hours with 15 nM IGF-1 or 24 hours after removal of IGF-1; n = 3/group; two-tailed t-test. N. Representative western blot for p-FoxO1, FoxO1, and GAPDH in NRVMs treated with IGF-1 and 6 hours after IGF-1 removal. O. p-FoxO1 normalized to total FoxO1; n = 6/group, two-way ANOVA. P. % change in NRVM cell particle diameter after IGF-1 with Ad-Empty, Ad-FOXO1ΔDB, or Ad-FOXO1CA added at 20 MOI for 48 hours; n = 6/group, one-way ANOVA.

References

    1. Keen A.N., Klaiman J.M., Shiels H.A., and Gillis T.E. (2017). Temperature-induced cardiac remodelling in fish. J. Exp. Biol. 220, 147–160. 10.1242/jeb.128496. - DOI - PMC - PubMed
    1. Klaiman J.M., Fenna A.J., Shiels H.A., Macri J., and Gillis T.E. (2011). Cardiac remodeling in fish: Strategies to maintain heart function during temperature change. PLoS One 6, e24464. 10.1371/journal.pone.0024464. - DOI - PMC - PubMed
    1. Shaftoe J.B., Manchester E.A., and Gillis T.E. (2023). Cardiac remodeling caused by cold acclimation is reversible with rewarming in zebrafish (Danio rerio). Comp. Biochem. Physiol. - Part A Mol. Integr. Physiol. 283, 111466. 10.1016/j.cbpa.2023.111466. - DOI - PubMed
    1. Nyboer E.A., and Chapman L.J. (2018). Cardiac plasticity influences aerobic performance and thermal tolerance in a tropical, freshwater fish at elevated temperatures. J. Exp. Biol. 221, 178087. 10.1242/jeb.178087. - DOI - PubMed
    1. Scott G.R. (2011). Elevated performance: The unique physiology of birds that fly at high altitudes. J. Exp. Biol. 214, 2455–2462. 10.1242/jeb.052548. - DOI - PubMed

Publication types