[Preprint]. 2024 Jan 28:2024.01.28.577594.
doi: 10.1101/2024.01.28.577594.

Assembly, stability, and dynamics of the infant gut microbiome are linked to bacterial strains and functions in mother's milk

Affiliations

Assembly, stability, and dynamics of the infant gut microbiome are linked to bacterial strains and functions in mother's milk

Mattea Allert et al. bioRxiv. .

Abstract

The establishment of the gut microbiome in early life is critical for healthy infant development. Although human milk is recommended as the sole source of nutrition for the human infant, little is known about how variation in milk composition, and especially the milk microbiome, shapes the microbial communities in the infant gut. Here, we quantified the similarity between the maternal milk and the infant gut microbiome using 507 metagenomic samples collected from 195 mother-infant pairs at one, three, and six months postpartum. We found that the microbial taxonomic overlap between milk and the infant gut was driven by bifidobacteria, in particular by B. longum. Infant stool samples dominated by B. longum also showed higher temporal stability compared to samples dominated by other species. We identified two instances of strain sharing between maternal milk and the infant gut, one involving a commensal (B. longum) and one a pathobiont (K. pneumoniae). In addition, strain sharing between unrelated infants was higher among infants born at the same hospital compared to infants born in different hospitals, suggesting a potential role of the hospital environment in shaping the infant gut microbiome composition. The infant gut microbiome at one month compared to six months of age was enriched in metabolic pathways associated with de-novo molecule biosynthesis, suggesting that early colonisers might be more versatile and metabolically independent compared to later colonizers. Lastly, we found a significant overlap in antimicrobial resistance genes carriage between the mother's milk and their infant's gut microbiome. Taken together, our results suggest that the human milk microbiome has an important role in the assembly, composition, and stability of the infant gut microbiome.


Figures

Figure 1.
Figure 1.
(A) Study design overview for the 507 samples collected from 195 mother-infant pairs. Infant stool samples (n=334) were collected at one and six months of life. Maternal breast milk samples (n=173) were collected one and three months after delivery. Taxonomic composition of (B) the most prevalent and abundant species found in the human breast milk and (C) in the infant gut microbiome samples in relation to sample collection time point, predominance group and other relevant infant metadata. Predominance group identifies the most abundant species in each sample. (D) Shannon diversity distribution for infant stool and maternal milk samples over time. P-values calculated using paired t-test (* p<0.05, ** p<0.01 and *** p<0.001). (E) Ordination plot based on Bray-Curtis distance between samples, colored by body site of origin and sampling time. Boxed species names indicate the species driving the clustering in that area of the PCoA and were obtained using the Weighted Averages Scores for species (see also Extended data 2).
Figure 2.
Figure 2.
(A) Prevalence of each predominance group in milk and infant stool samples and (B) the transition of samples between predominance groups over time. Each sample is assigned one of four predominance groups indicated by the different colors. (C) Bifidobacteria mean prevalence and (D) distribution of relative abundances in exclusively breastfed infants at one and six months, and non-exclusively breastfed infants at six months of age. Black diamonds indicate the mean relative abundance per group. P-values calculated using Wilcoxon rank sum. Reported p-values are adjusted using Bonferroni method. (E) Species persistence in the infant gut across all samples and (F) stratified by breastfeeding at six months. (G) Relative abundance of some of the differentially abundant species between one and six months when divided by breastfeeding (BF) at six months. P-values calculated with paired t-test and adjusted with BH correction. **** for P ≤ 0.0001, *** for P ≤ 0.001, ** for P ≤ 0.01 and * for P ≤ 0.05.
Figure 3.
Figure 3.
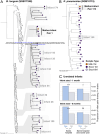
Strain sharing between maternal milk and infant stool samples for (A) the commensal species B. longum and (B) the pathobiont K. pneumoniae, highlighted in black. Instances of strain persistence within the same infant over time are highlighted with gray. (C) Proportion of unrelated infant pairs at one month (top) and six months (bottom) that share at least one strain (y-axis), considering infant pairs born in the same hospital (left), and same hospital as well as same year (right). Fisher’s exact test p-values are reported.
Figure 4.
Figure 4.
Most abundant pathways identified in (A) breastmilk at one and three months postpartum and (B) infant gut at one and six months of life. (C) Relative abundance of pathways involved in the biosynthesis of essential amino acids across sample type, collection time point and breastfeeding (BF). Error bars represent a 95% confidence interval calculated by bootstrapping (1000 times). P-values calculated using t-test, **** for P ≤ 0.0001 and ** p<0.01. Reported p-values are adjusted using Bonferroni method. (D) P-values of Spearman correlation between the abundance of all metabolic pathways shared between the maternal breast milk and infant stool samples for each mother-infant pair. P-values are corrected for multiple testing using Benjamin Hochberg correction and are shown in log10 scale. Only the top 20 mother-infant pairs are shown. Circle size denotes the correlation coefficient (rho), and the orange line denotes the significance threshold (log10 of p-value=0.01).
Figure 5.
Figure 5.
(A) Prevalence of the antimicrobial resistance genes (ARGs) classes predicted in maternal milk and the infant gut microbiome over time, calculated as percentage over the total number of detected ARGs for each sample type. (B) ARGs carriage in infant stool samples, divided by collection time point, infant metadata, predominance group and ARGs class. (C) Number of detected ARGs in infant stool samples dominated by bifidobacteria and non bifidobacteria species at one and six months of life. P-values calculated using t-test, **** for P ≤ 0.0001 and * for P ≤ 0.05. (D) Correlation between ARG carriage in maternal milk and infant stool samples, and (E) between infant stool samples at one month and six months. Each dot is a combination of a mother-infant pair and a predicted ARG class. Spearman’s R-values (correlation coefficient) and p-values are reported. (F) Percentage of ARG genes shared between at least one maternal and one infant sample, for each mother-infant pair. Mean value is indicated by the orange line. The mother-infant pairs for which strain sharing events were identified are highlighted with the arrow. (G) Distribution of the percentage of shared ARGs between at least one maternal milk and one infant stool sample on permuted mother-infant pairs (pseudo-pairs). The mean value obtained from real mother-infant pairs is indicated by the orange line. (H) Percentage of mother-infant pairs sharing antimicrobial resistance genes, divided by ARG class. For each ARG class, percentage value was calculated on the total number of mother-infant pairs in which that ARG class was identified in at least one sample. The most frequently shared antimicrobial resistance genes per class are highlighted in orange.

Similar articles

References

    1. Legoux F. et al. Microbial metabolites control the thymic development of mucosal-associated invariant T cells. Science 366, 494–499 (2019). - PubMed
    1. Zegarra-Ruiz D. F. et al. Thymic development of gut-microbiota-specific T cells. Nature 594, 413–417 (2021). - PMC - PubMed
    1. LeBlanc J. G. et al. Bacteria as vitamin suppliers to their host: a gut microbiota perspective. Curr. Opin. Biotechnol. 24, 160–168 (2013). - PubMed
    1. Yao Y. et al. The Role of Microbiota in Infant Health: From Early Life to Adulthood. Front. Immunol. 12, 708472 (2021). - PMC - PubMed
    1. Wilkins A. T. & Reimer R. A. Obesity, Early Life Gut Microbiota, and Antibiotics. Microorganisms 9, (2021). - PMC - PubMed

Publication types