[Preprint]. 2024 Jan 25:2024.01.24.577070.
doi: 10.1101/2024.01.24.577070.

Evaluating the effect of denoising submillimeter auditory fMRI data with NORDIC

Affiliations

Evaluating the effect of denoising submillimeter auditory fMRI data with NORDIC

Lonike K Faes et al. bioRxiv. .

Update in

Abstract

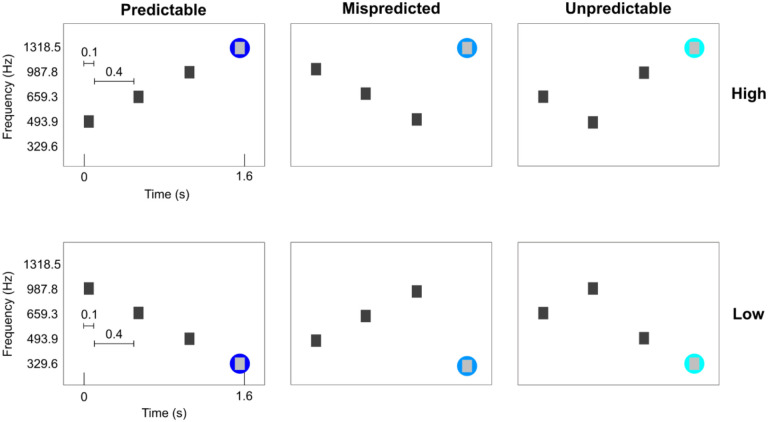
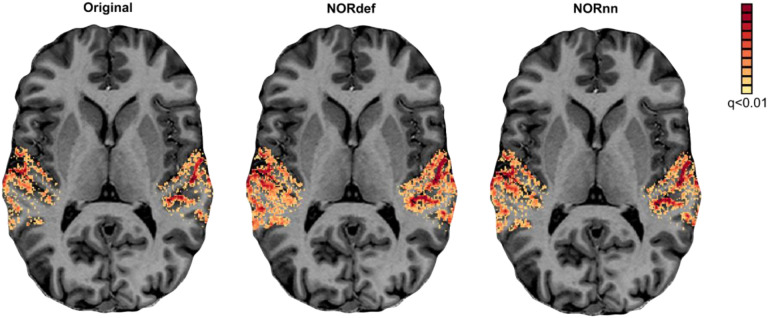
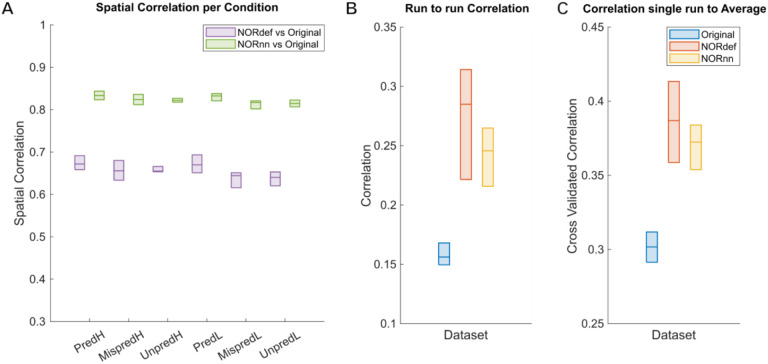
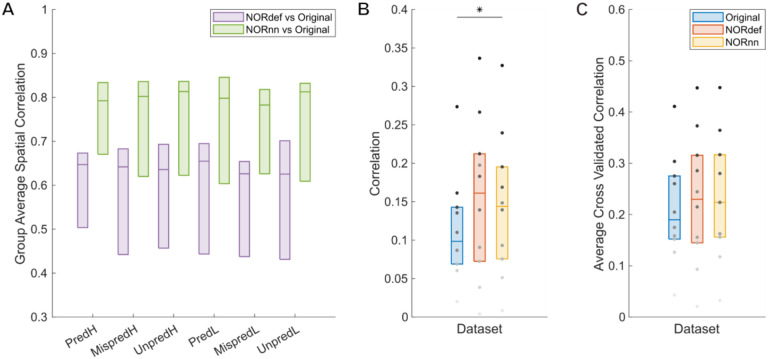
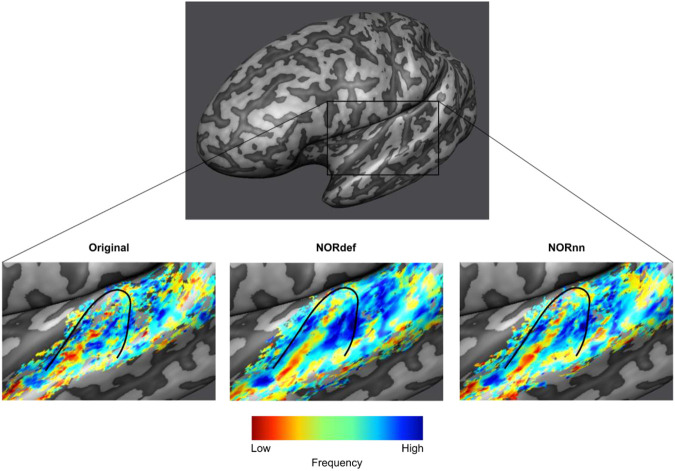
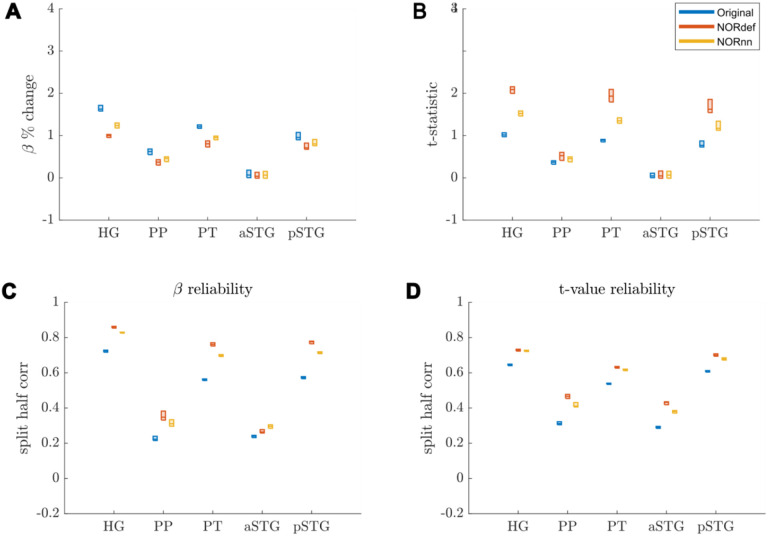
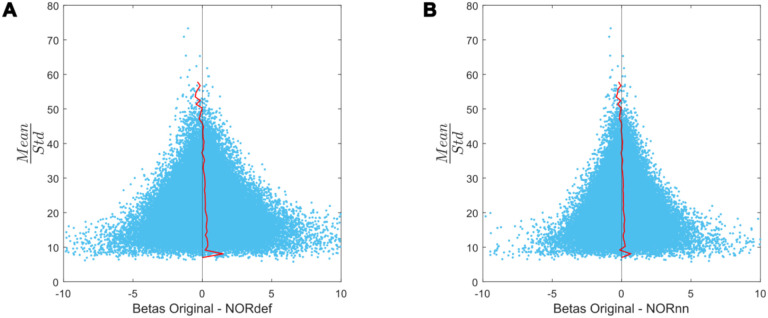
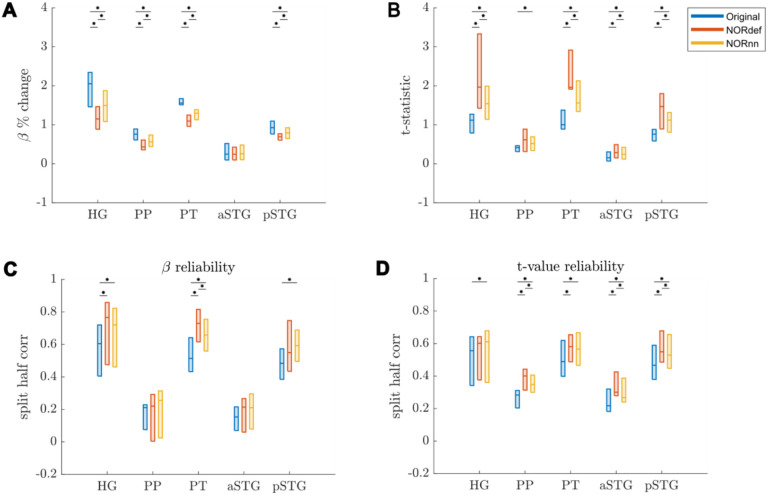
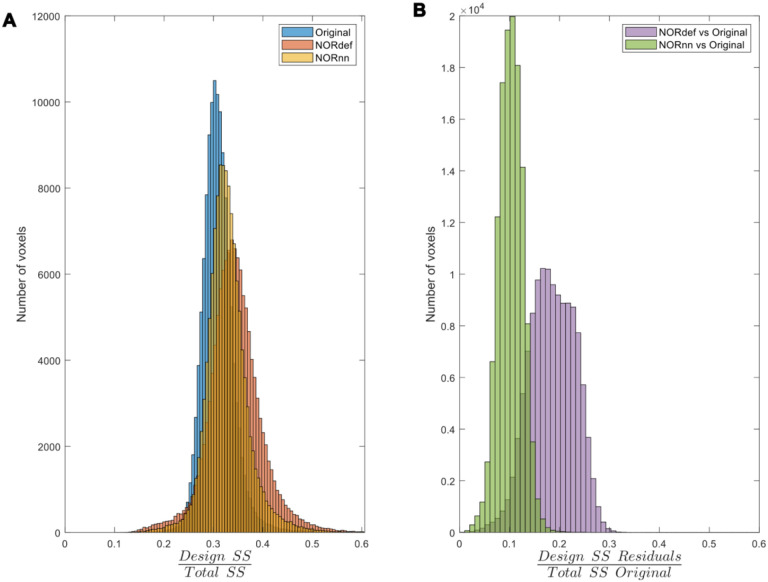
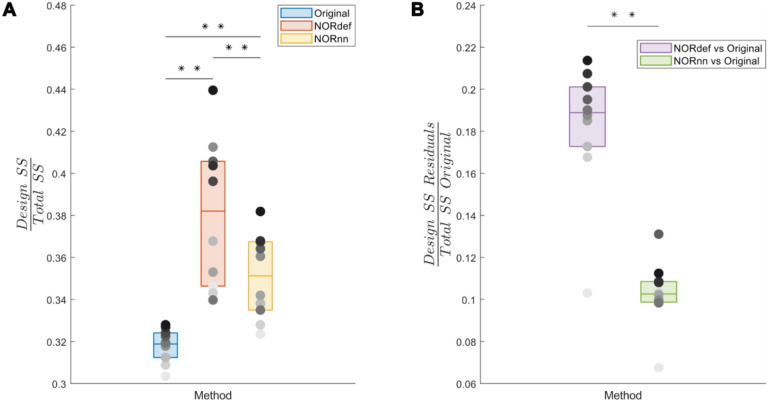
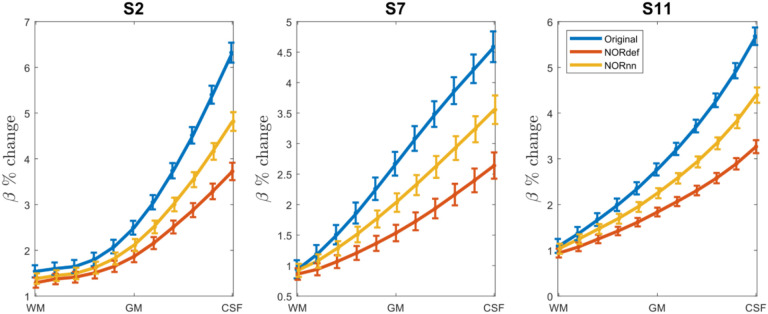
Functional magnetic resonance imaging (fMRI) has emerged as an essential tool for exploring human brain function. Submillimeter fMRI, in particular, has emerged as a tool to study mesoscopic computations. The inherently low signal-to-noise ratio (SNR) at submillimeter resolutions warrants the use of denoising approaches tailored at reducing thermal noise - the dominant contributing noise component in high resolution fMRI. NORDIC PCA is one of such approaches, and has been benchmarked against other approaches in several applications. Here, we investigate the effects that two versions of NORDIC denoising have on auditory submillimeter data. As investigating auditory functional responses poses unique challenges, we anticipated that the benefit of this technique would be especially pronounced. Our results show that NORDIC denoising improves the detection sensitivity and the reliability of estimates in submillimeter auditory fMRI data. These effects can be explained by the reduction of the noise-induced signal variability. However, we also observed a reduction in the average response amplitude (percent signal), which may suggest that a small amount of signal was also removed. We conclude that, while evaluating the effects of the signal reduction induced by NORDIC may be necessary for each application, using NORDIC in high resolution auditory fMRI studies may be advantageous because of the large reduction in variability of the estimated responses.


Conflict of interest statement

Declaration of Competing Interests The authors declare no conflict of interest.

Figures

Figure 1.
Figure 1.. Experimental conditions.
The first three tones are contextual eliciting a strong or weak prediction. The three contextual tones are presented at the same frequencies, albeit in different orders. The fourth tone can either be a high or low target frequency. The fourth tone can either consecutively follow the ascending or descending order (PredH and PredL), or the contextual tones could be deviant (MispredH and MispredL) or the contextual tones could be scrambled (UnpredH and UnpredL). The two predictable sequences were presented ten times per run, whereas the other four conditions were presented four times per run.
Figure 2.
Figure 2.. Single subject overall response to sounds (qFDR<0.01).
From left to right we show the t-maps resulting from a GLM with single trials as predictors of the Original, NORdef and NORnn data on a transversal slice.
Figure 3.
Figure 3.. Single participant correlation analyses.
Box charts display the median and interquartile ranges. A) Spatial correlations of beta maps for each condition. There is no difference in correlations between conditions. The correlation values between NORnn and the Original dataset are higher, indicating that noise removal in NORnn is more conservative than in the NORdef dataset. B) Run-to-run pairwise correlations computed per dataset for the PredH condition. Beta estimates across runs become more similar in both denoised datasets, albeit the estimates are more stable in the denoised data. C) Cross-validated correlation of one run to the average of n-1 runs of the Original data for the PredH condition. Both denoised datasets are more similar to the average of the Original dataset.
Figure 4.
Figure 4.. Group Figure of the same analysis as Figure 3.
A) Across conditions, correlations between NORDIC denoised datasets and the Original data are indistinguishable indicating that number of repetitions do not affect the effect of NORDIC denoising. B) In general, stability of beta estimates increases with the use of NORDIC denoising. Gray dots indicate different participants. C) Average cross validated correlation values of single runs to the average of the Original data, for both predictable conditions. * indicates p<0.05, ** indicates p<0.01.
Figure 5.
Figure 5.. Tonotopic maps.
Frequency preference maps are computed for each dataset and for one example participant we display these maps on an inflated mid-GM surface. Denoising does not seem to alter the frequency preference as the high-low high gradient is visible in all three datasets. The maps computed from the denoised datasets are less noisy.
Figure 6.
Figure 6.. Responses in gray matter confined to regions of interest.
A) Beta values calculated in percent signal change. In each ROI where there is signal present in the Original dataset, we observed a reduction in beta values after denoising. This reduction was lower in NORnn. B) T-statistics are increased after denoising, which was most pronounced in the NORdef dataset. C) Split half correlations were calculated to estimate the stability of beta responses. This revealed that beta values are more stably estimated after denoising. D) T-values are more reliably estimated in NORDIC.
Figure 7.
Figure 7.. Beta difference in relation to tSNR for one representative subject.
A) Betas before and after NORDIC are displayed as a function of mean/standard deviation (tSNRpr). For low tSNRpr values, the betas change in both directions. However, at high tSNRpr, the betas remain relatively similar after NORDIC. The red line indicates the mean beta difference per bin. The black line indicates a beta difference of zero. B) Same as A but for the beta difference between Original minus NORnn betas.
Figure 8.
Figure 8.. Group Figure of beta- and t-value estimates.
A) Average reduction of beta values across participants. B) At the group level, the increase in t-values remains. C) On average, denoising results in a better estimate of beta values calculated with split half correlations in ROIs where there is more signal in the data. D) t-value reliability is generally higher after NORDIC than in the Original data. * indicates p<0.05.
Figure 9.
Figure 9.. Variance partitioning.
A) The amount of variance explained by our design in the data increases consecutively with the use of NORnn and NORdef respectively for one exemplary participant. B) Denoising results in the removal of part of the signal. A proportion of the variance in the residuals after NORDIC can be explained by our stimulation design.
Figure 10.
Figure 10.. Group analysis of the variance explained by the stimulation design.
A) Box charts show the interquartile percentile range of variance explained by the design in the data across participants. After NORDIC denoising, an increased proportion of the variance is explained by the experimental design. NORnn shows an increase in explained variance compared to the original data, but a slightly lower increase than NORdef. B) The proportion of variance explained by the design that is removed from the Original data after NORDIC. NORdef removed a larger proportion of the signal compared to NORnn. * indicates p<0.05, ** indicates p<0.01.
Figure 11.
Figure 11.. Effect of NORDIC across depth.
For three participants we plot the laminar response profiles for the PredH condition. In all plots we can easily identify the draining vein effect. However, we see a gradual decrease in slope for NORnn and NORdef, indicating that NORDIC denoising has a differential effect across depths.

References

    1. Ahveninen J., Chang W.-T., Huang S., Keil B., Kopco N., Rossi S., Bonmassar G., Witzel T., & Polimeni J. R. (2016). Intracortical depth analyses of frequency-sensitive regions of human auditory cortex using 7T fMRI. NeuroImage, 143, 116–127. 10.1016/j.neuroimage.2016.09.010 - DOI - PMC - PubMed
    1. Allen E. J., St-Yves G., Wu Y., Breedlove J. L., Prince J. S., Dowdle L. T., Nau M., Caron B., Pestilli F., Charest I., Hutchinson J. B., Naselaris T., & Kay K. (2022). A massive 7T fMRI dataset to bridge cognitive neuroscience and artificial intelligence. Nature Neuroscience, 25(1), 116–126. 10.1038/s41593-021-00962-x - DOI - PubMed
    1. Cordero-Grande L., Christiaens D., Hutter J., Price A. N., & Hajnal J. V. (2019). Complex diffusion-weighted image estimation via matrix recovery under general noise models. NeuroImage, 200, 391–404. 10.1016/j.neuroimage.2019.06.039 - DOI - PMC - PubMed
    1. De Martino F., Gentile F., Esposito F., Balsi M., Di Salle F., Goebel R., & Formisano E. (2007). Classification of fMRI independent components using IC-fingerprints and support vector machine classifiers. NeuroImage, 34(1), 177–194. 10.1016/j.neuroimage.2006.08.041 - DOI - PubMed
    1. De Martino F., Moerel M., Ugurbil K., Goebel R., Yacoub E., & Formisano E. (2015). Frequency preference and attention effects across cortical depths in the human primary auditory cortex. Proceedings of the National Academy of Sciences, 112(52), 16036–16041. 10.1073/pnas.1507552112 - DOI - PMC - PubMed

Publication types