[Preprint]. 2024 Jan 28:2024.01.27.577133.
doi: 10.1101/2024.01.27.577133.

Multi-Channel smFRET study reveals a Compact conformation of EF-G on the Ribosome

Affiliations

Multi-Channel smFRET study reveals a Compact conformation of EF-G on the Ribosome

Jordan L Johnson et al. bioRxiv. .

Update in

Abstract

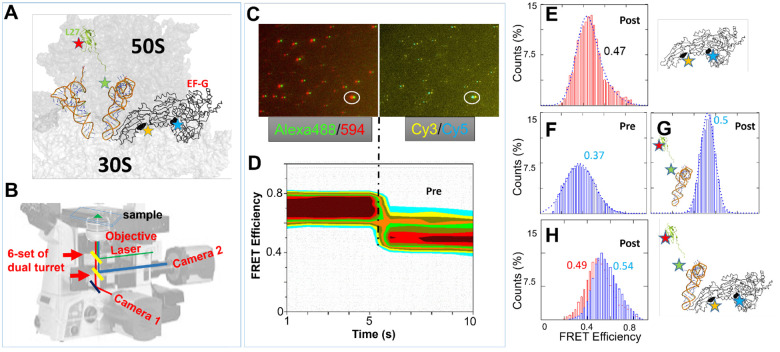
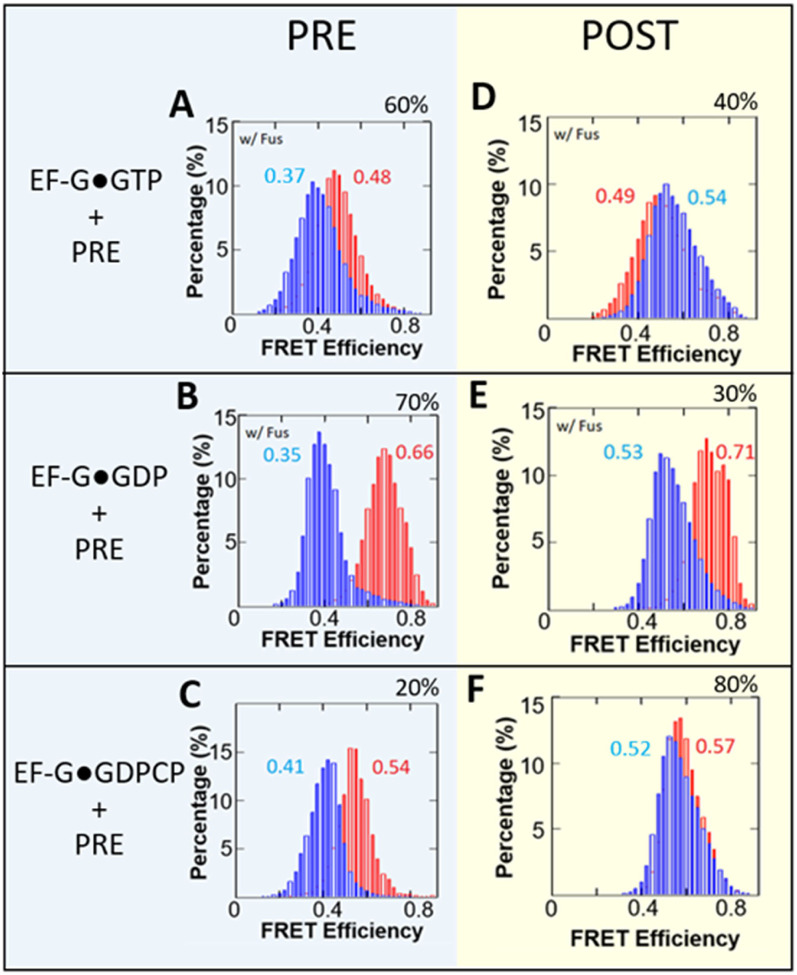
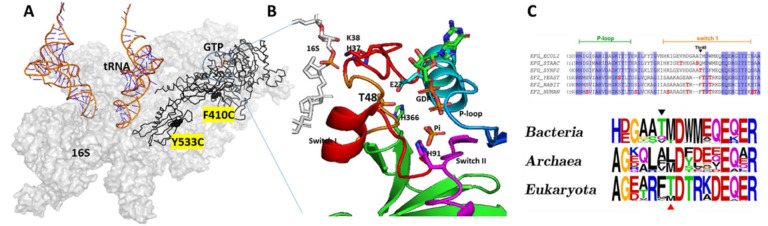
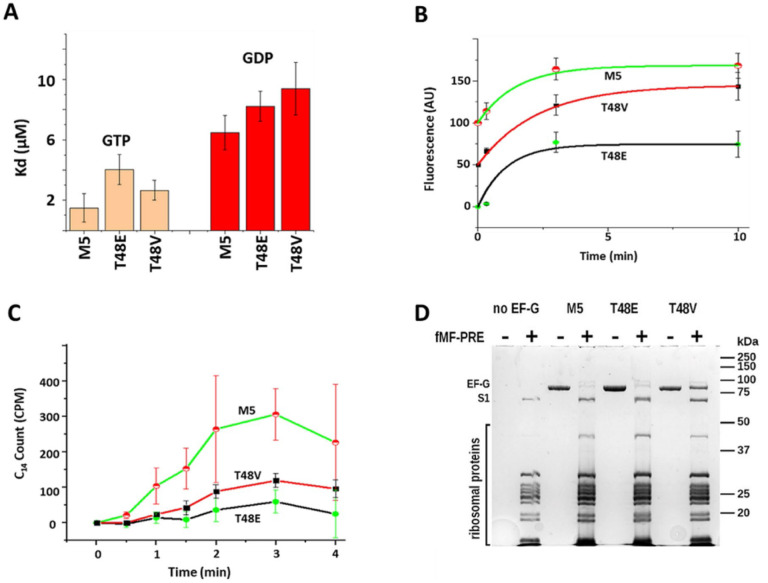
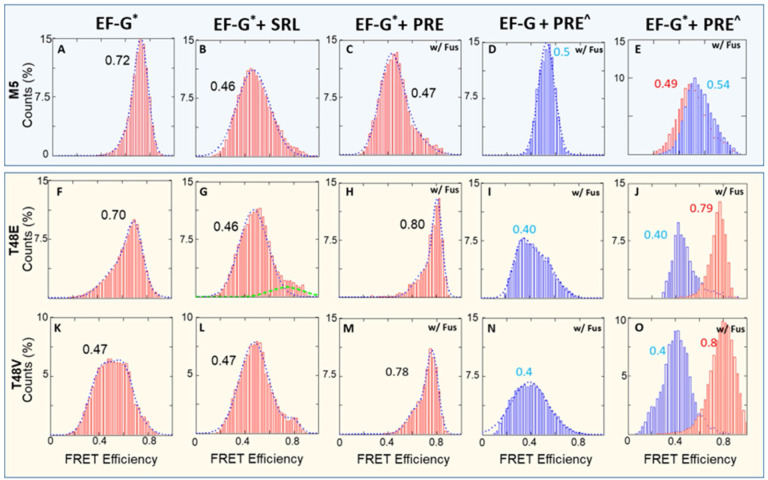
While elongation factor G (EF-G) is crucial for ribosome translocation, the role of its GTP hydrolysis remains ambiguous. EF-G's indispensability is further exemplified by the phosphorylation of human eukaryotic elongation factor 2 (eEF2) at Thr56, which inhibits protein synthesis globally, but its exact mechanism is not clear. In this study, we developed a multi-channel single-molecule FRET (smFRET) microscopy methodology to examine the conformational changes of E. coli EF-G induced by mutations that closely aligned with eEF2's Thr56 residue. We utilized Alexa 488/594 double-labeled EF-G to catalyze the translocation of fMet-Phe-tRNAPhe-Cy3 inside Cy5-L27 labeled ribosomes, allowing us to probe both processes within the same complex. Our findings indicate that in the presence of either GTP or GDPCP, wild-type EF-G undergoes a conformational extension upon binding to the ribosome to promote normal translocation. On the other hand, T48E and T48V mutations did not affect GTP/GDP binding or GTP hydrolysis, but impeded Poly(Phe) synthesis and caused EF-G to adopt a unique compact conformation, which wasn't observed when the mutants interact solely with the sarcin/ricin loop. This study provides new insights into EF-G's adaptability and sheds light on the modification mechanism of human eEF2.

Keywords: compact EF-G; induced-fit; multi-channel smFRET; ribosome translocation; single molecule FRET.


Conflict of interest statement

DECLARATION OF INTERESTS The authors declare no competing interests.

Figures

Figure 1.
Figure 1.
TIRF based smFRET instrument and representative data. Red histograms represent conformational changes within EF-G while blue histograms represent the changes between RbL27-tRNA. (A) Locations of the FRET pairs to simultaneously monitor ribosomal translocation and conformational changes in EF-G (positions of dyes are shown as stars in L27, tRNAPhe, and EF-G), and anticipated FRET diagrams for EF-G transition from pre- to post-translocation state. (B) Configuration of dual-turret/dual-camera TIRF microscope used in smFRET experiments. (C) An example of multi-channel dual camera imaging of Alexa488/Alexa594-labeled EF-G bound to the ribosome with Cy3-labeled Phe~tRNAPhe and Cy5-labeled L27 (D) 2D contour FRET efficiency diagram representing the imaged FRET state depicted in C.(E) FRET efficiency histogram of labeled EF-G in complex with unlabeled ribosome. (F-G) FRET efficiency histograms of Pre- and Post- translocation ribosomes depicted by L27-tRNA labeled ribosome complexes. (H) FRET efficiency histogram of both EF-G and Post-translocation ribosome in the same complex. The particle counts for the FRET efficiency histograms can be found in Table S1.
Figure 2.
Figure 2.
smFRET efficiency histograms for M5 EF-G catalyzed translocation. Red histograms represent conformational changes within EF-G while blue histograms represent the changes between RbL27-tRNA. Combined histograms are from a singular experiment. (A-C) FRET efficiency histograms for pre-translocation ribosome-bound with labeled EF-G. (D-F) FRET efficiency histograms for post-translocation ribosome-bound with labeled EF-G. (A,D) Experiments with EF-G•GTP; (B,E) Experiments with EF-G•GDP; (C,F) Experiments with EF-G•GDPCP. Experiments with EF-G•GTP and EF-G•GDP employed fusidic acid (Fus) to stabilize EF-G binding on the complexes. Ribosomal subpopulations of pre- or post-translocated ribosomes, expressed as a percentage, were obtained via sorting using predetermined FRET efficiencies for each state. The percentages are the ribosome translocation yields under EF-G in complex with the different nucleotides. The particle counts for the FRET efficiency histograms can be found in Table S1.
Figure 3.
Figure 3.
EF-G alignment, mutations, and smFRET labeling positions. (A) Topology of EF-G, tRNA and 16 S rRNA. The GTP binding site, and the two cysteines for smFRET experiments are highlighted. (B) Closeup view at the GTP binding pockets with some key elements and residues manifested. (C) Multiple sequence alignment of P-loop and switch I region and frequency sequence logo plots for a part of switch 1 region adjacent to the mutagenized threonine residue. Amino acid residues are shaded according to BLOSUM62 conservation score, darker shading or bigger font corresponds to higher conservation.
Figure 4.
Figure 4.
Functional assays on M5 and Thr48 mutated EF-G. (A) GTP/GDP dissociation constants of EF-G obtained by equilibrium fluorescent titration of EF-G variants with mant-GDP and mant-GTP at 20°C. (B) Ribosome-induced GTP hydrolysis monitored by a Transcreener GDP FI Assay system (BellBrooks Labs) at 20°C. Traces are shifted vertically by 50 units for clarity in display. (C) Kinetics of poly(U)-dependent poly([14C]Phe) synthesis at 37°C. The plots represent time-dependent synthesizing of [14C] labeled poly(Phe). (D) SDS-PAGE analysis of EF-G’s co-sedimentation with ribosomal pre-translocation complexes.
Figure 3.
Figure 3.
smFRET efficiency histograms for M5 and mutated EF-Gs. Red histograms represent conformational changes within EF-G while blue histograms represent the changes between RbL27-tRNA. (A-E) FRET histograms for EF-G variants M5•GTP in free form and bound with SRL, unlabeled pre-Rb, unlabeled EF-G/labeled pre-Rb, and labeled pre-Rb. (E-H) FRET histograms for EF-G variants T48E•GTP in free form and bound with SRL, unlabeled pre-Rb, unlabeled EF-G/labeled pre-Rb, and labeled pre-Rb. (I-L) FRET histograms for EF-G variants T48V•GTP in free form and bound with SRL, unlabeled pre-Rb, unlabeled EF-G/labeled pre-Rb, and labeled pre-Rb. The particle counts for the FRET efficiency histograms can be found in Table S1. * = labelling with Alexa 488/594; ^ = labelling with Cy3/Cy5.

References

    1. Schmeing T. M., Ramakrishnan V., What recent ribosome structures have revealed about the mechanism of translation. Nature 461, 1234–1242 (2009). - PubMed
    1. Connell S. R. et al. , Structural basis for interaction of the ribosome with the switch regions of GTP-bound elongation factors. Mol Cell 25, 751–764 (2007). - PubMed
    1. Gonzalez-Garcia J. S., A model for ribosome translocation based on the alternated displacement of its subunits. Eur Biophys J 52, 175–187 (2023). - PubMed
    1. Schuwirth B. S. et al. , Structures of the bacterial ribosome at 3.5 A resolution. Science 310, 827–834 (2005). - PubMed
    1. Frank J., Agrawal R. K., A ratchet-like inter-subunit reorganization of the ribosome during translocation. Nature 406, 318–322 (2000). - PubMed

Publication types