[Preprint]. 2024 Jan 27:2024.01.25.577254.
doi: 10.1101/2024.01.25.577254.

Patient derived model of UBA5-associated encephalopathy identifies defects in neurodevelopment and highlights potential therapies

Affiliations

Patient derived model of UBA5-associated encephalopathy identifies defects in neurodevelopment and highlights potential therapies

Helen Chen et al. bioRxiv. .

Update in

Abstract

UBA5 encodes for the E1 enzyme of the UFMylation cascade, which plays an essential role in ER homeostasis. The clinical phenotypes of UBA5-associated encephalopathy include developmental delays, epilepsy and intellectual disability. To date, there is no humanized neuronal model to study the cellular and molecular consequences of UBA5 pathogenic variants. We developed and characterized patient-derived cortical organoid cultures and identified defects in GABAergic interneuron development. We demonstrated aberrant neuronal firing and microcephaly phenotypes in patient-derived organoids. Mechanistically, we show that ER homeostasis is perturbed along with exacerbated unfolded protein response pathway in cells and organoids expressing UBA5 pathogenic variants. We also assessed two gene expression modalities that augmented UBA5 expression to rescue aberrant molecular and cellular phenotypes. Our study provides a novel humanized model that allows further investigations of UBA5 variants in the brain and highlights novel systemic approaches to alleviate cellular aberrations for this rare, developmental disorder.


Conflict of interest statement

Competing interests: The authors have declared that no conflict of interest exists.

Figures

Figure 1.
Figure 1.. UBA5 pathogenic variants and cell models included in this study.
(A) Schematic representation of UBA5 structure with functional domains, UIS (UFM1-interacting motif); UBS (UFC1-binding sequence). All UBA5-DEE patients sharing the p.A371T variant (yellow) are listed. The second allele being either premature truncation (red) or splicing defect variants (blue) predicted to undergo nonsense mediated decay or missense (purple). Each red, blue or purple symbol represents one patient. (B) Family pedigree of probands included in this study. Circle: female; square: male; filled: affected proband. (C) Genotypes of UBA5 cell models used in this study; all iPSC/CO are derived from patient or parent fibroblasts.
Figure 2.
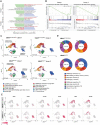
Figure 2.. Bulk and single-cell RNA sequencing reveal a deficit in GABAergic interneurons processes in 100-day old CO derived from UBA5 proband.
(A) Normalized enrichment scores of gene sets between proband and control CO from families 1 (UBA5A371T/A123Gfs*4) and 2 (UBA5A371T/Q267*) as determined by GSEA. The top five pathways from GO Biological Process and Wiki pathways databases are shown. (B) The enrichment plots for GABA receptor signaling from Wiki pathways in families 1 (UBA5A371T/A123Gfs*4) and 2 (UBA5A371T/Q267*). (C) UMAP plot showing unbiased clustering of cell types, 31,950 cells. (D) Organoid cell type contribution for between genotypes, cluster identify from (C) as indicated. (E) Feature plots showing reduced expression of GABAergic interneuron genes in UBA5 proband compared to control CO (both clones are combined in each plot).
Figure 3.
Figure 3.. GABAergic markers are reduced in 100-day old CO derived from UBA5 probands.
(A) Transcript level of GABAergic markers are significantly reduced in CO derived from UBA5 probands compared to control CO, normalized to UBA5Wt/A371T. Each data point represents three CO, plotted as mean ± SD. *P<0.05, **P<0.01, ***P<0.001 and ****P<0.0001. (B) Immunoblot analysis shows reduced expression of both isoforms of UBA5 and confirms reduced expression of GAD2 in CO derived from UBA5 probands compared to control CO. GAPDH served as loading control. All images shown in the manuscript are representative images of 3 independent experiments. (C) Staining for cortical layer identities of CO shows later-born surface-layer neurons (SATB2) populate the superficial regions of the organoid, whereas early-born deep-layer neurons (CTIP2) populate the inner regions of the organoid. Scale bars: 50 μm. (D) Proportion of cells expressing SATB2 or CTIP2 in CO. Each data point represents one CO, plotted as mean ± SD. ns: not significant.
Figure 4.
Figure 4.. CO derived from UBA5 proband showed reduced size and aberrant network activity.
(A) Growth trajectory of CO as measured by CO diameter. The same 11–15 CO were measured from D50 to 120, plotted as mean ± SD. *P<0.05 and **P<0.01. ns: not significant. (B) Functional characterization of D110 CO derived from UBA5 probands using MEA showing changes in weighted mean firing rate, averaged burst frequency and network burst frequency compared to control CO. Each data point represents one CO, plotted as mean ± SD. *P<0.05, **P<0.01 and ***P <0.001. (C) Representative raster plot of neural network activity. Each black tick indicates the time a spike occurred; blue tick indicates the spikes are part of a burst and magenta rectangles indicate a network burst event. Each row represents a recording from an electrode.
Figure 5.
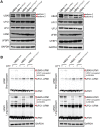
Figure 5.. Characterization of the ufmylation pathway in U-87 MG cells expressing UBA5 pathogenic variants.
(A) Immunoblot analysis of various components of the ufmylation pathway, showing decreased UBA5 levels for both isoforms in cells expressing UBA5A371T/F292* and UBA5A371T/R55H, with no changes observed in cells expressing UBA5A371T/A371T compared to wildtype. GAPDH served as loading control. All images shown in the manuscript are representative images of 3 independent experiments. (B) Immunoblot analysis of UFM1 conjugates with and without reducing agent, DTT. GAPDH served as loading control. All images shown in the manuscript are representative images of 4 independent experiments.
Figure 6.
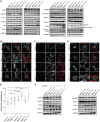
Figure 6.. U-87 MG cells expressing UBA5 pathogenic variants exhibit perturbed ER homeostasis.
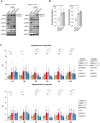
(A) Immunoblot analysis showing elevated expression of various components of the UPR pathway in cells expressing UBA5A371T/F292* and UBA5A371T/R55H, with no changes observed in cells expressing UBA5A371T/A371T compared to wildtype. GAPDH served as loading control. All images shown in the manuscript are representative images of 3 independent experiments. (B- D) Representative images of immunofluorescent staining with (B) ATF6 and phalloidin, (C) CHOP and phalloidin and (D) calnexin and phalloidin in U-87 MG cells. Scale bars: 10 μm. (E) Quantitation of relative ER area as measured by calnexin area/phalloidin area from (D). Each data point represents one image, plotted as mean ± SD. ***P<0.001, ****P<0.0001 and ns: not significant. (F) Immunoblot analysis showing elevated expression of various components of the UPR pathway in 100-day old proband CO. GAPDH served as loading control. All images shown in the manuscript are representative images of 3 independent experiments.
Figure 7.
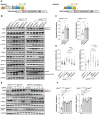
Figure 7.. Genetic rescue of UBA5 expression restores ER homeostasis in U-87 MG cells expressing UBA5 pathogenic variants.
(A) Schematic representation of synthetic SINEUP. SINEUP binding domain (yellow box: BD; 72nt) overlaps, in antisense orientation to sense coding sequence UBA5 mRNA (grey box). SINEUP effector domain (blue box: ED; 167nt) contains an inverted SINBE2 element. Other components include partial ALU repeats (brown box: ALU; 45nt), tailing region (white box; 827nt) and a poly (A) tail (orange box: AAA). (B) Immunoblot analysis showed restored expression UBA5 and UPR pathway in cells following 72 hr of SINEUP treatment. NTC served as negative control for SINEUP. GAPDH served as loading control. All images shown in the manuscript are representative images of 3–5 independent experiments. (C) Quantification of UBA5 protein abundance following SINEUP treatment, first normalized to GAPDH, and then to averaged NTC treatment. Each data point represents one experiment, plotted as mean ± SD. *P<0.05. (D) Quantitation of relative ER area as measured by calnexin area/phalloidin area in cells following 72 hr of SINEUP treatment showed reduction in ER expansion. NTC served as negative control for SINEUP. Each data point represents one image, plotted as mean ± SD. **P<0.01, ***P<0.001, ****P<0.0001 and ns: not significant. (E) Immunoblot analysis showed restored expression UBA5 and UPR pathway in cells following 72 hr of sgRNA treatment. NTC served as negative control for sgRNA. GAPDH served as loading control. All images shown in the manuscript are representative images of 3 independent experiments. (F) Quantification of UBA5 protein abundance following sgRNA treatment, first normalized to GAPDH and then to NTC treatment. Each data point represents one experiment, plotted as mean ± SD. *P<0.05, **P<0.01 and ***P < 0.001.
Figure 8.
Figure 8.. Genetic rescue of UBA5 expression by SINEUP rescues electrophysiological defects in proband CO.
(A) Immunoblot analysis restored expression UBA5 and UPR pathway in 100-day old CO derived from UBA5 probands after 72 hr of SINEUP treatment. NTC served as negative control for SINEUP. GAPDH served as loading control. All images shown in the manuscript are representative images of 3 independent experiments. (B) Quantification of UBA5 protein abundance following SINEUP treatment, first normalized to GAPDH, and then to averaged NTC treatment. Each data point represents one experiment, plotted as mean ± SD. *P<0.05. (C) Weighted mean firing rate of proband CO as measured by MEA. The same set of 125-day old CO were measured 5 days prior (D-5) to SINEUP treatment (D0), then measured at D2, D3, D4 and D12 after SINEUP treatment. Each data point represents one CO, plotted as mean ± SD. *P<0.05, **P<0.01 and ns: not significant.

References

    1. Mignon-Ravix C. et al., Abnormal function of the UBA5 protein in a case of early developmental and epileptic encephalopathy with suppression-burst. Hum Mutat 39, 934–938 (2018). - PubMed
    1. Low K. J. et al., Hemizygous UBA5 missense mutation unmasks recessive disorder in a patient with infantile-onset encephalopathy, acquired microcephaly, small cerebellum, movement disorder and severe neurodevelopmental delay. Eur J Med Genet 62, 97–102 (2019). - PubMed
    1. Daida A. et al., Biallelic loss-of-function UBA5 mutations in a patient with intractable West syndrome and profound failure to thrive. Epileptic Disord 20, 313–318 (2018). - PubMed
    1. Briere L. C. et al., A description of novel variants and review of phenotypic spectrum in UBA5-related early epileptic encephalopathy. Cold Spring Harb Mol Case Stud 7, (2021). - PMC - PubMed
    1. Arnadottir G. A. et al., Compound heterozygous mutations in UBA5 causing early-onset epileptic encephalopathy in two sisters. BMC Med Genet 18, 103 (2017). - PMC - PubMed

Publication types