[Preprint]. 2024 Jan 26:2024.01.23.576771.
doi: 10.1101/2024.01.23.576771.

Epidermal ZBP1 stabilizes mitochondrial Z-DNA to drive UV-induced IFN signaling in autoimmune photosensitivity

Affiliations

Epidermal ZBP1 stabilizes mitochondrial Z-DNA to drive UV-induced IFN signaling in autoimmune photosensitivity

Benjamin Klein et al. bioRxiv. .

Update in

Abstract

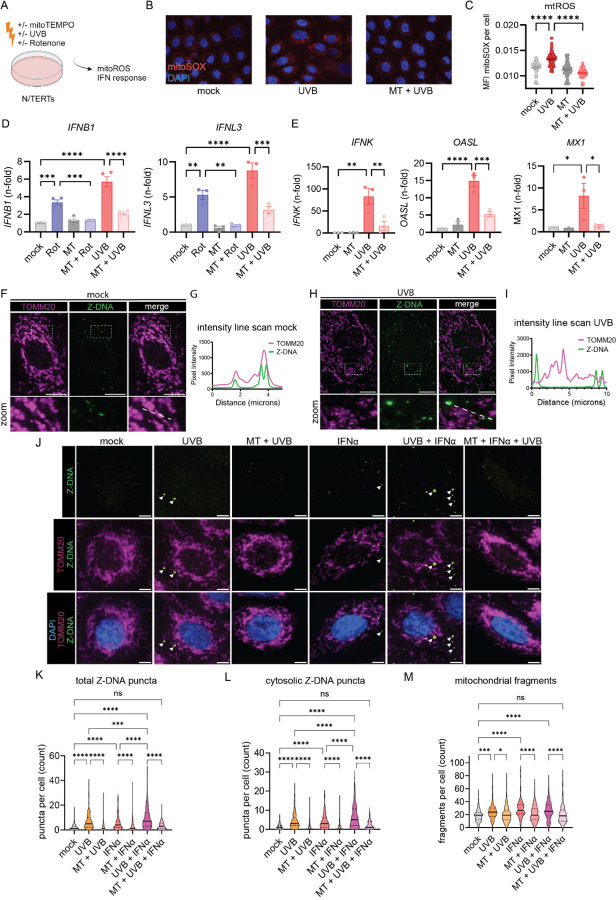
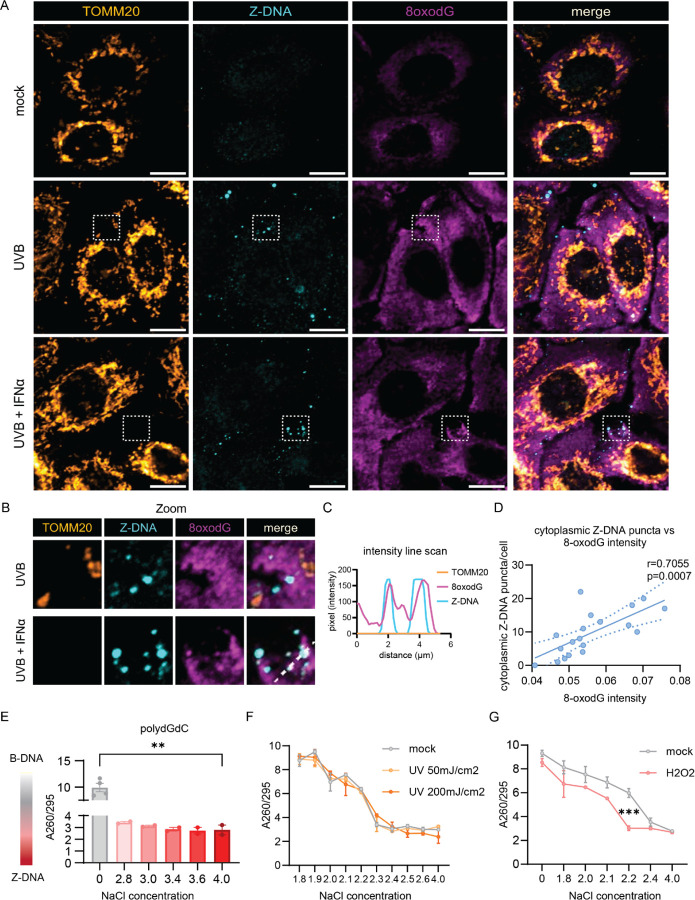
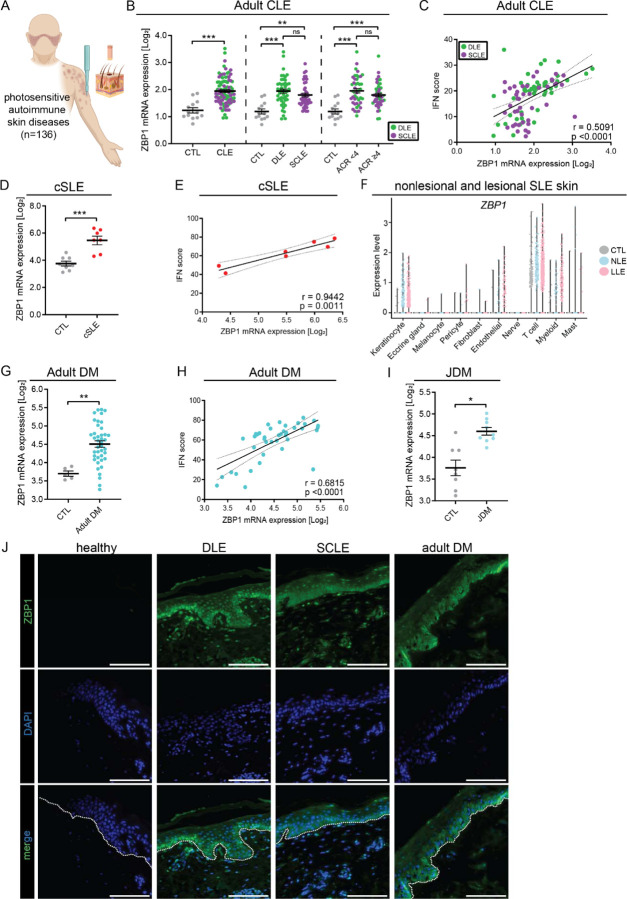
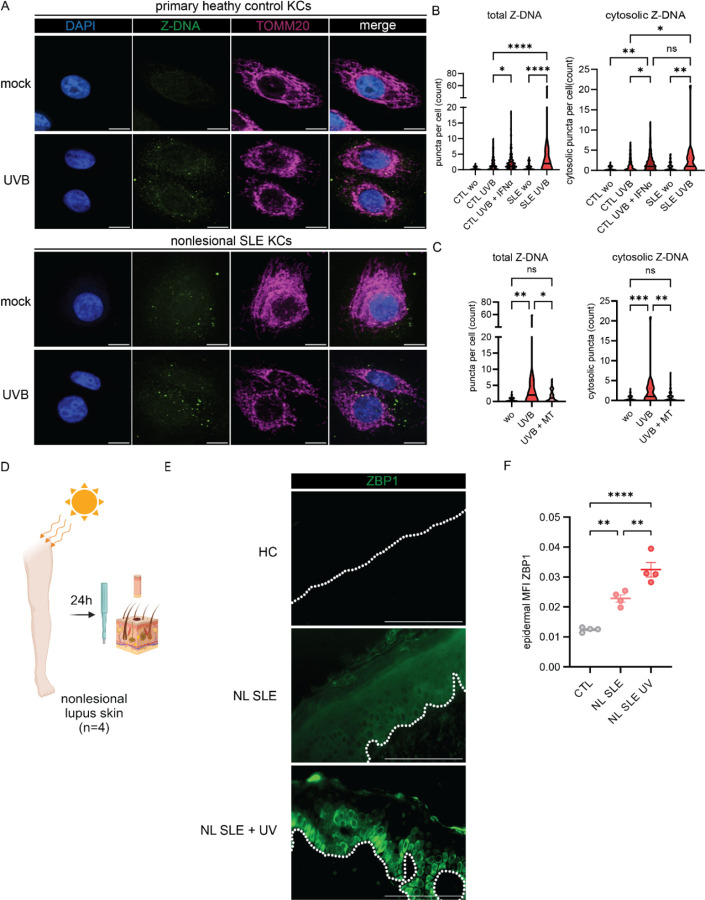
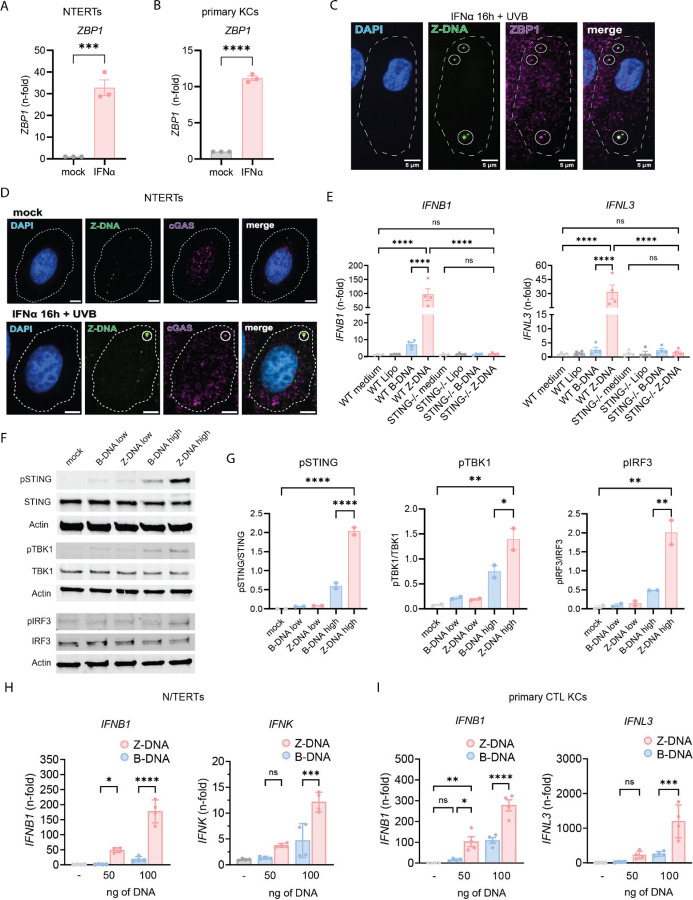
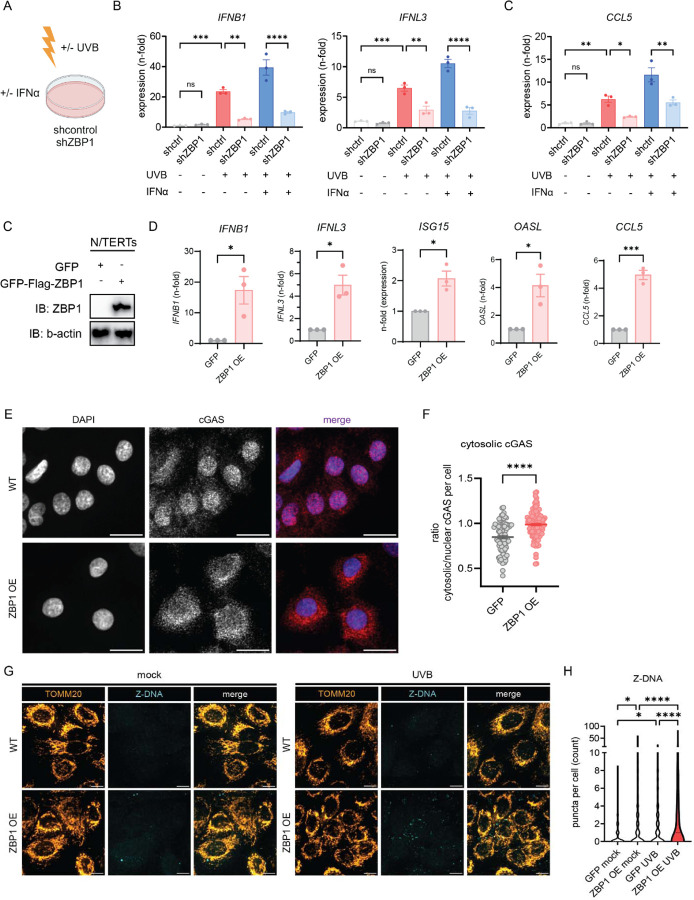
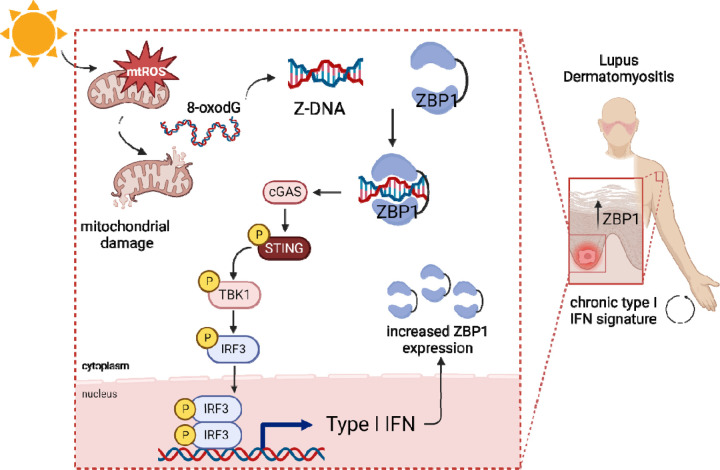
Photosensitivity is observed in numerous autoimmune diseases and drives poor quality of life and disease flares. Elevated epidermal type I interferon (IFN) production primes for photosensitivity and enhanced inflammation, but the substrates that sustain and amplify this cycle remain undefined. Here, we show that IFN-induced Z-DNA binding protein 1 (ZBP1) stabilizes ultraviolet (UV)B-induced cytosolic Z-DNA derived from oxidized mitochondrial DNA. ZBP1 is significantly upregulated in the epidermis of adult and pediatric patients with autoimmune photosensitivity. Strikingly, lupus keratinocytes accumulate extensive cytosolic Z-DNA after UVB, and transfection of keratinocytes with Z-DNA results in stronger IFN production through cGAS-STING activation compared to B-DNA. ZBP1 knockdown abrogates UV-induced IFN responses, whereas overexpression results in a lupus-like phenotype with spontaneous Z-DNA accumulation and IFN production. Our results highlight Z-DNA and ZBP1 as critical mediators for UVB-induced inflammation and uncover how type I IFNs prime for cutaneous inflammation in photosensitivity.


Conflict of interest statement

Competing interests: JMK has received grant support from Q32 Bio, Celgene/Bristol-Myers Squibb, Ventus Therapeutics, Rome Therapeutics, and Janssen. JMK has served on advisory boards for AstraZeneca, Bristol-Myers Squibb, Eli Lilly, EMD serrano, Gilead, GlaxoSmithKline, Aurinia Pharmaceuticals, Rome Therapeutics, and Ventus Therapeutics. JEG has received support from Eli Lilly, Janssen, BMS, Sanofi, Prometheus, Almirall, Kyowa-Kirin, Novartis, AnaptysBio, Boehringer Ingelheim, Regeneron, AbbVie, and Galderma.

Figures

Figure 1.
Figure 1.. UVB light causes mtROS dependent IFN responses accompanied by cytosolic Z-DNA release derived from mitochondria.
A. Experimental approach. B. Representative images from N/TERTs treated +/− mitoTEMPO (MT) +/− UVB irradiation stained with MitoSOXred and Hoechst33342. C. Quantification of MitoSOX intensity per cell using CellProfiler software. D. N/TERTs were treated with either rotenone, MT or UVB for 6h. Gene expression of IFNB1 (n=44) and IFNL3 (n=3) was determined by qPCR. E. Gene expression of IFNK, MX1 and OASL (n=3) +/− mitoTEMPO +/− UVB 24h after UVB exposure. F. Representative confocal microscopy from N/TERTs of TOMM20, Z-DNA, and DAPI without stimulation. G. Line scan analysis of the line in F. H. Representative confocal microscopy from N/TERTs of TOMM20 and Z-DNA 3h after UVB exposure. I. Line scan analysis of the dotted white line in H. J. Representative confocal images from N/TERTs of TOMM20, Z-DNA, DAPI +/− mitoTEMPO, pretreatment with IFNα or 3h after UVB. Scale bar 5μm. K-L. Quantification of Z-DNA puncta using CellProfiler software. M. Mitochondrial fragments (objects <1µm2 with circularity > 0.6) using CellProfiler. Mean + SEM or violin plots with mean + quartiles of n≥3 independent experiments. P-values were calculated using ordinary one-way ANOVA followed by Sidak’s multiple comparison test. *P < 0.05; **P < 0.01; ***P < 0.001; ****P < 0.0001.
Figure 2.
Figure 2.. UVB promotes Z-DNA formation via oxidative DNA damage
A. Representative confocal images of the mitochondrial outer membrane (TOMM20), Z-DNA and 8oxodG in N/TERTs at baseline, 3h after UVB exposure with or without IFNα preincubation for 16h. Scale bar 10μm. B. Magnified region from (A) highlighting proximity and colocalization of Z-DNA with intense 8oxodG staining in areas outside of mitochondria. C. Representative line scan from Z-DNA puncta in (B) highlighting the absence of TOMM20 in spots of Z-DNA accumulation. D. Correlation of the Z-DNA puncta per cell with matched average 8oxodG per cell. E. Change of A260/295 as a measure of B-DNA (high ratio~10) vs Z-DNA (lower ratio of ~3) formation is graphed comparing low salt vs. high salt conditions after 2h at 37ºC. F. Naked polydGdC was irradiated with indicated UVB doses and incubated in indicated [NaCl] as in E. to induce Z-DNA. No shift to a lower ratio in lower [NaCl] was detected after UVB light exposure. G. To test the effect of oxidation on propensity for Z-DNA formation, polydGdC was treated with H2O2 (1mM) for 2h at 37ºC and subjected to varying salt concentrations as in E. Buffers with indicated NaCl and H2O2 without DNA served as blanks for the assay.
Figure 3.
Figure 3.. ZBP1 is overexpressed in the epidermis of autoimmune photosensitive diseases.
A. Graphical representation of data acquisition from lesional skin microarrays. B. ZBP1 expression in lesional cutaneous lupus (CLE) (n=90) compared to healthy control (CTL) (n=13) (left), by lesion subtype (discoid lupus erythematosus (DLE) or subacute cutaneous lupus erythematosus (SCLE), middle) and based on the presence or absence of systemic lupus via >4 1997 ACR criteria (right). C. Correlation of ZBP1 expression in CLE with IFN score, linear regression. D. ZBP1 expression in childhood onset systemic lupus erythematosus (cSLE, n=7) compared to CTL (n=8). E. Correlation of ZBP1 expression with IFN score in cSLE. F. Violin plots showing ZBP1 expression from scRNA sequencing across cutaneous cell types from nonlesional lupus skin (NLE, n=14), lesional lupus skin (LLE, n=14) compared to CTL (n=14). G. Expression of ZBP1 in adult dermatomyositis (DM) (n=41) and H. Correlation with IFN score by linear regression. I. ZBP1 expression in juvenile dermatomyositis (jDM, n=9) compared to CTL (n=8). J. Representative images of tissue imunofluoresence of ZBP1 in CTL (n= 7), DLE (n=8), SCLE (n=5) and DM (n=6). Dotted white line indicates the dermo-epidermal junction. Scale bar =100μm. Mean + SEM. * = q < 0.05; ** = q < 0.01; *** = q < 0.0001, by Studenťs unpaired t-test.
Figure 4.
Figure 4.. Nonlesional lupus keratinocytes exhibit cytosolic Z-DNA accumulation at baseline and after UVB exposure that is prevented by mitoTEMPO.
A. Representative images of confocal microscopy staining for Z-DNA, TOMM20 and counterstaining with DAPI at baseline and after UVB exposure and preconditioning with IFNα (1000U/ml for 16h prior to UVB exposure) in primary healthy control KCs (n=4) and SLE KCs (n=3). B-C. Quantification of total and cytosolic Z-DNA puncta after UVB with or without preincubation with mitoTEMPO or IFNα using CellProfiler. D. Healthy controls (HC), SLE patients +/− UVB (n=4 each group) were biopsied 24h after UV exposure. E. Representative images of ZBP1 staining in HC, nonlesional SLE skin (NL SLE) and NL SLE after UV exposure. Dotted white line indicates the dermo-epidermal junction. Scale bar =100μm F. Quantification of mean fluorescence intensity (MFI) of epidermal ZBP1 using open source CelProfiler software. Ordinary one–way ANOVA followed by Sidak’s multiple comparison test. Mean and SEM. *P<0.05, **P<0.01, ***P<0,001, ****P<0.0001.
Figure 5.
Figure 5.. Z-DNA binds to ZBP1, activates the cGAS-STING pathway and has stronger immunostimulatory properties than B-DNA.
A-B. Gene expression of ZBP1 after IFNα stimulation in N/TERTs (A.) and primary healthy control KCs (B.) compared to β-Actin. C. Representative image of confocal microscopy from N/TERTs preincubated with IFNα (1000U/ml) and then irradiated with UVB exposure stained for Z-DNA, ZBP1, and DAPI 3h after UVB exposure. Scale bar 5μm. D. Representative images of IFNα-treated N/TERTs stained for Z-DNA, cGAS and DAPI 3h after UVB exposure. Cellular outline was drawn based on CellTrackerRed counterstain. E. Gene expression at 6h of indicated genes from N/TERTs and STING KO N/TERTs treated with Lipofectamine2000 alone or transfected with Z-DNA or B-DNA (500ng/ml). F. Representative Western Blot (n=2) of indicated proteins from N/TERTs transfected with 50ng (low) or 500ng (high) of Z-DNA (polydGdC) or B-DNA using Lipofectamine 2000. Lysates harvested 4h after transfection. G. Quantification of the abundance of pSTING, pIRF3, and pTBK1 relative to unphosphorylated proteins in transfected KCs. H. N/TERTs were transfected as in E and gene expression was measured 6h after DNA transfection (n=3). I. Primary control KCs (n=3) were transfected and analyzed as in H. Unpaired t-test and Ordinary one–way ANOVA followed by Sidak’s multiple comparison test. Mean and SEM. *P<0.05, **P<0.01, ***P<0,001, ****P<0.0001.
Figure 6.
Figure 6.. ZBP1 regulates UVB-induced type I and III IFN responses in human keratinocytes.
A-B. Knockdown of ZBP1 in N/TERTs was performed using a lentivirus expressing either shRNA targeting Human ZBP1 or shcontrol. Baseline, UV, and UV+IFNα induced gene expression were assessed for (A.) Type I and III IFN (6h after UVB) and (B.) CCL5, a known ISG (24h after UVB); n=3 C. Generation of GFP/3XFLAG-tagged N/TERTs with overexpression of ZBP1 compared to GFP-tag only. D. IFN genes and ISGs were assessed by RT-qPCR at baseline in ZBP1 overexpressing cells (ZBP1 OE) or GFP-expressing control N/TERTs (GFP). E. Representative greyscale and merged images of confocal microscopy from N/TERTs with GFP or GFP-ZBP1 N/TERTs for cGAS (red) and DAPI (blue). Scale bar 20μm. F. Quantification of cytosolic cGAS using ratio of cGAS MFI in the cytosol versus nuclear cGAS MFI using CellProfiler. G. Representative confocal images of GFP-tagged N/TERTs or ZBP1 overexpressing N/TERTs of TOMM20 and Z-DNA at baseline and 3h after UVB exposure. Scale bar 10μm. Ordinary one –way ANOVA followed by Sidak’s multiple comparison test. Mean and SEM. *P<0.05, **P<0.01, ***P<0,001, ****P<0.0001.
Figure 7.
Figure 7.. Graphical abstract
UV light promotes mitochondrial ROS formation and mitochondrial damage which results in release of oxidized DNA that can promote Z-DNA conformation. In lupus and dermatomyositis skin, Z-DNA i stabilized by ZBP1 and further activates the cGAS-STING-TBK1-IRF3 pathway to promote type I IFN secretion. This results in more ZBP1 expression, explaining the autocrine loop of type I IFN that i observed in photosensitive autoimmune diseases after UV light.

References

    1. Wenzel J., Cutaneous lupus erythematosus: new insights into pathogenesis and therapeutic strategies. Nature Reviews Rheumatology 15, 519–532 (2019). - PubMed
    1. Estadt S. N., Maz M. P., Musai J., Kahlenberg J. M., Mechanisms of Photosensitivity in Autoimmunity. J Invest Dermatol 142, 849–856 (2022). - PMC - PubMed
    1. Sarkar M. K. et al., Photosensitivity and type I IFN responses in cutaneous lupus are driven by epidermal-derived interferon kappa. Ann Rheum Dis 77, 1653–1664 (2018). - PMC - PubMed
    1. Sim J. H. et al., Immune Cell–Stromal Circuitry in Lupus Photosensitivity. The Journal of Immunology 206, 302–309 (2021). - PMC - PubMed
    1. Foering K. et al., Characterization of clinical photosensitivity in cutaneous lupus erythematosus. Journal of the American Academy of Dermatology 69, 205–213 (2013). - PMC - PubMed

Publication types