. 2024 Apr;44(4):898-914.
doi: 10.1161/ATVBAHA.123.320274. Epub 2024 Feb 8.

Secreted Protein Profiling of Human Aortic Smooth Muscle Cells Identifies Vascular Disease Associations

Affiliations

Secreted Protein Profiling of Human Aortic Smooth Muscle Cells Identifies Vascular Disease Associations

Rédouane Aherrahrou et al. Arterioscler Thromb Vasc Biol. 2024 Apr.

Abstract

Background: Smooth muscle cells (SMCs), which make up the medial layer of arteries, are key cell types involved in cardiovascular disease, the leading cause of mortality and morbidity worldwide. In response to microenvironment alterations, SMCs dedifferentiate from a contractile to a synthetic phenotype characterized by an increased proliferation, migration, production of ECM (extracellular matrix) components, and decreased expression of SMC-specific contractile markers. These phenotypic changes result in vascular remodeling and contribute to the pathogenesis of cardiovascular disease, including coronary artery disease, stroke, hypertension, and aortic aneurysms. Here, we aim to identify the genetic variants that regulate ECM secretion in SMCs and predict the causal proteins associated with vascular disease-related loci identified in genome-wide association studies.

Methods: Using human aortic SMCs from 123 multiancestry healthy heart transplant donors, we collected the serum-free media in which the cells were cultured for 24 hours and conducted liquid chromatography-tandem mass spectrometry-based proteomic analysis of the conditioned media.

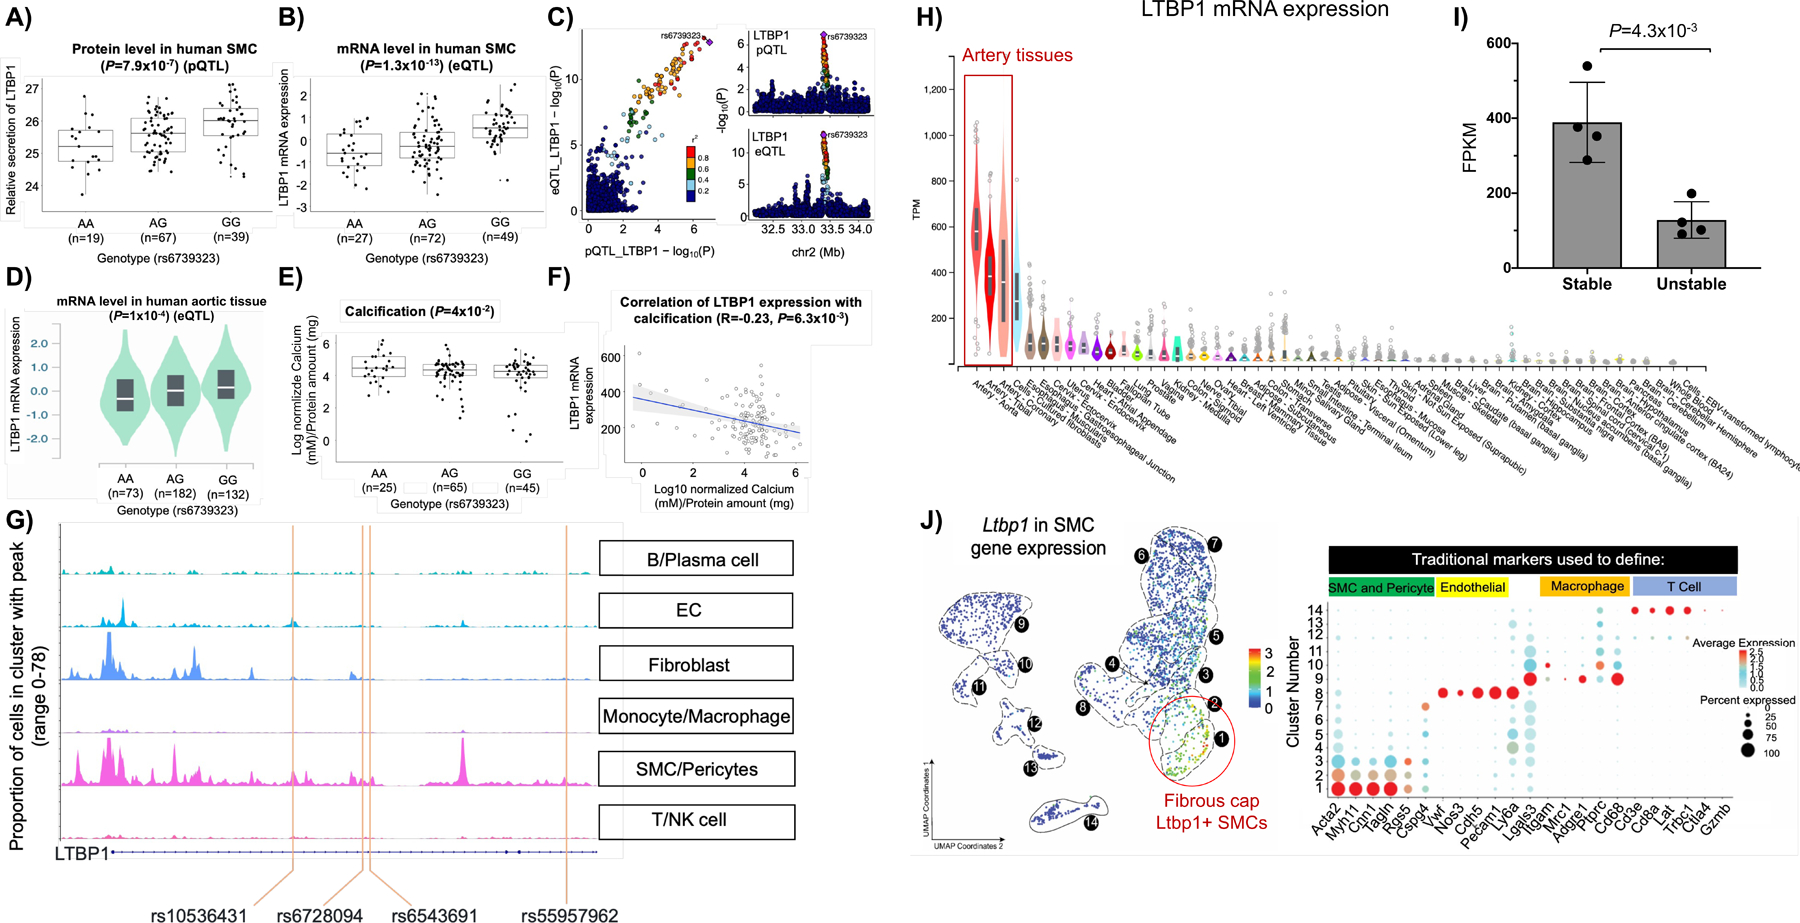
Results: We measured the abundance of 270 ECM and related proteins. Next, we performed protein quantitative trait locus mapping and identified 20 loci associated with secreted protein abundance in SMCs. We functionally annotated these loci using a colocalization approach. This approach prioritized the genetic variant rs6739323-A at the 2p22.3 locus, which is associated with lower expression of LTBP1 (latent-transforming growth factor beta-binding protein 1) in SMCs and atherosclerosis-prone areas of the aorta, and increased risk for SMC calcification. We found that LTBP1 expression is abundant in SMCs, and its expression at mRNA and protein levels was reduced in unstable and advanced atherosclerotic plaque lesions.

Conclusions: Our results unravel the SMC proteome signature associated with vascular disorders, which may help identify potential therapeutic targets to accelerate the pathway to translation.

Keywords: GWAS; cell proliferation; pQTLs; proteomics; smooth muscle cells; vascular remodeling.


Conflict of interest statement

Disclosures None.

Figures

Figure 1:
Figure 1:. Study design and overview of analyses.
We cultured aortic smooth muscle cells (SMCs) from 151 multi-ancestry heart transplant donors in 5% fetal bovine serum (FBS) media until 90% confluence. We then replaced the cell cultures with new media without FBS. We collected the media after 24 hours for proteomics profiling. In parallel, the DNA was isolated and subjected to genotyping and imputation. We calculated the associations of proteins with the genotypes of ∼6.1 million imputed SNPs to discover cis-protein quantitative trait loci (pQTLs) and sex-biased pQTLs. We identified the colocalization between molecular QTL and vascular disease-related GWAS loci associations using two different methods. ECM: extracellular matrix, Protein-QTLs: Protein quantitative trait locus.
Figure 2:
Figure 2:. Genotype-phenotype and regional association plots of the colocalized eQTLs and pQTLs.
Box and whisker plots of the associated secreted SMC protein (A, D, G) and transcript (B, E, H) in relation to the genotype of the three lead pQTL variants. See figure 6 A–C for the fourth regional association plots of the colocalized eQTLs and pQTLs. Correlation analyses for protein-transcript pairs in D), H), and L) were conducted using Pearson correlations. P-values were determined using the linear mixed-model regression in performing eQTL or pQTL mapping. Associations with genetic variants and protein and expression levels around the lead SNP for each colocalized locus are shown using LocusCompare (C, F, I). Linkage disequilibrium (r2) of each SNP with the lead SNP is color-coded based on European ancestry populations in the 1000 Genomes project. eQTL: Expression quantitative trait locus, pQTL: Protein quantitative trait locus.
Figure 3:
Figure 3:. Colocalization between pQTLs and vascular disease-related GWAS signals.
Cis-pQTL for Homerin (HRNR) protein secretion colocalized with the 1q21.3 A) coronary artery disease (CAD) and B) aortic aneurysm (AA) GWAS loci. C) The risk allele (C) of SNP rs6681093 is associated with lower HRNR protein secretion from SMCs. Cis-pQTL for Laminin Subunit Gamma 2 (LAMC2) protein secretion colocalized with the 1q25.3 D) Diastolic blood pressure (DBP) GWAS locus. E) The risk allele (T) of SNP rs10797858 is associated with lower LAMC2 protein secretion from SMCs.
Figure 4:
Figure 4:. Overview of the multi-omics data used to functionally annotate the 20 pQTL proteins.
Orange color indicates either the genes encoding proteins with cis pQTLs are upregulated in different stages of disease progression and lesion stability, or significantly correlated with SMC phenotypes relevant to atherosclerosis or highly expressed in single cells isolated from human coronary atherosclerotic plaques. For scRNAseq data, we display the normalized expression values (TPM) range above 0 to +1.5. Dark orange color indicates higher expression, while light color indicates lower expression.
Figure 5:
Figure 5:. Molecular and cellular characterization of the LTBP1 locus.
The rs6739323-A variant is associated with lower abundance of A) secreted LTBP1 and B) mRNA in human SMCs. C) Colocalization analyses between pQTL and eQTLs predicted rs6739323 as the causal variant affecting LTBP1 expression in the 2p22.3 locus. The rs6739323-A variant was also associated with D) lower expression of LTBP1 at the mRNA level in human aortic tissue and with E) higher SMC calcification. F) Negative correlation between LTBP1 expression and SMC calcification was observed. G) Single-cell ATACseq analysis from human coronary atherosclerotic plaques revealed the SMC specificity of LTBP1 regulatory elements. SNPs rs10536431, rs6728094, rs6543691, and rs55957962 that are in high LD (r2≥0.8) with rs6739323 are located in an accessible chromatin region identified by ATACseq in SMCs (lower panel). H) Gene expression of LTBP1 in human tissues that are part of the GTEx project showed higher expression in aortic tissues. I) Gene expression of LTBP1 in human unstable atherosclerotic plaques of carotid arteries compared to stable lesions. J) scRNA-seq analyses in mouse aortic tissues from microdissected atherosclerotic lesions revealed that Ltbp1 is predominantly expressed in MYH11+ACTA2+ lesion SMCs that are known to play a critical role in maintaining fibrous cap stability.
Figure 6:
Figure 6:. Modulation of LTBP1 expression in SMCs.
A) LTBP1 downregulation in SMCs leads to a significant decrease in B) proliferation and C) migration, an increase of D) calcification and decrease of the expression of E-G) ECM genes, and H-J) SMC-specific marker genes. In A), E), F), G), H), I), and J) B2M was used as a housekeeping gene to calculate the relative gene expression. n represents the technical repeats from the same donor.
Figure 7:
Figure 7:. LTBP1 immunostaining in mouse and human atherosclerotic lesions.
A) Representative immunofluorescence images of brachiocephalic artery (BCA) lesions from SMC-Klf4 ApoE-/- KO and SMC-Klf4 WT ApoE-/- mice, which were fed 26 weeks of hypercholesterolemic Western diet, were stained with eYFP, ACTA2, LTBP1, and DAPI (scale bars, 100 µm). B) LTBP1+ cells of all (DAPI+) cells in the fibrous cap. C) Myh11-eYFP+ (SMC)-derived LTBP1+ cells of all Myh11-eYFP+ SMC cells in the fibrous cap. D) Fraction of ACTA2+ cells also LTBP1+ of all ACTA2+ cells in the fibrous cap. E) Fraction of ACTA2+ cells also LTBP1+ of all LTBP1+ cells in the fibrous cap. F) ACTA2+ cells also LTBP1+ cells of all (DAPI) cells in the fibrous cap. G) Myh11-eYFP+ (SMC)-derived LTBP1+ cells of all LTBP1+ cells in the fibrous cap. Error bars represent mean ± SEM; p-values displayed refer to Mann-Whitney U test between SMC Klf4 WT and KO groups. Each circle or square shape on the graph indicates data from an individual mouse. Single-channel images with isotype controls are shown in Figure S7 H-I) Results of LTBP1, ACTA2 staining in human coronary artery fibrous cap atheroma (scale bars, 500 µm for the upper panel and 20 µm for the bottom panel). IgG control images are shown in Figure S8. The representative images in A, H, and I were chosen since they captured the critical lesion features, including the three anatomical layers, cell composition, and evident staining.

Update of

References

    1. Alencar GF, Owsiany KM, Karnewar S, Sukhavasi K, Mocci G, Nguyen AT, Williams CM, Shamsuzzaman S, Mokry M, Henderson CA, et al. Stem Cell Pluripotency Genes Klf4 and Oct4 Regulate Complex SMC Phenotypic Changes Critical in Late-Stage Atherosclerotic Lesion Pathogenesis. Circulation 2020;142:2045–2059. doi: 10.1161/CIRCULATIONAHA.120.046672 - DOI - PMC - PubMed
    1. Pan H, Xue C, Auerbach BJ, Fan J, Bashore AC, Cui J, Yang DY, Trignano SB, Liu W, Shi J, et al. Single-Cell Genomics Reveals a Novel Cell State During Smooth Muscle Cell Phenotypic Switching and Potential Therapeutic Targets for Atherosclerosis in Mouse and Human. Circulation 2020;142:2060–2075. doi: 10.1161/CIRCULATIONAHA.120.048378 - DOI - PMC - PubMed
    1. Sobue K, Hayashi K, Nishida W. Expressional regulation of smooth muscle cell-specific genes in association with phenotypic modulation. Mol Cell Biochem 1999;190:105–118. - PubMed
    1. Owens GK, Kumar MS, Wamhoff BR. Molecular regulation of vascular smooth muscle cell differentiation in development and disease. Physiol Rev 2004;84:767–801. doi: 10.1152/physrev.00041.2003 - DOI - PubMed
    1. Zhuge Y, Zhang J, Qian F, Wen Z, Niu C, Xu K, Ji H, Rong X, Chu M, Jia C. Role of smooth muscle cells in Cardiovascular Disease. Int J Biol Sci 2020;16:2741–2751. doi: 10.7150/ijbs.49871 - DOI - PMC - PubMed