. 2024 Feb 8;9(3):e166349.
doi: 10.1172/jci.insight.166349.

Sema6D forward signaling impairs T cell activation and proliferation in head and neck cancer

Affiliations

Sema6D forward signaling impairs T cell activation and proliferation in head and neck cancer

Takashi Hirai et al. JCI Insight. .

Abstract

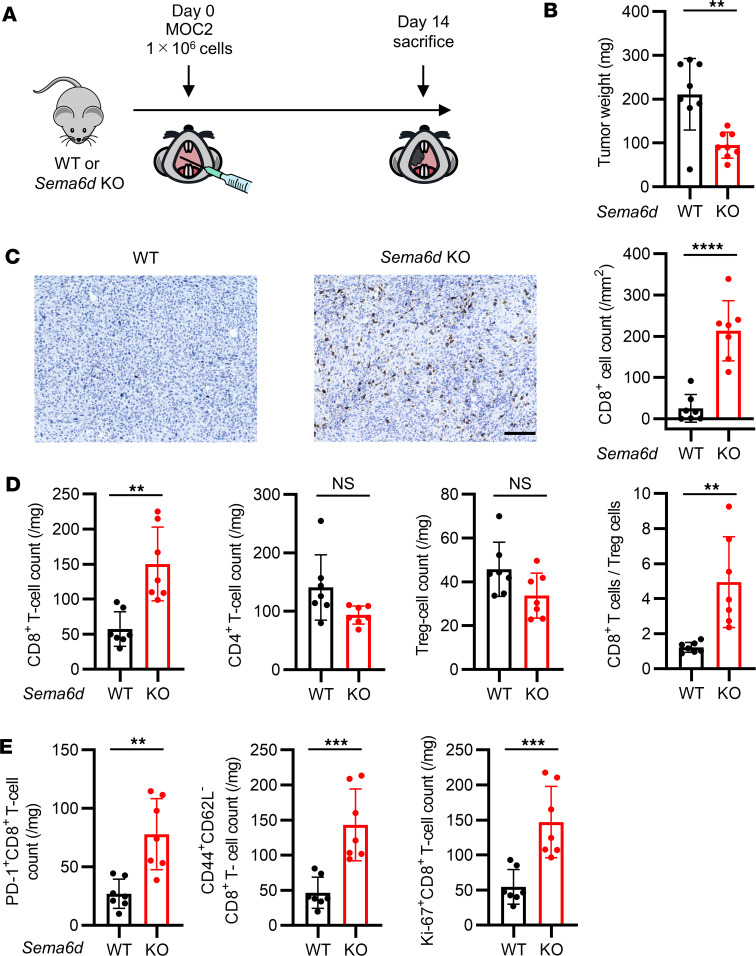
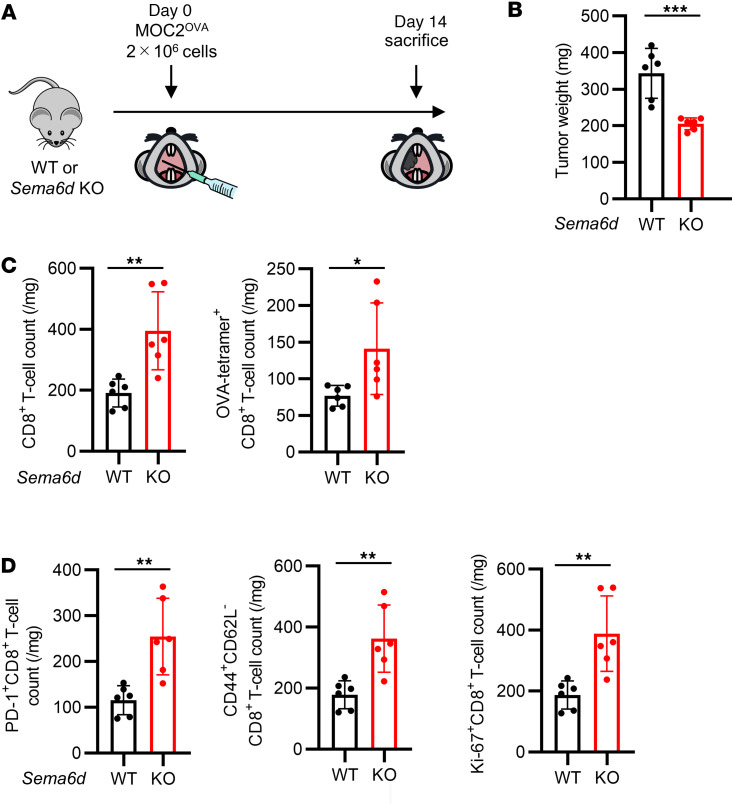
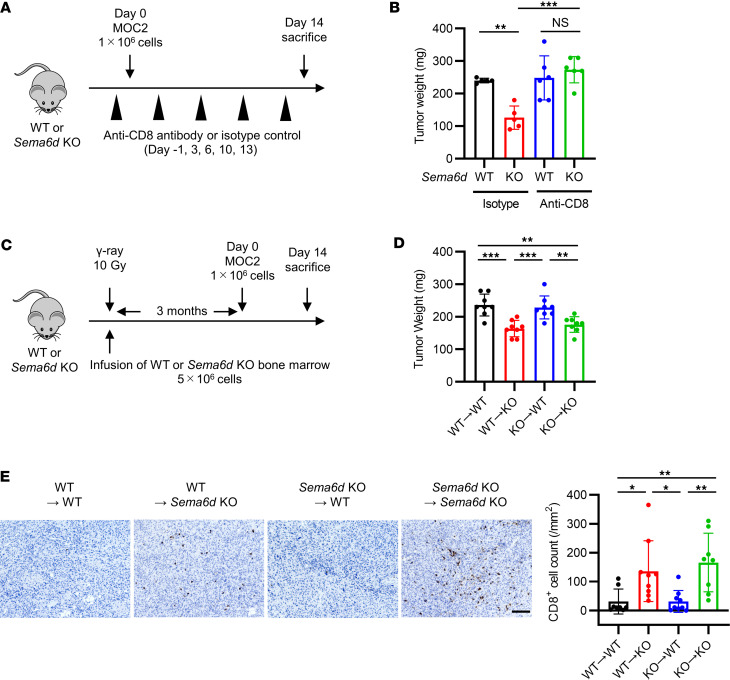
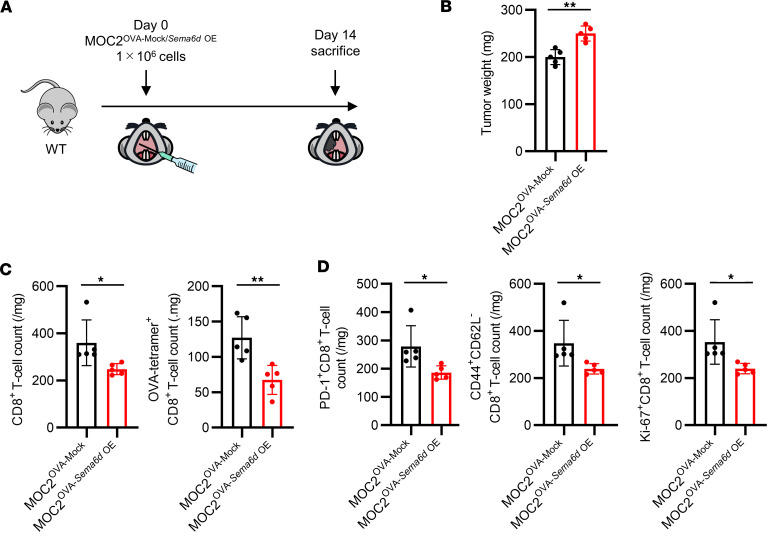
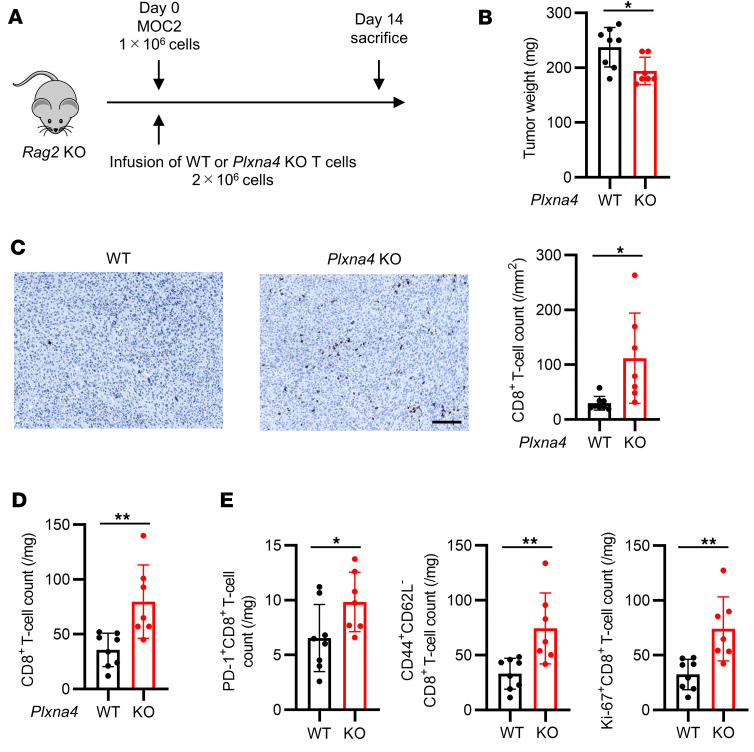
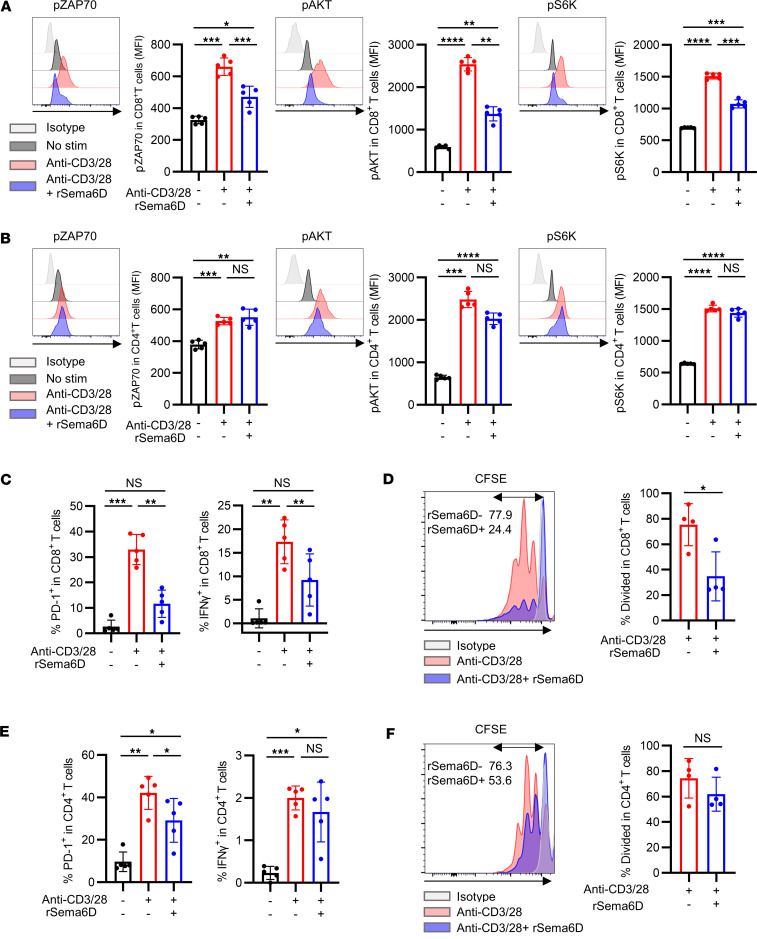
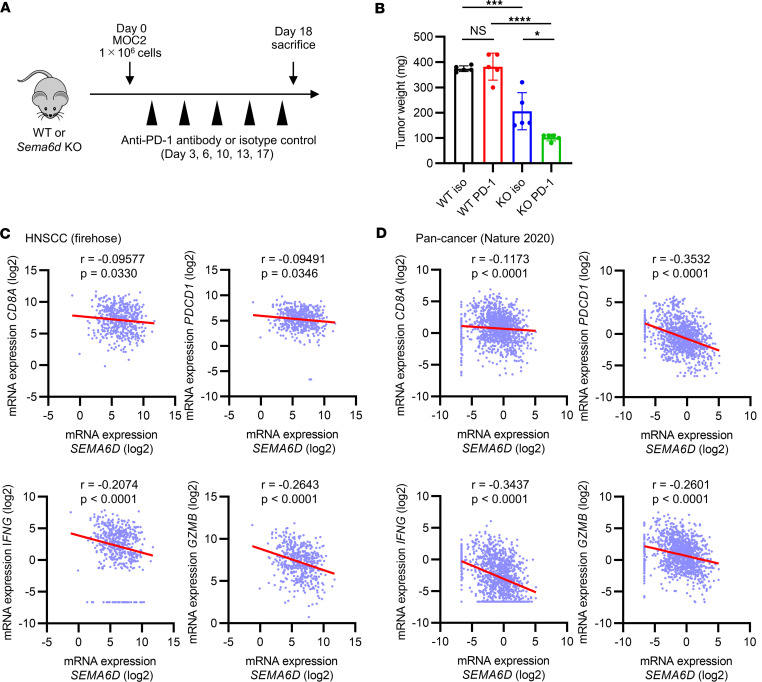
Immune checkpoint inhibitors (ICIs) are indicated for a diverse range of cancer types, and characterizing the tumor immune microenvironment is critical for optimizing therapeutic strategies, including ICIs. T cell infiltration and activation status in the tumor microenvironment greatly affects the efficacy of ICIs. Here, we show that semaphorin 6D (Sema6D) forward signaling, which is reportedly involved in coordinating the orientation of cell development and migration as a guidance factor, impaired the infiltration and activation of tumor-specific CD8+ T cells in murine oral tumors. Sema6D expressed by nonhematopoietic cells was responsible for this phenotype. Plexin-A4, a receptor for Sema6D, inhibited T cell infiltration and partially suppressed CD8+ T cell activation and proliferation induced by Sema6D stimulation. Moreover, mouse oral tumors, which are resistant to PD-1-blocking treatment in wild-type mice, showed a response to the treatment in Sema6d-KO mice. Finally, analyses of public data sets of human head and neck squamous cell carcinoma, pan-cancer cohorts, and a retrospective cohort study showed that SEMA6D was mainly expressed by nonhematopoietic cells such as cancer cells, and SEMA6D expression was significantly negatively correlated with CD8A, PDCD1, IFNG, and GZMB expression. Thus, targeting Sema6D forward signaling is a promising option for increasing ICI efficacy.

Keywords: Cancer immunotherapy; Head and neck cancer; Immunology; Oncology; T cells.


Figures

Figure 1
Figure 1. Genetic knockout of Sema6d suppressed tumor progression and induced CD8+ T cell activation and proliferation in the TME in an oral cancer model.
(A) Schematic for MOC2 administration and immunological analysis of the TME in a syngeneic oral cancer model. (B) Tumor weight in WT (n = 8) vs. Sema6d-KO mice (n = 8) on day 14 after MOC2 injection. (C) Representative images of immunohistochemical staining for CD8 (brown) in tumors from WT vs. Sema6d-KO mice. Original magnification, ×20. Scale bar: 100 μm. CD8+ cell counts in tumors were compared between WT (n = 7) and Sema6d-KO mice (n = 7). (D) The following tumor-infiltrating immune cell populations in the TME of WT vs. Sema6d-KO mice on day 14 after injection were analyzed by flow cytometry (n = 7 per group): CD8+ T cells, CD4+ T cells, Treg cells, and the ratio of CD8+ T cells/Treg cells; and (E) PD-1+, CD44+CD62L (effector memory), and Ki-67+ CD8+ T cells. Data in BE are representative of 3 independent experiments. **P < 0.01, ***P < 0.001, ****P < 0.0001. Statistical significance determined by 2-tailed Student’s t test. Results are presented as mean ± SEM.
Figure 2
Figure 2. Genetic knockout of Sema6d suppressed tumor progression and induced tumor-specific CD8+ T cell activation and proliferation in the TME.
(A) Schematic of OVA-overexpressing MOC2 (MOC2OVA) cell administration and immunological analysis of the TME in a syngeneic oral cancer model. (B) Tumor weight in WT (n = 6) vs. Sema6d-KO mice (n = 6) on day 14 after MOC2OVA cell injection. (C) CD8+ T cell counts and OVA-tetramer+CD8+ T cell counts in the TME, and (D) activation and differentiation markers of tumor-infiltrating CD8+ T cells in WT (n = 6) vs. Sema6d-KO mice (n = 6) on day 14 after injection were analyzed by flow cytometry. Data in BD are representative of 3 independent experiments. *P < 0.05, **P < 0.01, ***P < 0.001. Statistical significance determined by 2-tailed Student’s t test. Results are expressed as mean ± SEM.
Figure 3
Figure 3. Sema6D expressed by nonhematopoietic cells suppresses CD8+ T cell activation and proliferation.
(A) Schematic of MOC2 cell administration and immunological analysis of the TME in WT and Sema6d-KO mice treated with or without CD8+ T cell depletion. (B) Tumor weight in WT vs. Sema6d-KO mice on day 14 after MOC2 injection (n = 5–6 per group). Data are representative of 2 independent experiments. (C) Schematic of the generation of bone marrow–chimeric mice and immunological analysis after MOC2 cell injection. Bone marrow–chimeric mice were generated by crisscross transplantation of WT or Sema6d-KO bone marrow cells into WT or Sema6d-KO mice (WT→WT, WT→KO, KO→WT, KO→KO). (D) Tumor weight on day 14 after MOC2 cell injection (n = 8 per group). Data are representative of 3 independent experiments. (E) Representative images of immunohistochemical staining for CD8 (brown) in tumors from WT vs. Sema6d-KO mice. Original magnification, ×20. Scale bar: 100 μm. CD8+ cell counts in tumors were compared among 4 groups (n = 8–9 per group). NS, not significant. *P < 0.05; **P < 0.01; ***P < 0.001. Statistical significance determined by 1-way ANOVA with Tukey’s multiple-comparison test. Results are expressed as mean ± SEM.
Figure 4
Figure 4. Sema6D expressed by tumor cells inhibits CD8+ T cell activation and proliferation in the TME.
(A) Schematic showing injection of MOC2OVA-Mock or MOC2OVA-Sema6d OE cells and immunological analysis in WT mice. (B) Tumor weight on day 14 after administration of MOC2OVA-Mock or MOC2OVA-Sema6d OE cells (n = 5 per group). (C) CD8+ T cell counts and OVA-tetramer+CD8+ T cell counts in the TME, and (D) activation and differentiation markers of tumor-infiltrating CD8+ T cells on day 14 after injection were analyzed by flow cytometry (n = 5 per group). Data in BD are representative of 2 independent experiments. *P < 0.05, **P < 0.01. Statistical significance determined by 2-tailed Student’s t test. Results are expressed as mean ± SEM.
Figure 5
Figure 5. Plxna4-deficient CD8+ T cells show greater TME infiltration than WT CD8+ T cells.
(A) Schematic of immunological analysis of Rag2-KO mice administered WT or Plxna4-KO T cells and MOC2 cells. (B) Tumor weight on day 14 after administration of WT (n = 8) or Plxna4-KO T cells (n = 7). (C) Representative images of immunohistochemical staining for CD8 (brown) in tumors from Rag2-KO mice administered WT or Plxna4-KO T cells. Original magnification, ×20. Scale bar: 100 μm. CD8+ T cell counts were compared between tumors infused with WT (n = 8) vs. Plxna4-KO T cells (n = 7). (D) CD8+ T cell counts, and (E) activation and differentiation markers of tumor-infiltrating CD8+ T cells on day 14 after T cell infusion (WT n = 8 and Plxna4-KO n = 7) were analyzed by flow cytometry. Data in BE are representative of 2 independent experiments. *P < 0.05, **P < 0.01. Statistical significance determined by 2-tailed Student’s t test. Results are expressed as mean ± SEM.
Figure 6
Figure 6. Inhibition of T cell activation, effector function, and proliferation by Sema6D is more pronounced in CD8+ T cells than in CD4+ T cells.
(A and B) Phosphorylation of ZAP70 (pZAP70), AKT (pAKT), and S6-kinase (pS6K) was compared between CD8+ T cells (A) and CD4+ T cells (B) isolated from tumor-draining lymph nodes and stimulated as follows: no stimulation (n = 5), anti-CD3/anti-CD28 antibody (48 hours; n = 5), and anti-CD3/anti-CD28 antibody plus rSema6D (48 hours; n = 5). Representative histograms of p-ZAP70, p-AKT, and p-S6K are shown. Phosphorylation was evaluated by mean fluorescence intensity (MFI). Data are representative of 3 independent experiments. (CF) Percentages of CD8+ T cells (C and D) and CD4+ T cells (E and F) isolated from tumor-draining lymph nodes and demonstrating positivity for PD-1, IFN-γ, and CFSE after 48 hours. Representative histograms of cell trace CFSE fluorescence are shown in D and F (n = 4–5 per group). Data are representative of 3 independent experiments. NS, not significant. *P < 0.05; **P < 0.01; ***P < 0.001; ****P < 0.0001. Statistical significance determined by 1-way ANOVA with Tukey’s multiple-comparison test. Results are expressed as mean ± SEM.
Figure 7
Figure 7. The expression of SEMA6D is negatively correlated with genes related to CD8+ T cell activation and function in the TME of human cancer.
(A) Schematic of anti–PD-1 antibody treatment and immunological analysis of WT and Sema6d-KO mice administered MOC2 cells. (B) Tumor weight on day 18 after administration in WT (n = 5) or Sema6d-KO mice (n = 5). Data are representative of 2 independent experiments. NS, not significant. *P < 0.05; ***P < 0.001; ****P < 0.0001. Statistical significance determined by 1-way ANOVA with Tukey’s multiple-comparison test. Results are expressed as mean ± SEM. (C and D) Correlation between SEMA6D expression and the expression of CD8A, PDCD1, IFNG, and GZMB was evaluated in TCGA data sets using Cbioportal; head and neck squamous cell carcinoma (TCGA, Firehose Legacy) (C) and pan-cancer analysis of whole genomes (ICGC/TCGA, Nature 2020) (D). Correlation was evaluated using Spearman’s rank correlation coefficient. Gene expression of less than 0.01 was evaluated as 0.01.

References

    1. Bruni D, et al. The immune contexture and immunoscore in cancer prognosis and therapeutic efficacy. Nat Rev Cancer. 2020;20(11):662–680. doi: 10.1038/s41568-020-0285-7. - DOI - PubMed
    1. Aspeslagh S, et al. Understanding genetic determinants of resistance to immune checkpoint blockers. Semin Cancer Biol. 2020;65:123–139. doi: 10.1016/j.semcancer.2019.12.020. - DOI - PubMed
    1. Joyce JA, Fearon DT. T cell exclusion, immune privilege, and the tumor microenvironment. Science. 2015;348(6230):74–80. doi: 10.1126/science.aaa6204. - DOI - PubMed
    1. Vesely MD, et al. Resistance mechanisms to anti-PD cancer immunotherapy. Annu Rev Immunol. 2022;40:45–74. doi: 10.1146/annurev-immunol-070621-030155. - DOI - PubMed
    1. Spranger S, et al. Melanoma-intrinsic β-catenin signalling prevents anti-tumour immunity. Nature. 2015;523(7559):231–235. doi: 10.1038/nature14404. - DOI - PubMed

Publication types

Substances