. 2024 Feb 8;9(3):e163359.
doi: 10.1172/jci.insight.163359.

Blocking IL-6 signaling prevents astrocyte-induced neurodegeneration in an iPSC-based model of Parkinson's disease

Affiliations

Blocking IL-6 signaling prevents astrocyte-induced neurodegeneration in an iPSC-based model of Parkinson's disease

Meritxell Pons-Espinal et al. JCI Insight. .

Abstract

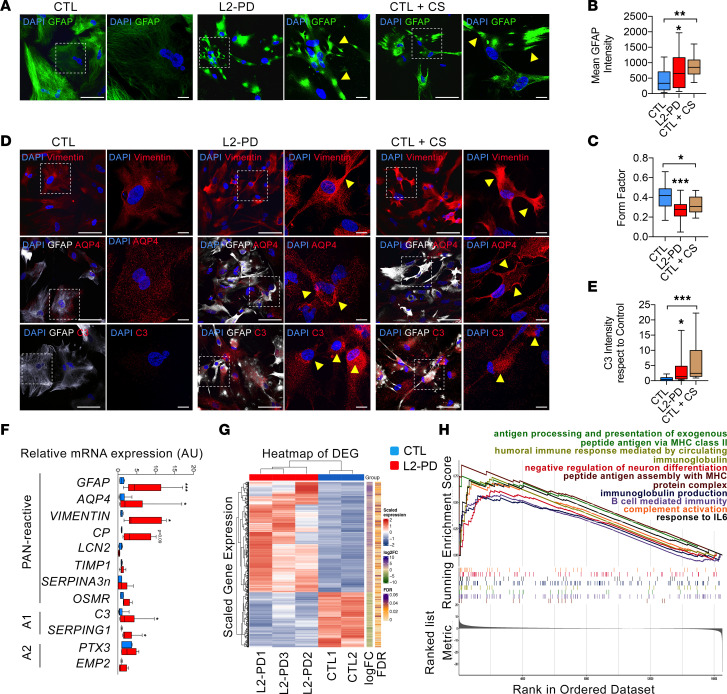
Parkinson's disease (PD) is a neurodegenerative disease associated with progressive death of midbrain dopamine (DAn) neurons in the substantia nigra (SN). Since it has been proposed that patients with PD exhibit an overall proinflammatory state, and since astrocytes are key mediators of the inflammation response in the brain, here we sought to address whether astrocyte-mediated inflammatory signaling could contribute to PD neuropathology. For this purpose, we generated astrocytes from induced pluripotent stem cells (iPSCs) representing patients with PD and healthy controls. Transcriptomic analyses identified a unique inflammatory gene expression signature in PD astrocytes compared with controls. In particular, the proinflammatory cytokine IL-6 was found to be highly expressed and released by PD astrocytes and was found to induce toxicity in DAn. Mechanistically, neuronal cell death was mediated by IL-6 receptor (IL-6R) expressed in human PD neurons, leading to downstream activation of STAT3. Blockage of IL-6R by the addition of the FDA-approved anti-IL-6R antibody, Tocilizumab, prevented PD neuronal death. SN neurons overexpressing IL-6R and reactive astrocytes expressing IL-6 were detected in postmortem brain tissue of patients at early stages of PD. Our findings highlight the potential role of astrocyte-mediated inflammatory signaling in neuronal loss in PD and pave the way for the design of future therapeutics.

Keywords: Inflammation; Neurodegeneration; Neuroscience; Parkinson disease; iPS cells.


Conflict of interest statement

Conflict of interest: The authors have declared that no conflict of interest exists.

Figures

Figure 1
Figure 1. iPSC-derived L2-PD astrocytes are reactive.
(A) Representative immunocytochemistry (ICC) images of CTL (SP09) and L2-PD astrocytes (SP13) expressing DAPI (blue) and GFAP (green) after 14 days in culture. Scale bar: 100 μm. CTL astrocytes (SP09) treated for 48 hours with C1q, TNF-α, and IL-1α were used as positive control (CTL+CS). Images on the right show a magnification of the area boxed in the left images. Scale bar: 10 μm. Yellow arrowheads indicate high GFAP staining in hypertrophic astrocytes. (B) Mean intensity of GFAP staining. (C) Form factor of GFAP+ cells calculated as: FF = 4 Pi number (π) (area/perimeter2). (D) Representative ICC images of CTL, L2-PD, and activated CTL astrocytes expressing Vimentin (CTL: SP09; L2-PD: SP13), AQP4 (CTL: SP17; L2-PD: SP06), and C3 (CTL: SP09; L2-PD: SP13). Scale bar: 100 μm. Images on the right show a magnification of the area boxed in the left images. Scale bar: 10 μm. Yellow arrowheads indicate high expression of the specific marker shown in the images. (E) Mean intensity of C3 staining with respect to CTL. (F) Relative mRNA expression of panreactive, A1-specific and A2-specific transcripts in L2-PD astrocytes with respect to CTL. Box-and-whisker plots show median, 25th and 75th percentiles, minimum, and maximum values (n = 3 experiments; form factor, mean GFAP, and C3 intensity were performed from 30 astrocytes per experiment per condition). One-way ANOVA was used, with Bonferroni as post hoc. *P < 0.05; **P < 0.01; ***P < 0.001. (G) Heatmap of differentially expressed genes (DEG) of CTL and L2-PD astrocytes. (H) Enrichment plot showing the enrichment score for the selected GO BP gene sets (e.g., antigen processing and presentation of exogenous peptide antigen via MHC class II, B cell mediated immunity, complement activation, humoral immune response mediated by circulating immunoglobulin, immunoglobulin production, negative regulation of neuron differentiation, peptide antigen assembly with MHC protein complex, response to IL-6).
Figure 2
Figure 2. L2-PD astrocyte reactivity is mediated by LRRK2 G2019S–increased kinase activity.
(A) Schematic experimental set up to perform a cytokine array from astrocyte conditioned medium (ACM). (B) Cytokine IL-6 levels released by CTL, L2-PD, and isogenic (L2-PDcorr) astrocytes after 2 weeks in culture. CTL astrocytes were treated for 48 hours with C1q, TNF-α, and IL-1α as positive control. (C) Representative ICC images of L2-PD (SP13) and L2-PDcorr (SP13wt/wt) astrocytes staining positive for: top panels, DAPI (blue), GFAP (white), and AQP4 (red); bottom panels, DAPI (blue), GFAP (white), and C3 (red). Scale bar: 100 μm. Images on the right show a magnification of the area boxed in the left images. Scale bar: 10 μm. (D) Mean intensity of GFAP staining. (E) Form factor of GFAP+ cells calculated as: FF = 4 pi (area/perimeter2). (F) Mean intensity of C3 staining with respect to L2-PD astrocytes. (G) Representative ICC images of L2-PD (SP13) treated with either DMSO or LRRK2-kinase inhibitor (1 μM) astrocytes staining positive for: top panels, DAPI (blue), GFAP (white), and AQP4 (red); bottom panels, DAPI (blue), GFAP (white), and C3 (red). Scale bar: 100 μm. Images on the right show a magnification of the area boxed in the left images. Scale bar: 10 μm. (H) Mean intensity of GFAP staining. (I) Form factor of GFAP+ cells calculated as: FF = 4 pi (area/perimeter2). (J) Mean intensity of C3 staining with respect to L2-PD astrocytes treated with DMSO. Box-and-whisker plots show median, 25th and 75th percentiles, minimum, and maximum values (n = 3 experiments; form factor, mean GFAP, and C3 intensity were performed from 30 astrocytes per experiment per condition). One-way ANOVA was used with Bonferroni as post hoc. Student t test or Mann-Whitney U test for nonparametric conditions were used when only 2 groups were compared. *P < 0.05; **P < 0.01; ***P < 0.001.
Figure 3
Figure 3. L2-PD astrocytes induce iPSC-derived DA neuronal degeneration through IL-6/IL-6R signaling.
(A) Schematic representation of the experimental procedure to analyze the effect of astrocyte conditioned medium (ACM) and IL-6 involvement on neuronal survival and degeneration. ACM was collected after 14 days in culture and added to iPSC-derived DAn from both CTL and patients with L2-PD for 1 week. Anti–IL-6R antibody Tocilizumab (10 μg/mL) was added to ACM. (B) Representative ICC images of iPSC-derived CTL (SP11) and L2-PD neurons (SP12) expressing tyrosine hydroxylase (TH, black) treated for 1 week with CTL-ACM, L2-PD ACM and L2-PD ACM + anti–IL-6R antibody. Scale bar: 100 μm. CTL neurons are derived from SP11 iPSC line. L2-PD neurons are derived from SP12, SP06, and SP13 iPSC lines. (C) Percentage of TH+ cells respect to DAPI. (D) Representative ICC images of iPSC-derived CTL and L2-PD neurons staining for TH (black). Scale bar: 20 μm. (E and F) Number of branches and neurite length of CTL and L2-PD TH+ neurons treated for 1 week with ACM. (G) Representative ICC images of DAn (TH, red) expressing IL-6R (green) from CTL (SP11) and L2-PD (SP13) iPSC-derived DAn after 35 days of differentiation. Scale bar: 20 μm. (H) Orthogonal views show colocalization between IL-6R and TH in L2-PD (SP13) DAn. (I) Representative Western blot for IL-6R of iPSC-derived CTL neurons (SP11) and L2-PD neurons (SP12). (J) Quantification of protein IL-6R respect to β-actin. (K) Relative IL-6R mRNA expression from iPSC-derived CTL neurons (SP11 and SP17) and L2-PD neurons (SP12 and SP13). Box-and-whisker plots show median, 25th and 75th percentiles, minimum, and maximum values (n = 3 experiments; 30 neurons per experiment per condition for each line). One-way ANOVA was used with Bonferroni as post hoc (C, E, F). Student t test or Mann-Whitney U test (J and K) for nonparametric conditions were used when only 2 groups were compared. *P < 0.05; **P < 0.01; ***P < 0.001.
Figure 4
Figure 4. IL-6 signaling mediates neuronal degeneration in patients with ID-PD.
(A) Representative ICC images of CTL (SP09) or ID-PD (ID-PD1: SP04; ID-PD2: SP08; ID-PD3: SP16) astrocytes staining positive for: top panels, DAPI (blue) and GFAP (green); bottom panels, DAPI (blue) and C3 (red). CTL astrocytes treated for 48 hours with cytokines were used as positive control. Scale bar: 100 μm. (B) Form factor of GFAP+ cells calculated as: FF = 4 pi (area/perimeter2). (C) Mean intensity of GFAP staining. (D) Mean intensity of C3 staining with respect to CTL. (E) IL-6 protein levels released by CTL and ID-PD ACM after 2 weeks in culture. Box-and-whisker plots show median, 25th and 75th percentiles, minimum, and maximum values (n = 3 experiments; form factor, mean GFAP, and C3 intensity were performed from 30 astrocytes per experiment per condition). (F) Representative ICC images of iPSC-derived CTL (SP11) and L2-PD (SP12) neurons expressing tyrosine hydroxylase (TH, black) treated for 1 week with CTL astrocyte conditioned medium (ACM), idiopathic (ID-PD) ACM, and ID-PD ACM + anti–IL-6R Tocilizumab (10 μg/mL). Scale bar: 100 μm. (G) Percentage of TH+ cells respect to DAPI. (H and I) Number of branches and neurite length of TH+ neurons cultured with ACM for 1 week. Box-and-whisker plots show median, 25th and 75th percentiles, minimum, and maximum values (n = 3 experiments; 30 neurons per experiment per condition for each line). One-way ANOVA was used with Bonferroni as post hoc. *P < 0.05; **P < 0.01; ***P < 0.001.
Figure 5
Figure 5. IL-6/IL-6R signaling is increased in the SNc in postmortem brains at early stages of PD.
(A) Representative immunohistochemical sections of the mesencephalon including the substantia nigra pars compacta from control and PD cases at early (Braak stages 1–3) and late stages (Braak stages 4 and 5) of the disease. IL-6 (visualized with DAB) is present in astrocytes (GFAP+ cells; nickel). Scale bar: 25 μm. Images on the upper right show a magnification of the area boxed in the main images. Scale bar: 10 μm. (B) Percentage of GFAP+ cells expressing IL-6 over total GFAP+ cells. (C) IL-6R (green) is localized in DAn in PD cases (Braak stage 2) as visualized by TH immunofluorescence (red); autofluorescence is blocked by preincubating the sections with Sudan black. Scale bar: 100 μm. Asterisks show colocalization of TH+ cells expressing IL-6R. (D) Representative immunofluorescence images showing increased IL-6R immunoreactivity in PD substantia nigra pars compacta (Braak stage 2) as compared with controls. Scale bar: 25 μm. Asterisks show neurons with IL-6R expression. (E) Percentage of IL-6R+ staining area per image/total image area. Postmortem brain samples include: 3 healthy donors, 1 PD (Braak stage 1), 2 PD (Braak stage 2), 2 PD (Braak stage 3), 1 PD (Braak stage 4), and 2 PD (Braak stage 5). We counted 50 astrocytes per individual (GFAP+) from 6–8 images each. One-way ANOVA was used with Bonferroni as post hoc. Student t test was used when only 2 groups were compared. **P < 0.01; ***P < 0.001.

References

    1. Poewe W, et al. Parkinson disease. Nat Rev Dis Primers. 2017;3:17013. doi: 10.1038/nrdp.2017.13. - DOI - PubMed
    1. Balestrino R, Schapira AHV. Parkinson disease. Eur J Neurol. 2020;27(1):27–42. doi: 10.1111/ene.14108. - DOI - PubMed
    1. Greenamyr JT, Hastings TG. Biomedicine. Parkinson’s--divergent causes, convergent mechanisms. Science. 2004;304(5674):1120–1122. doi: 10.1126/science.1098966. - DOI - PubMed
    1. Wang Q, et al. Neuroinflammation in Parkinson’s disease and its potential as therapeutic target. Transl Neurodegener. 2015;4:19. doi: 10.1186/s40035-015-0042-0. - DOI - PMC - PubMed
    1. Tolosa E, et al. LRRK2 in Parkinson disease: challenges of clinical trials. Nat Rev Neurol. 2020;16(2):97–107. doi: 10.1038/s41582-019-0301-2. - DOI - PubMed

Publication types

MeSH terms