. 2024 Jun 1;146(6):061003.
doi: 10.1115/1.4064682.

Atherosclerotic Calcifications Have a Local Effect on the Peel Behavior of Human Aortic Media

Affiliations

Atherosclerotic Calcifications Have a Local Effect on the Peel Behavior of Human Aortic Media

Carly L Donahue et al. J Biomech Eng. .

Abstract

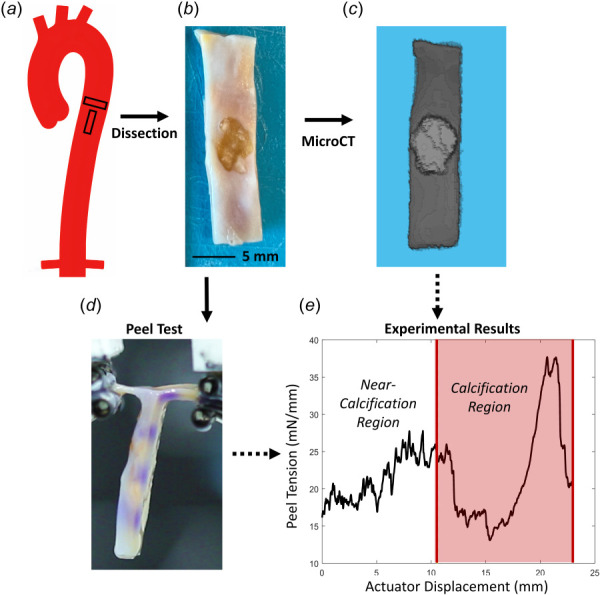
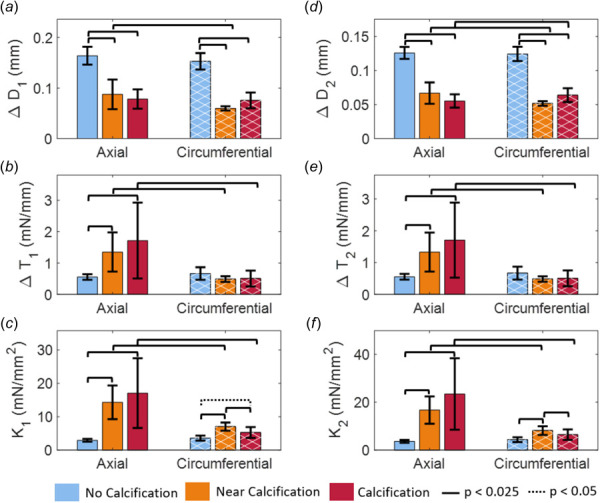
Aortic dissections, characterized by the propagation of a tear through the layers of the vessel wall, are critical, life-threatening events. Aortic calcifications are a common comorbidity in both acute and chronic dissections, yet their impact on dissection mechanics remains unclear. Using micro-computed tomography (CT) imaging, peel testing, and finite element modeling, this study examines the interplay between atherosclerotic calcifications and dissection mechanics. Samples cut from cadaveric human thoracic aortas were micro-CT imaged and subsequently peel-tested to map peel tension curves to the location of aortic calcifications. Empirical mode decomposition separated peel tension curves into high and low-frequency components, with high-frequency effects corresponding to interlamellar bonding mechanics and low-frequency effects to peel tension fluctuations. Finally, we used an idealized finite element model to examine how stiff calcifications affect aortic failure mechanics. Results showed that atherosclerosis influences dissection behavior on multiple length scales. Experimentally, atherosclerotic samples exhibited higher peel tensions and greater variance in the axial direction. The variation was driven by increased amplitudes of low-frequency tension fluctuations in diseased samples, indicating that more catastrophic propagations occur near calcifications. The simulations corroborated this finding, suggesting that the low-frequency changes resulted from the presence of a stiff calcification in the vessel wall. There were also modifications to the high-frequency peel mechanics, a response likely attributable to alterations in the microstructure and interlamellar bonding within the media. Considered collectively, these findings demonstrate that dissection mechanics are modified in aortic media nearby and adjacent to aortic calcifications.


Figures

None
Graphical abstract
(a) Illustration of a human aorta. The black rectangles show examples of rectangular strip samples dissected in the circumferential and axial directions. (b) Strip sample dissected from a human cadaveric aorta. In the center of the sample, a calcified plaque is visible. (c) Micro-CT of the sample, with the calcified plaque segmented from the surrounding vessel wall tissue. (d) Peel test of the sample. (e) Peel tension versus actuator displacement from a peel experiment of a diseased sample with near-calcification (not shaded) and calcified (shaded) regions.
Fig. 1
(a) Illustration of a human aorta. The black rectangles show examples of rectangular strip samples dissected in the circumferential and axial directions. (b) Strip sample dissected from a human cadaveric aorta. In the center of the sample, a calcified plaque is visible. (c) Micro-CT of the sample, with the calcified plaque segmented from the surrounding vessel wall tissue. (d) Peel test of the sample. (e) Peel tension versus actuator displacement from a peel experiment of a diseased sample with near-calcification (not shaded) and calcified (shaded) regions.
Micro-CT image mapped to empirical mode decomposition of (a) healthy sample and (b) diseased sample. The decomposition yields three intrinsic mode functions (IMFs) and a residual (EMD-R) that increase in wavelength. (c) Measurements attained from each IMF. Distance ΔD1, tension change ΔT1, and slope K1 characterize the rises of each oscillation and ΔD2, ΔT2, and K2 characterize the falls.
Fig. 2
Micro-CT image mapped to empirical mode decomposition of (a) healthy sample and (b) diseased sample. The decomposition yields three intrinsic mode functions (IMFs) and a residual (EMD-R) that increase in wavelength. (c) Measurements attained from each IMF. Distance ΔD1, tension change ΔT1, and slope K1 characterize the rises of each oscillation and ΔD2, ΔT2, and K2 characterize the falls.
(a) 3D finite element model of peel sample. Aortic media is shown in gray. The plaque lesion is shown in red. The cohesive zone is gold. Both “arms” are pulled apart in the x-direction as indicated by the large black arrows. (b) Bilinear traction separation law parameters: separation distance at damage initiation (δ1), separation distance at complete delamination (δc), energy release rate (Gc), and traction at damage initiation (t1).
Fig. 3
(a) 3D finite element model of peel sample. Aortic media is shown in gray. The plaque lesion is shown in red. The cohesive zone is gold. Both “arms” are pulled apart in the x-direction as indicated by the large black arrows. (b) Bilinear traction separation law parameters: separation distance at damage initiation (δ1), separation distance at complete delamination (δc), energy release rate (Gc), and traction at damage initiation (t1).
Zero-frequency measures of (a) average peel tension (mN/mm) and (b) standard deviation (mN/mm) for the no calcification, near calcification, and calcification groups. Error bars indicate significance for 95% confidence intervals and brackets indicate significance at the 90% (p < 0.05) and 95% (p < 0.025) confidence levels.
Fig. 4
Zero-frequency measures of (a) average peel tension (mN/mm) and (b) standard deviation (mN/mm) for the no calcification, near calcification, and calcification groups. Error bars indicate significance for 95% confidence intervals and brackets indicate significance at the 90% (p < 0.05) and 95% (p < 0.025) confidence levels.
High-frequency measures obtained from the second intrinsic mode function (IMF2) of the empirical mode decomposition (EMD). The rising portions of tension oscillations can be characterized by (a) the separation distance at damage initiation (ΔD1), (b) the corresponding rise in peel tension (ΔT1), and (c) the slope of the ramp-up which is a measure of interlamellar stiffness (Κ1 = ΔT1/ΔD1). The negative-sloping parts of the oscillations capture the failure mechanics measured by (d) the separation distance at complete delamination (ΔD2), (e) the corresponding drop in peel tension (ΔT2), and (f) the slope of the failure (Κ2 = ΔT2/ΔD2). Error bars indicate significance for 95% confidence intervals and brackets indicate significance at the 90% (p < 0.05) and 95% (p < 0.025) confidence levels.
Fig. 5
High-frequency measures obtained from the second intrinsic mode function (IMF2) of the empirical mode decomposition (EMD). The rising portions of tension oscillations can be characterized by (a) the separation distance at damage initiation (ΔD1), (b) the corresponding rise in peel tension (ΔT1), and (c) the slope of the ramp-up which is a measure of interlamellar stiffness (Κ1 = ΔT1D1). The negative-sloping parts of the oscillations capture the failure mechanics measured by (d) the separation distance at complete delamination (ΔD2), (e) the corresponding drop in peel tension (ΔT2), and (f) the slope of the failure (Κ2 = ΔT2D2). Error bars indicate significance for 95% confidence intervals and brackets indicate significance at the 90% (p < 0.05) and 95% (p < 0.025) confidence levels.
Low-frequency measures obtained from the residual (EMD-R) of the empirical mode decomposition (EMD). Rises in peel tension can be characterized by (a) the rising distance (ΔD1), (b) the corresponding increase in peel tension (ΔT1), and (c) the slope of the ramp-up which is a measure of peeling resistance (Κ1 = ΔT1/ΔD1). The negative-sloping changes in peel tension capture the failure mechanics and are characterized by (d) the distance over which the tension drop occurs (ΔD2), (e) the corresponding decrease in peel tension (ΔT2), and (f) the slope of the failure which provides a measure of catastrophe (Κ2 = ΔT2/ΔD2). Error bars indicate significance for 95% confidence intervals and brackets indicate significance at the 90% (p < 0.05) and 95% (p < 0.025) confidence levels.
Fig. 6
Low-frequency measures obtained from the residual (EMD-R) of the empirical mode decomposition (EMD). Rises in peel tension can be characterized by (a) the rising distance (ΔD1), (b) the corresponding increase in peel tension (ΔT1), and (c) the slope of the ramp-up which is a measure of peeling resistance (Κ1 = ΔT1D1). The negative-sloping changes in peel tension capture the failure mechanics and are characterized by (d) the distance over which the tension drop occurs (ΔD2), (e) the corresponding decrease in peel tension (ΔT2), and (f) the slope of the failure which provides a measure of catastrophe (Κ2 = ΔT2D2). Error bars indicate significance for 95% confidence intervals and brackets indicate significance at the 90% (p < 0.05) and 95% (p < 0.025) confidence levels.
(a) Peel tension curve of calcification-free simulation. (b) Peel tension curve of calcification simulation. Vertical lines indicate the start and end of the calcification region. (c) The first intrinsic mode function (IMF1) from the empirical mode decomposition (EMD) of the calcification-free simulation. Local maxima and minima are shown with black dots. (d) IMF1 from the EMD of the calcification simulation. (e) The residual of the EMD (EMD-R) of the calcification-free simulation. (f) EMD-R of the calcification simulation.
Fig. 7
(a) Peel tension curve of calcification-free simulation. (b) Peel tension curve of calcification simulation. Vertical lines indicate the start and end of the calcification region. (c) The first intrinsic mode function (IMF1) from the empirical mode decomposition (EMD) of the calcification-free simulation. Local maxima and minima are shown with black dots. (d) IMF1 from the EMD of the calcification simulation. (e) The residual of the EMD (EMD-R) of the calcification-free simulation. (f) EMD-R of the calcification simulation.
High (a)–(f) and low (g)–(l) measures obtained from the first intrinsic mode function (IMF1) and the residual (EMD-R) of the empirical mode decompositions (EMD) of simulation results for the no calcification, near calcification and calcification groups. The rising portions of the high-frequency tension oscillations were characterized by (a) IMF1 ΔD1, (b) IMF1 ΔT1, and (c) IMF1 Κ1 = ΔT1/ΔD1. The negative-sloping parts of the IMF1 oscillations capture the failure mechanics measured by (d) IMF1 ΔD2, (e) IMF1 ΔT2, and (f) IMF1 Κ2 = ΔT2/ΔD2. Low-frequency rises in peel tension can be characterized by (g) EMD-R ΔD1, (h) EMD-R ΔT1, and (i) EMD-R Κ1 = ΔT1/ΔD1. The negative-sloping changes in EMD-R capture the failure mechanics and are characterized by (j) EMD-R ΔD2, (k) EMD-R ΔT2, and (l) EMD-R Κ2 = ΔT2/ΔD2.
Fig. 8
High (a)–(f) and low (g)–(l) measures obtained from the first intrinsic mode function (IMF1) and the residual (EMD-R) of the empirical mode decompositions (EMD) of simulation results for the no calcification, near calcification and calcification groups. The rising portions of the high-frequency tension oscillations were characterized by (a) IMF1 ΔD1, (b) IMF1 ΔT1, and (c) IMF1 Κ1 = ΔT1D1. The negative-sloping parts of the IMF1 oscillations capture the failure mechanics measured by (d) IMF1 ΔD2, (e) IMF1 ΔT2, and (f) IMF1 Κ2 = ΔT2D2. Low-frequency rises in peel tension can be characterized by (g) EMD-R ΔD1, (h) EMD-R ΔT1, and (i) EMD-R Κ1 = ΔT1D1. The negative-sloping changes in EMD-R capture the failure mechanics and are characterized by (j) EMD-R ΔD2, (k) EMD-R ΔT2, and (l) EMD-R Κ2 = ΔT2D2.

References

    1. Melvinsdottir, I. H. , Lund, S. H. , Agnarsson, B. A. , Sigvaldason, K. , Gudbjartsson, T. , and Geirsson, A. , 2016, “ The Incidence and Mortality of Acute Thoracic Aortic Dissection: Results From a Whole Nation Study,” Eur. J. Cardio-Thoracic Surg., 50(6), pp. 1111–1117.10.1093/ejcts/ezw235 - DOI - PubMed
    1. Obel, L. M. , Lindholt, J. S. , Lasota, A. N. , Jensen, H. K. , Benhassen, L. L. , Mørkved, A. L. , Srinanthalogen, R. , Christiansen, M. , Bundgaard, H. , and Liisberg, M. , 2022, “ Clinical Characteristics, Incidences, and Mortality Rates for Type a and B Aortic Dissections: A Nationwide Danish Population-Based Cohort Study From 1996 to 2016,” Circulation, 146(25), pp. 1903–1917.10.1161/CIRCULATIONAHA.122.061065 - DOI - PubMed
    1. Yang, C. J. , Tsai, S. H. , Wang, J. C. , Chang, W. C. , Lin, C. Y. , Tang, Z. C. , and Hsu, H. H. , 2019, “ Association Between Acute Aortic Dissection and the Distribution of Aortic Calcification,” PLoS One, 14(7), p. e0219461.10.1371/journal.pone.0219461 - DOI - PMC - PubMed
    1. Erbel, R. , and Churzidse, S. , 2017, “ Calcification of the Aortic Wall Indicates Risk but Not Beyond Current Clinically Used Risk Factors Assessment,” Atherosclerosis, 257, pp. 256–258.10.1016/j.atherosclerosis.2017.01.020 - DOI - PubMed
    1. Kälsch, H. , Lehmann, N. , Möhlenkamp, S. , Hammer, C. , Mahabadi, A. A. , Moebus, S. , and Schmermund, A., et al., 2013, “ Prevalence of Thoracic Aortic Calcification and Its Relationship to Cardiovascular Risk Factors and Coronary Calcification in an Unselected Population-Based Cohort: The Heinz Nixdorf Recall Study,” Int. J. Cardiovasc. Imaging, 29(1), pp. 207–216.10.1007/s10554-012-0051-3 - DOI - PubMed

Publication types