. 2024 Apr 1;134(7):e174545.
doi: 10.1172/JCI174545.

Tissue-specific reprogramming leads to angiogenic neutrophil specialization and tumor vascularization in colorectal cancer

Affiliations

Tissue-specific reprogramming leads to angiogenic neutrophil specialization and tumor vascularization in colorectal cancer

Triet M Bui et al. J Clin Invest. .

Abstract

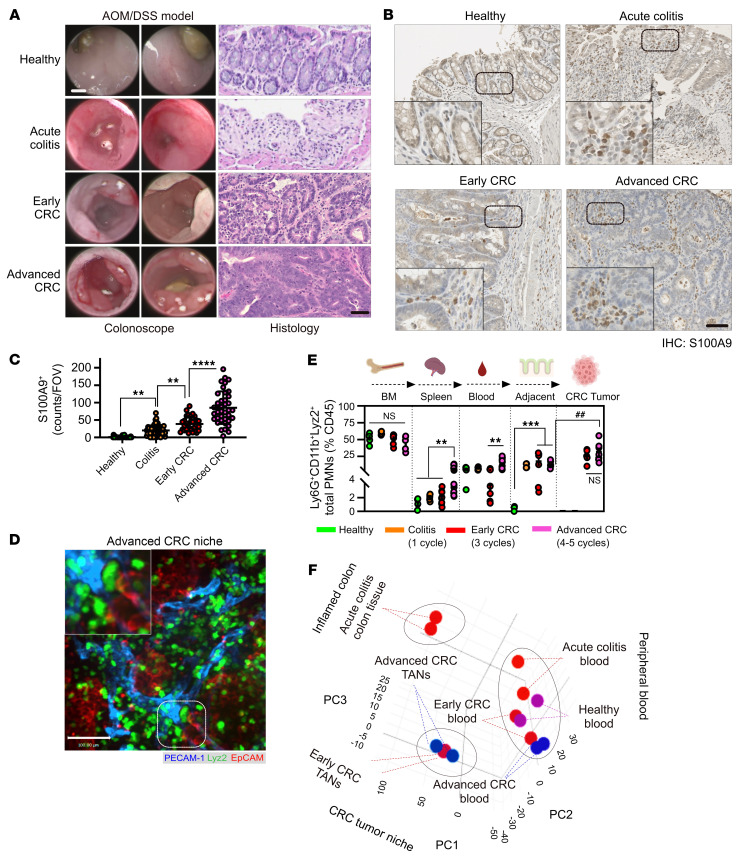
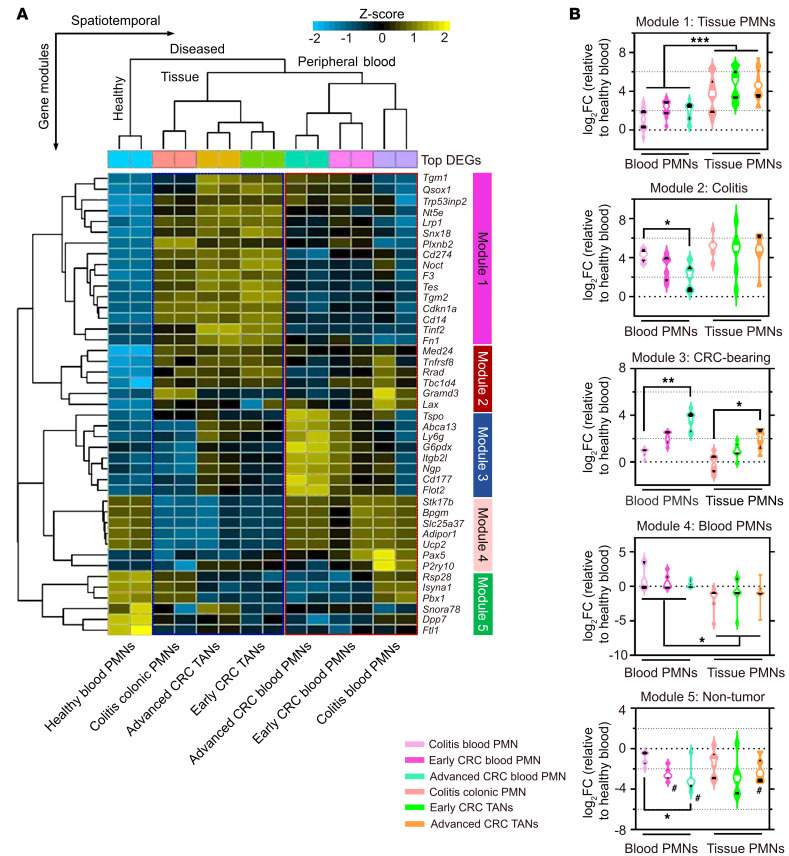
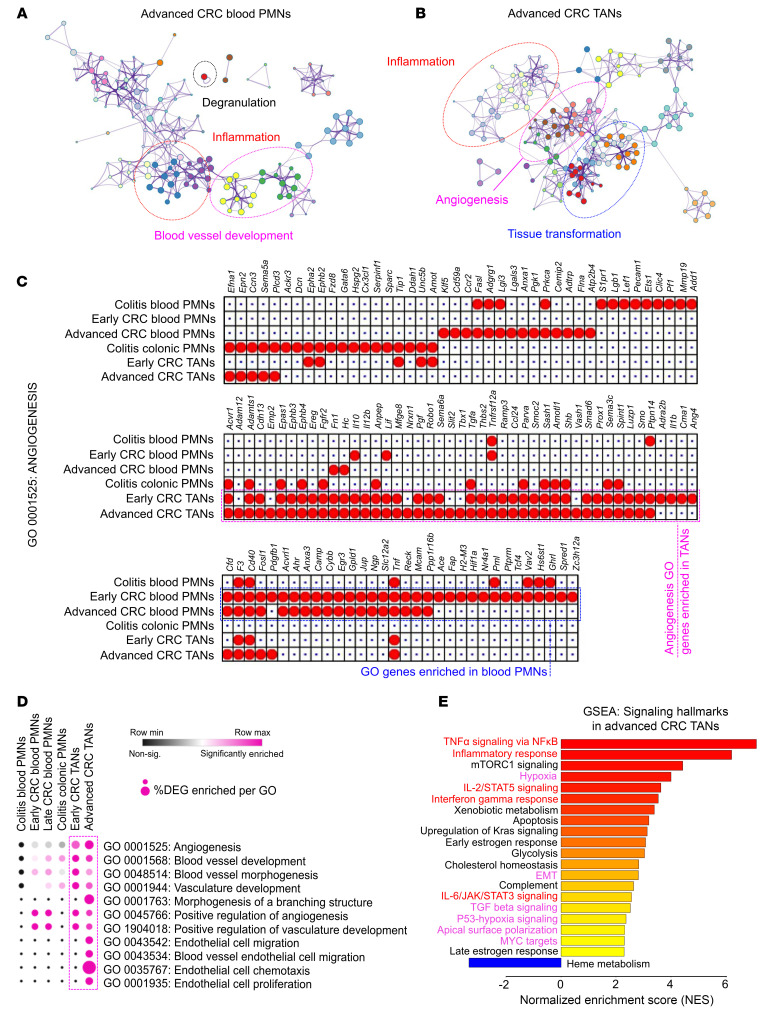
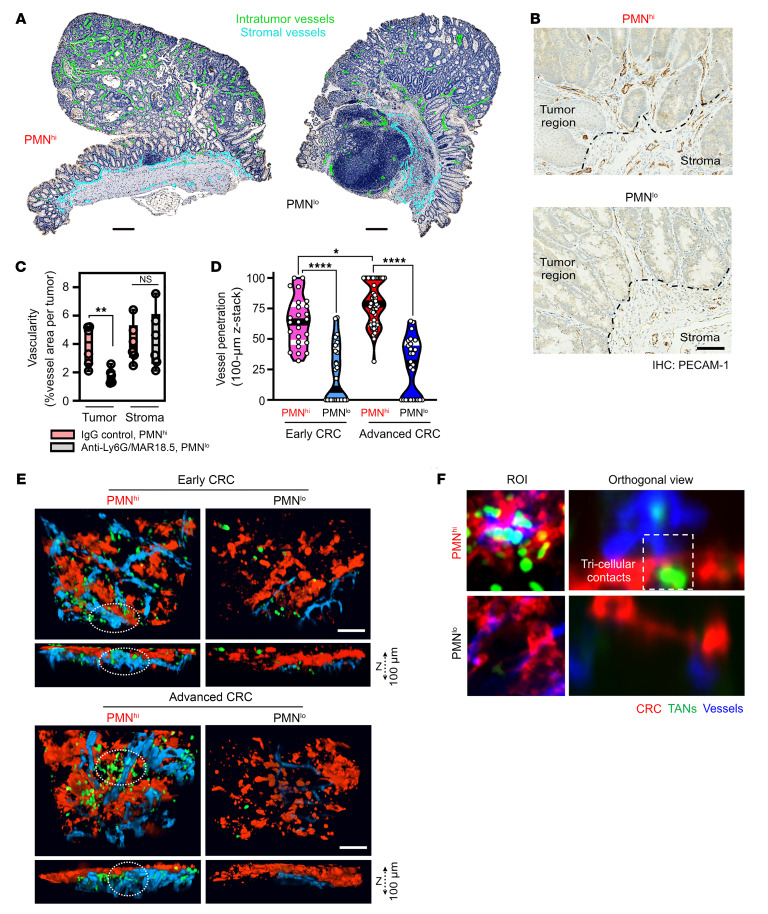
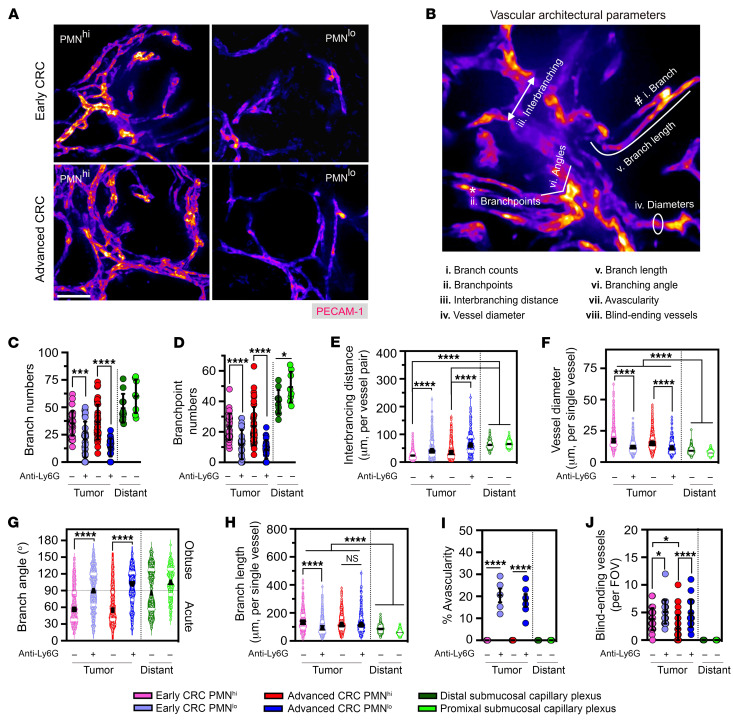
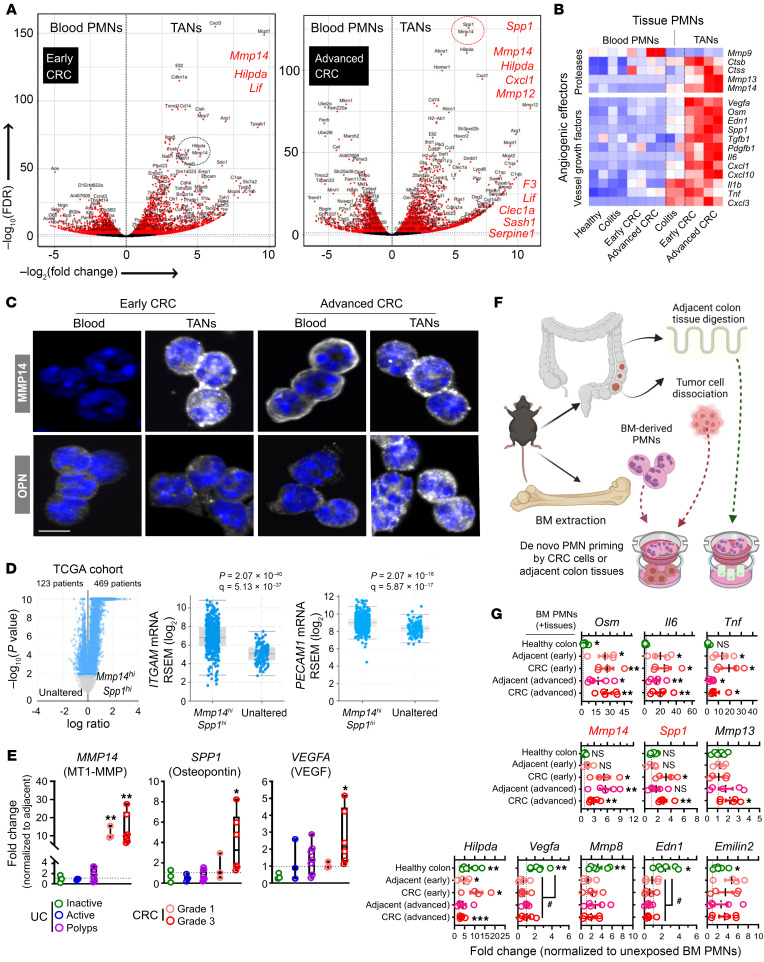
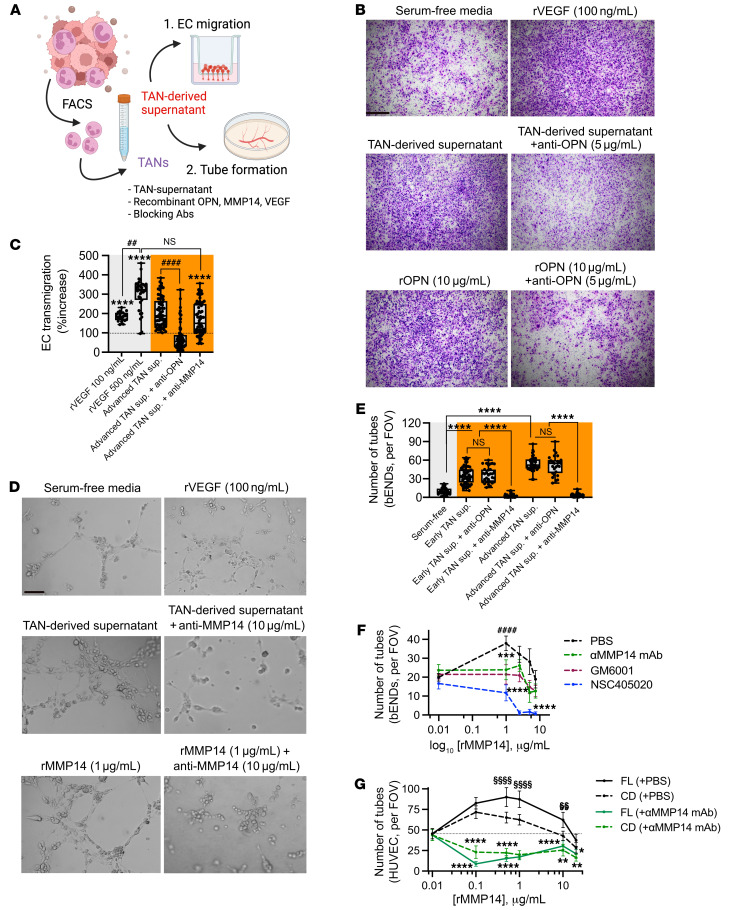
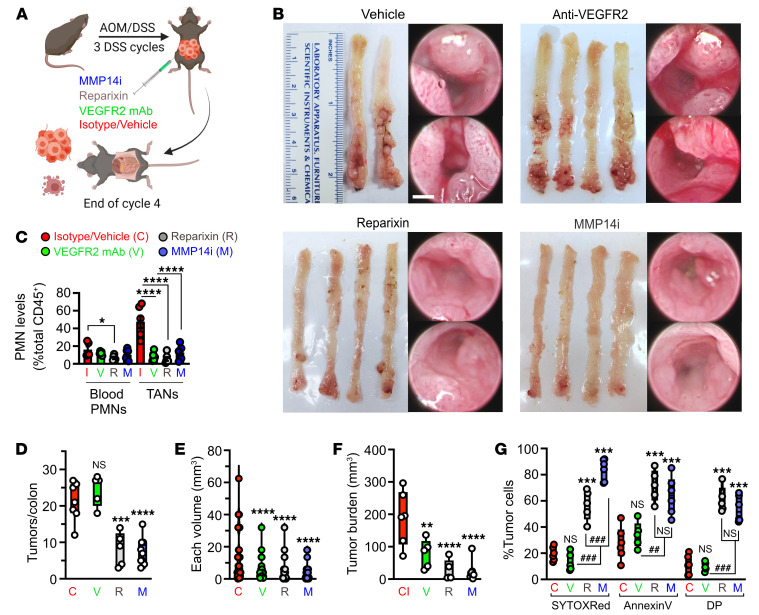
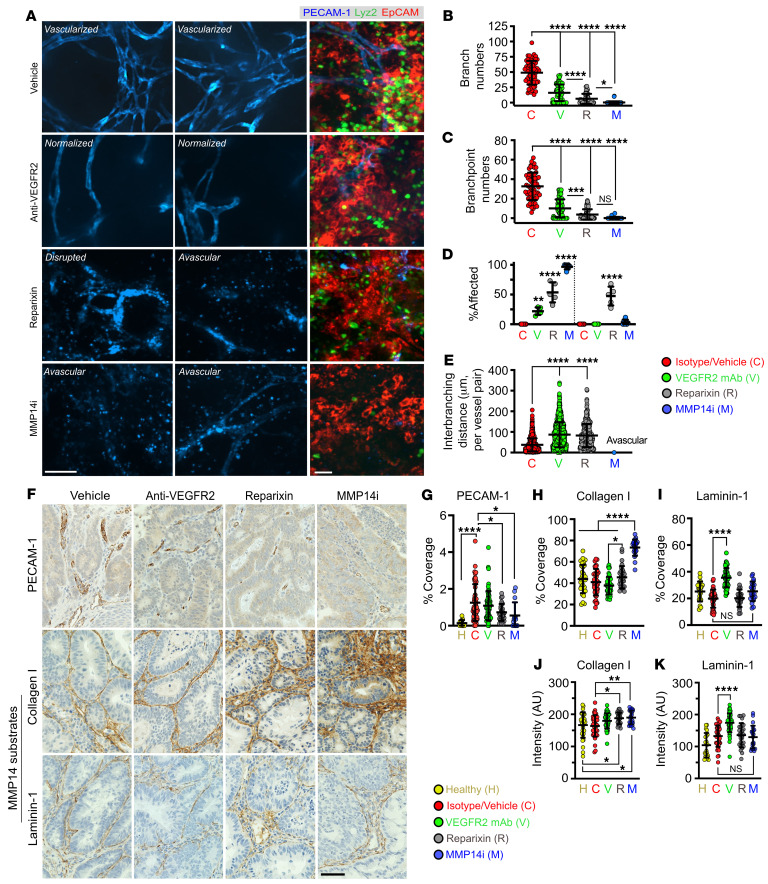
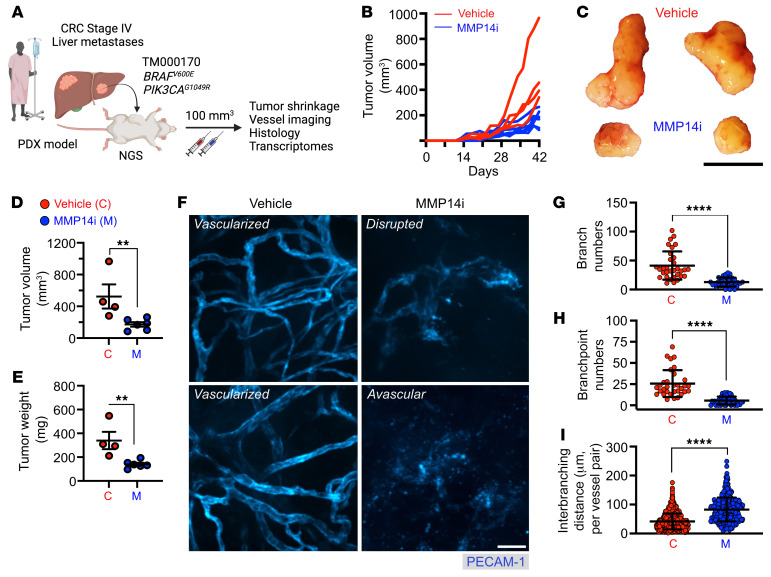
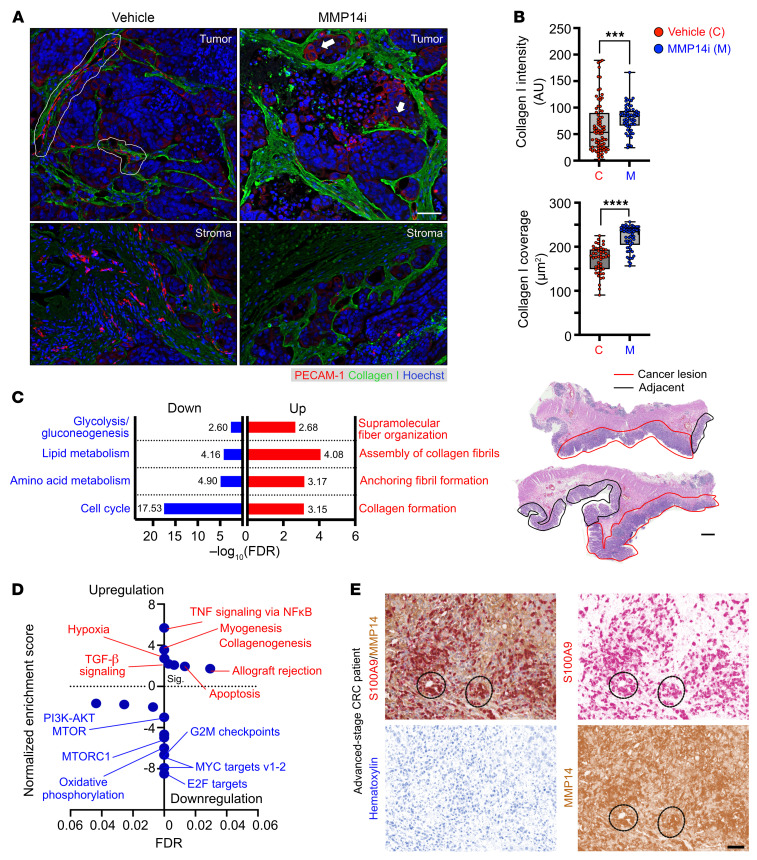
Neutrophil (PMN) tissue accumulation is an established feature of ulcerative colitis (UC) lesions and colorectal cancer (CRC). To assess the PMN phenotypic and functional diversification during the transition from inflammatory ulceration to CRC we analyzed the transcriptomic landscape of blood and tissue PMNs. Transcriptional programs effectively separated PMNs based on their proximity to peripheral blood, inflamed colon, and tumors. In silico pathway overrepresentation analysis, protein-network mapping, gene signature identification, and gene-ontology scoring revealed unique enrichment of angiogenic and vasculature development pathways in tumor-associated neutrophils (TANs). Functional studies utilizing ex vivo cultures, colitis-induced murine CRC, and patient-derived xenograft models demonstrated a critical role for TANs in promoting tumor vascularization. Spp1 (OPN) and Mmp14 (MT1-MMP) were identified by unbiased -omics and mechanistic studies to be highly induced in TANs, acting to critically regulate endothelial cell chemotaxis and branching. TCGA data set and clinical specimens confirmed enrichment of SPP1 and MMP14 in high-grade CRC but not in patients with UC. Pharmacological inhibition of TAN trafficking or MMP14 activity effectively reduced tumor vascular density, leading to CRC regression. Our findings demonstrate a niche-directed PMN functional specialization and identify TAN contributions to tumor vascularization, delineating what we believe to be a new therapeutic framework for CRC treatment focused on TAN angiogenic properties.

Keywords: Cellular immune response; Colorectal cancer; Gastroenterology; Immunology; Neutrophils.


Conflict of interest statement

Conflict of interest: The authors have declared that no conflict of interest exists.

Figures

Figure 1
Figure 1. Tissue compartmentalization of PMN immunophenotypes during colitis-to-CRC transition.
(A) Endoscopic (left) and histological images (right) of healthy, ulcerated and CRC-bearing colons induced by AOM/DSS treatment. Acute colitis 1 DSS cycle, early and advanced CRC with 3 and 5 DSS cycles, respectively. Images representative of n = 4 independent experiments. Scale bars: 1 mm for endoscopy and 100 μm for H&E. (B) IHC staining and (C) quantification of S100A9 PMNs in healthy, inflamed colitis and AOM/DSS induced tumors (n = 3–4 mice per condition, with approximately 50 fields of view [FOVs]per condition). Insets are higher magnification images showing PMN accumulation in tumors. Scale bar: 50 μm. (D) Whole-mount confocal imaging of AOM/DSS-induced CRC tumors in Lyz2EGFP reporter mice. ECs were visualized by PECAM-1 and tumor cells by EpCAM staining. The inset shows magnified image of area highlighted by dotted line, depicting PMN interacting with blood vessels within the tumor niche. Scale bar: 50 μm. Images representative of n = 4 independent experiments. (E) Flow cytometric analyses of Ly6G+/CD11b+/Lyz2EGFP PMN numbers across tissue compartments during CRC development. n = 5–8 for healthy and colitis and n = 8–12 for CRC. Data are shown as mean ± SEM. **P < 0.01, ***P < 0.001, significance between diseased conditions; ##P < 0.01, significance between cancer and adjacent tissue(1-way ANOVA with Tukey’s multiple comparison test). (F) 3D PCA matrix of RNA-Seq profiles of 7 spatiotemporal conditions. 3 separate PMN clusters (dotted circles) were identified, representing peripheral blood, inflamed colon, and CRC niches.
Figure 2
Figure 2. Distinct transcriptomic signatures define PMN/TAN tissue localization.
(A) Unsupervised hierarchical clustering of the top 50 DEGs with Benjamini-Hochberg’s correction (FDR < 0.05). Row-scaled heatmap representation. (B) Violin plots showing expression of DEGs in each module. Middle lines indicate median values (white) with 25th to 75th quartiles (black). *P < 0.05, **P < 0.01, ***P < 0.001, significance between diseased conditions; #P < 0.05, decreased compared with healthy blood, 2-sided Mann-Whitney U test.
Figure 3
Figure 3. CRC niche drives proangiogenic transcriptional programming in TANs.
(A) GO network analyses of enriched biological processes in peripheral blood PMNs and (B) TANs in advanced CRC. Node size reflects significance of the enrichment test where the edges reflect overlap of GO terms involved in connected biological processes. (C) Analysis of GO:0001525 (Angiogenesis). Dotted outlines show enriched DEGs in TANs (magenta) and blood PMNs (blue). (D) GO terms enriched for the indicated PMN conditions. Significance of enrichment (FDR < 0.05) was indicated in magenta. The size of each dot shows the percentage of DEGs enriched in each of the specified GO terms. Magenta arrows indicate GO terms associated with vasculature development, angiogenesis, and endothelial cell functions. (E) GSEA and overrepresented pathways in advanced CRC TANs. Pathways were ranked based on normalized enrichment score (NES) with adjusted FDR < 0.05 following Benjamini-Hochberg’s correction. Inflammatory and angiogenesis-related pathways are highlighted in red and magenta, respectively.
Figure 4
Figure 4. TANs promote tumor vascularization and vessel-tumor depth penetration.
(A) Representative IHC images of intratumoral (green) and stromal (blue) blood vessels (stained for PECAM-1) in PMNhi (isotype-treated) and PMNlo (treated with anti-Ly6G/MAR18.5) tumors. Scale bar: 200 μm. (B) High-power IHC images depict elevated vascular density in PMNhi versus PMNlo tumors. Scale bar: 50 μm. Dashed line demarcates intratumor versus stromal regions. (C) Quantification of vessel density from images shown in A and B (n = 5 mice and 8–13 whole-tumor sections per condition). (D) Quantification of vessel-tumor depth penetration and TAN presence. (E) 3D reconstruction (rendering planes in XZ direction) and Z-stack projections of whole-mount tumor tissue in early and advanced PMNhi versus PMNlo tumors. For each image, 100 μm stacks were generated using 1 μm-focal depth steps. (F) Orthogonal views used for vessel depth penetration analyses (right) depicting a tricellular contact between TANs (green), invading blood vessels (blue), and the CRC interface (red) (n = 4–6 mice per condition with 50–70 z-stacked images analyzed). Scale bar 10 μm. *P < 0.05, **P < 0.01, ****P < 0.0001, 1-way ANOVA with Tukey’s multiple comparison test.
Figure 5
Figure 5. TANs modulate multimodal parameters of vascular architecture and spatial organization.
(A) Representative confocal microscopy images of whole-mount tumor vasculature (stained for PECAM-1) in early and advanced PMNhi versus PMNlo tumors. Scale bar: 50μm. Images are representative of n = 6 tumors with 50–70 FOVs per condition. (B) Illustration of 8 architectural parameters assessed for vascular architecture within tumors and tumor-adjacent regions. (CJ) Quantification of architectural and spatial organization factors constructing the vasculature observed in PMNhi versus PMNlo tumors and the nontumor submucosal capillary plexus. For panels CH, each data point represents an individual FOV (600–1,000 vessels analyzed from 50–70 FOVs from 6–8 mice/condition) shown as distribution of the indicated parameters with median values (black line) and 25th to 75th quartiles (white line). For panels I and J, each data point represents a tumor-bearing mouse with combined FOV analysis from all tumors. *P < 0.05, ***P < 0.001, ****P < 0.0001, 1-way ANOVA with Tukey’s multiple comparison test.
Figure 6
Figure 6. Angiogenic TANs express high levels of MMP14 and SPP1/OPN.
(A) Volcano plots of DEGs (red) enriched in peripheral blood PMNs and CRC TANs from early (left) and advanced (right) CRC. Red dotted circle highlights Spp1 (encoding OPN) and Mmp14 (encoding MT1-MMP) as top enriched genes in advanced CRC (P < 10–100). (B) Row-scaled heatmap representation of elevated levels of established angiogenic factors including proteases and vessel growth factors in TANs. (C) Representative confocal microscopy images of FACS-sorted blood PMNs and TANs from advanced CRC stained for intracellular levels of MMP14 and OPN proteins (white). Nuclei were by Hoechst staining (blue). Scale bar: 5 μm. Images representative of n = 4 independent experiments. (D) Volcano plot (left) stratified COAD patients from Pan-Cancer Atlas (n = 592) into altered (MMP14hi/SPP1hi, n = 469 with log ratio > 1.5, adjusted P cutoff = 0.01) or unaltered (n = 123 remaining patients) groups. Expression levels of PMN markers ITGAM/CD11b (middle) and EC marker PECAM1 (right) were compared between MMP14hi/SPP1hi and unaltered groups by 2-sided student’s t test (P value and FDR-adjusted q value are shown). (E) mRNA expression (normalized to adjacent noninflamed or noncancerous tissues) analysis of clinical specimens from UC patients (n = 3 inactive UC, n = 3 active UC, n = 10 severe UC polyps) and CRC patients (n = 3 grade 1, n = 6 grade 3). (F) Schematic and (G) mRNA expression analyses of established angiogenic genes in BM-derived PMNs following 24 hours incubation with dissociated healthy colon, CRC, or cancer-adjacent tissue. Gene expression was normalized to unexposed PMNs cultured in the same setup (n = 4 independent experiments). *P < 0.05, **P < 0.01, ***P < 0.001 (2-sided student’s t test, exposed versus unexposed BM-derived PMNs). #P < 0.05, 1-way ANOVA with Tukey’s multiple comparison test.
Figure 7
Figure 7. TAN-derived OPN and MMP14 promote endothelial cell migration and vascular branching.
(A) Schematic of in vitro EC functional assays. (B) Representative images of the EC migration assay using cultured bEND cells with or without TAN-derived supernatant (1:1 PMN/EC ratio) or rOPN, rVEGF treatment with or without specific antibody inhibition. Scale bar: 75 μm. (C) Quantification of EC migration (relative to serum-free condition) following coincubation with TAN-conditioned media, with or without antibody-mediated inhibition of OPN (6 μg/mL) and MMP14 (10 μg/mL). (D) Representative images of EC tube formation assay using cultured bEND cells with or without TAN-derived supernatant treatment (1:3 PMN/EC ratio), or rMMP14 with the indicated antibody inhibition. Scale bar: 10μm. (E) Quantification of formed tube numbers per FOVs upon coincubation with TAN-conditioned media, with or without antibody-mediated inhibition of OPN (6 μg/mL) or MMP14 (10 μg/mL). (F) Dose-response curves of cultured murine bENDs treated with rMMP14 with or without MMP14 inhibition. (G) Dose-response curves of cultured HUVECs following stimulation with catalytic domain (CD) or full-length (FL) rMMP14 (0.01–20 μg/mL), with or without Ab-inhibition of MMP14 (10 μg/mL). For tube formation and EC migration, images are representative of n = 2 independent repeats with TAN supernatants isolated from 3 mice for each performed in duplicates. For recombinant protein, n = 3 independent repeats performed in triplicates. For all quantifications, 15–20 FOVs were analyzed for each condition. For EC transmigration assay, 2-sided student’s t test was performed to compare treatments with serum-free condition. ****P < 0.0001, ####P < 0.0001, MMP14 blockade versus nonblocking conditions. For tube formation assays in bEND or HUVEC cells, 1-way ANOVA was performed comparing Ab-blockade versus control conditions and between different concentrations of recombinant proteins. *P < 0.05, **P < 0.01, ***P < 0.001, ****P < 0.0001, between treatment conditions. §§P < 0.01, §§§§P < 0.0001, selected dose(s) relative to the minimal rMMP14 dose of 0.01 μg/mL.
Figure 8
Figure 8. Pharmacological inhibition of TAN recruitment or MMP14 inhibition promotes CRC regression.
(A) Schematic of the treatment regimens. (B) Representative macroscopic images of excised colons and high-resolution endoscopic images of advanced CRC (week 15) treated with either vehicle, anti-VEGFR2 neutralizing mAb (clone DC101(49), 50 mg/kg/day, 3 times/week), CXCR2 inhibitor, Reparixin (5 mg/kg/day (46, 47), daily) or MMP14 allosteric inhibitor NSC 405020 (2.0 mg/kg/day (45), 3 times/week). Scale bar: 1mm. (C) Flow cytometry analyses of Ly6G+/CD11b+/Lyz2hi blood PMN and TAN numbers following indicated treatments (n = 6–9 mice/treatment). (D) Quantifications of tumor penetrance, (E) individual tumor volume, (F) tumor burden (cumulative tumor volume), and (G) cell death indicated by % Annexin V+ and SYTOX-Red+ following flow cytometry analysis (Vehicle/ isotype, n = 9; Anti-VEGFR2, n = 6; Reparixin, n = 6; MMP14, n = 9 mice; 1-way ANOVA with Dunnett’s multiple comparison test). *P < 0.05, **P < 0.01, ***P < 0.001, ****P < 0.0001, 1-way ANOVA with Tukey’s multiple comparison test.
Figure 9
Figure 9. MMP14 activity is required for collagen processing and maintenance of the tumor vasculature.
(A) Representative whole-mount fluorescence confocal microscopy images of tumor vasculature (stained for PECAM-1, left, middle panels) and of the advanced CRC niche (CRC/EpCAM, red; TANs/Lyz2, green; vessels/PECAM-1, blue, right panel) at treatment endpoints. Scale bars: 50μm. (BE) Quantification of vascular architecture parameters from tumor images following specified treatments. Images representative of 3 independent experiments with 50 FOVs analyzed per group (Vehicle/isotype, n = 6, Anti-VEGFR2, n = 6, Reparixin, n = 6, MMP14i, n = 8 mice, 1-way ANOVA with Tukey’s multiple comparison test). For analyses presented in panel L, a total of approximately 1,000 vessels per treatment conditions were analyzed. *P < 0.05, **P < 0.01, ***P < 0.001, ****P < 0.0001. (F) Representative IHC staining of the tumor vascular network (PECAM-1, top), Collagen I (middle, primary substrate) and Laminin-1 (bottom, secondary substrate) for the specified treatment groups. Scale bar: 20μm. (G) Quantification of vessel coverage, (H) Collagen 1, and (I) Laminin 1 coverage in tumor tissues following specified treatments. (J) Quantification of staining intensity as an index of Collagen I and (K) Laminin-1 levels. For all image analyses, 50 FOVs per treatment group from n = 4–5 mice were quantified. *P < 0.05, **P < 0.01, ****P < 0.0001, 1-way ANOVA with Tukey’s multiple comparison test.
Figure 10
Figure 10. MMP14 inhibition curbs tumor growth in a CRC PDX model.
(A) Schematic of human CRC tumor grafting into NGS mice, followed by vehicle control (C) or MMP14i treatment (M, NSC405020, 2.0 mg/kg/day (45)). (B) Spaghetti plots of individual PDX tumor growth curves and (C) Representative endpoint PDX images (day 42/week 6). Scale bar: 1cm. (D) Quantification of endpoint tumor burden indexed by volume and (E) weight following MMP14 inhibition (vehicle, n = 4; MMP14i, n = 6 mice). (F) Representative whole-mount, fluorescence confocal microscopy images of endpoint PDX vasculature (stained for PECAM-1). Scale bar: 50μm. (GI) Quantification of vascular architecture parameters from endpoint tumor vessel images. Images are representative of n = 4–6 mice per condition with 50–75 FOVs analyzed per group. For I, a total of approximately 1000 vessels per treatment were analyzed. **P < 0.01, ****P < 0.0001, 2-sided student’s t test.
Figure 11
Figure 11. MMP14 inhibition promotes collagen accumulation and profibrotic programs in CRC PDXs.
(A) Representative fluorescence staining of CRC vasculature (PECAM-1, red) and Collagen I (green, MMP14 substrate) in tumor and stromal regions. Nuclei were counterstained by Hoechst (blue). White outlines and arrows indicate intact and disrupted vessels with abnormal morphologies, respectively. (B) Quantification of fluorescence intensity as an index of Collagen I levels (top) and staining coverage in tumor tissue following the specified treatment (vehicle, n = 4; MMP14i, n = 6 tumors with 50–70 FOVs analyzed per group). ***P < 0.001, ****P < 0.0001, 2-sided student’s t test. (C) Metascape GO analyses of MMP14i-treated tumors highlight enriched pathways involved in Collagen fibril and matrix formation (red, upregulation) versus cell cycle/metabolism (blue, downregulation). A cutoff of FDR < 0.05 following Benjamini-Hochberg’s correction was set for GO enrichment analysis. (D) GSEA of the MSigDB “50 Hallmarks’”gene set specifies pathways upregulated (NES > 0, red) and downregulated (NES < 0, blue) following MMP14i inhibition. Pathways were ranked based on NES with FDR < 0.05 following Benjamini-Hochberg’s correction. (E) Representative H&E (top, scale bar: 500μm) and dual-stained IHC images (middle and bottom, scale bar: 30 μm) of advanced-stage CRC patients enriched for MMP14 and MMP14+ S100A9+ TANs. In H&E view, the cancerous lesions (red outline) and cancer-adjacent colon regions (black outline) of double-core biopsies from a stage III CRC patient were shown. Digital color deconvolution shows separate staining of S100A9 (red), MMP14 (brown), and nuclei (blue) of double-positive TAN clusters (dotted circles) within intratumoral regions.

References

    1. Bui TM, et al. Neutrophils alter DNA repair landscape to impact survival and shape distinct therapeutic phenotypes of colorectal cancer. Gastroenterology. 2021;161(1):225. doi: 10.1053/j.gastro.2021.03.027. - DOI - PubMed
    1. Butin-Israeli V, et al. Neutrophil-induced genomic instability impedes resolution of inflammation and wound healing. J Clin Invest. 2019;129(2):712–726. doi: 10.1172/JCI122085. - DOI - PMC - PubMed
    1. Lee SH, et al. Immunological pathogenesis of inflammatory bowel disease. Intest Res. 2018;16(1):26–42. doi: 10.5217/ir.2018.16.1.26. - DOI - PMC - PubMed
    1. Shaul ME, Fridlender ZG. Tumour-associated neutrophils in patients with cancer. Nat Rev Clin Oncol. 2019;16(10):601–620. doi: 10.1038/s41571-019-0222-4. - DOI - PubMed
    1. Mizuno R, et al. The role of tumor-associated neutrophils in colorectal cancer. Int J Mol Sci. 2019;20(3):529. doi: 10.3390/ijms20030529. - DOI - PMC - PubMed

Substances