Multicenter Study
. 2024 Feb 8;20(2):e1010980.
doi: 10.1371/journal.pcbi.1010980. eCollection 2024 Feb.

Multiscale networks in multiple sclerosis

Affiliations
Multicenter Study

Multiscale networks in multiple sclerosis

Keith E Kennedy et al. PLoS Comput Biol. .

Abstract

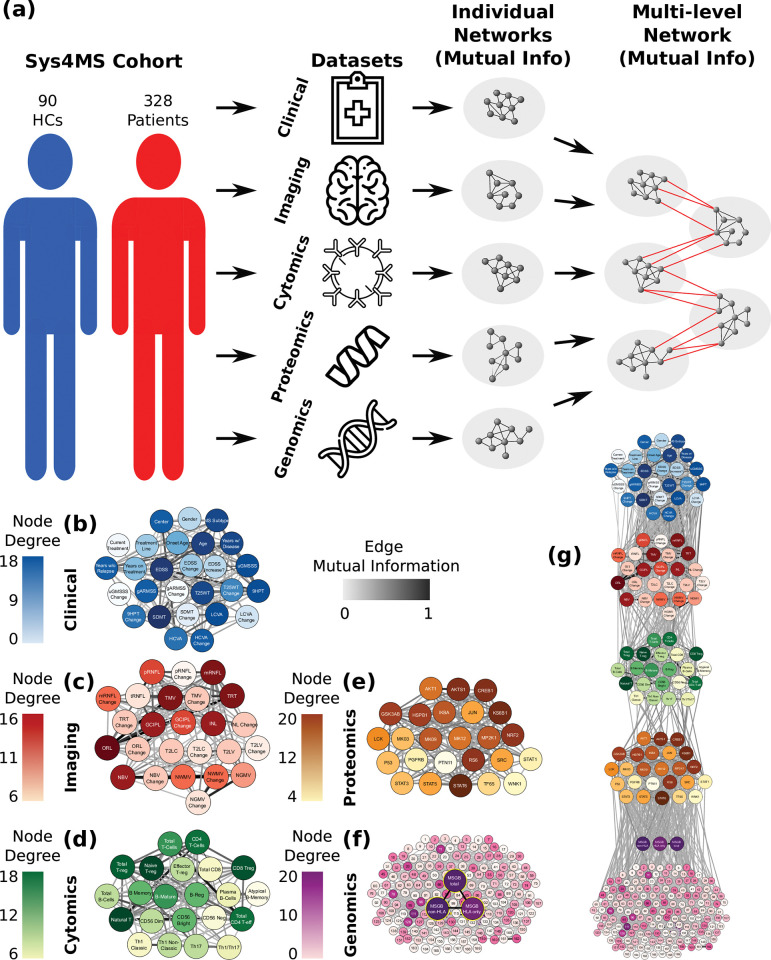
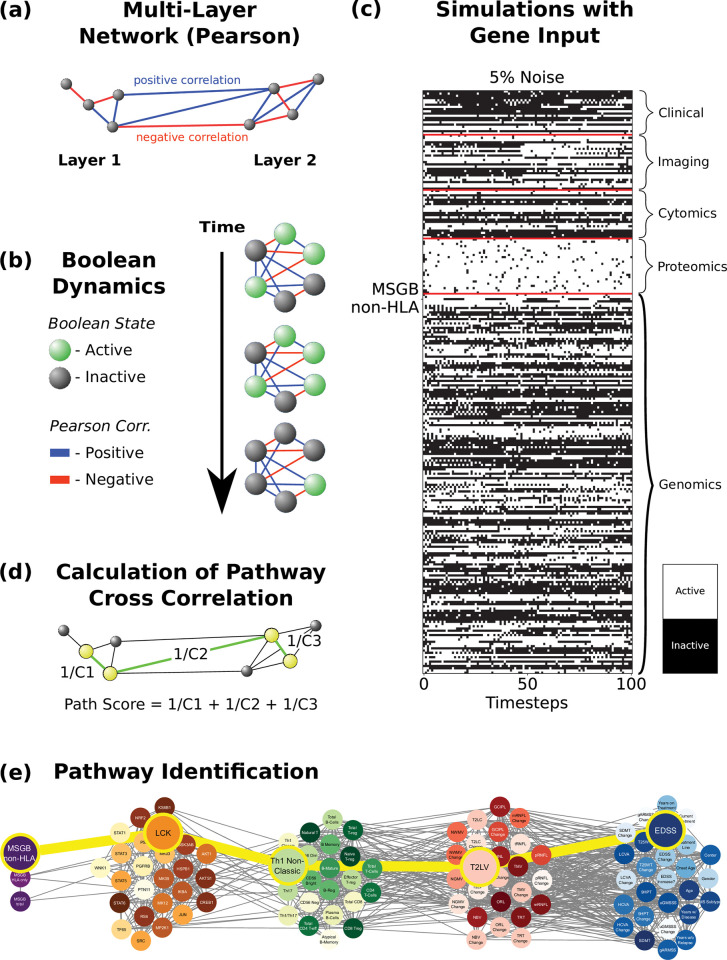
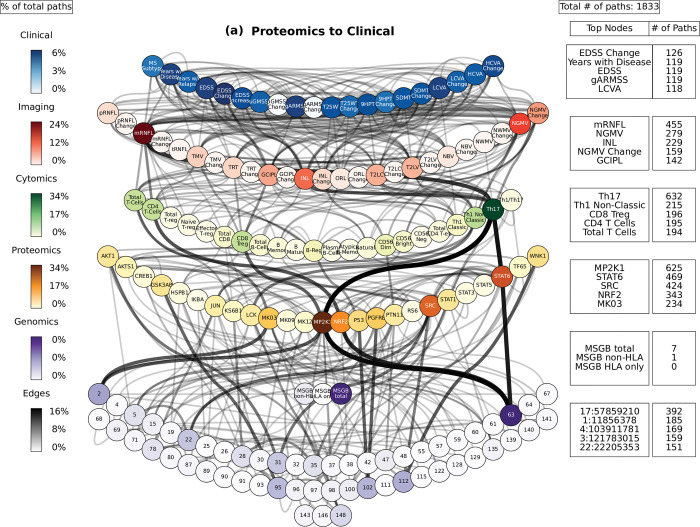
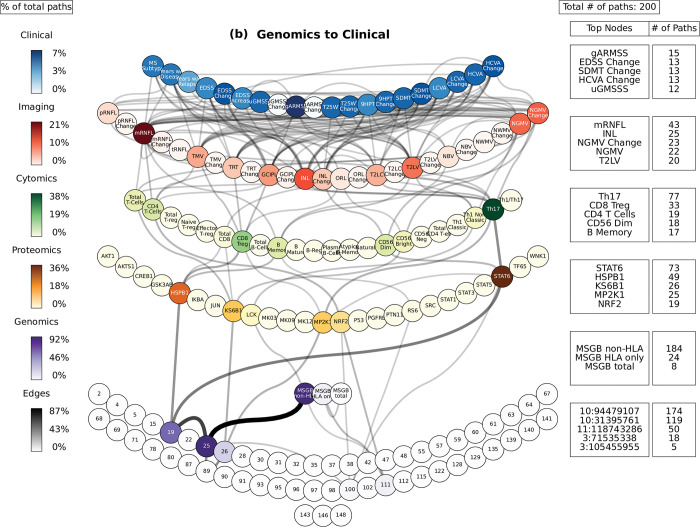
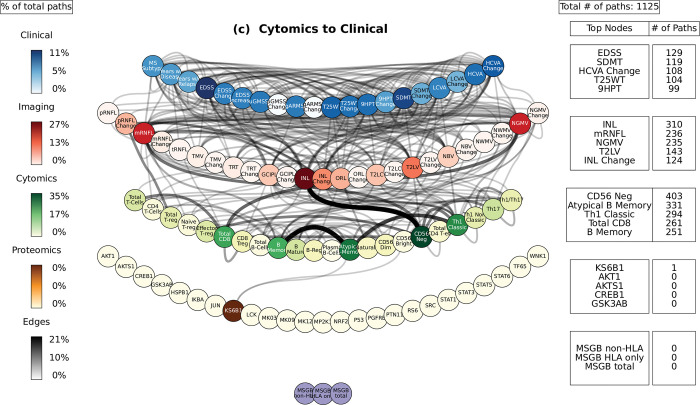
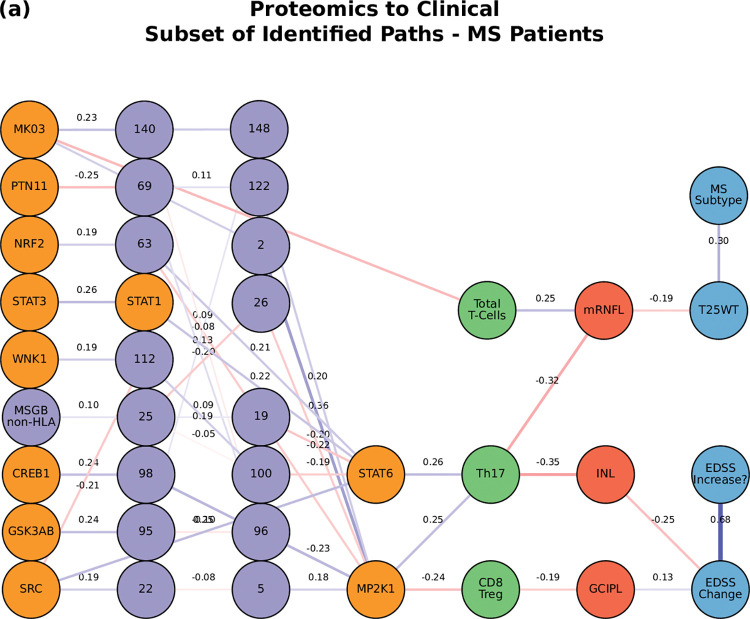
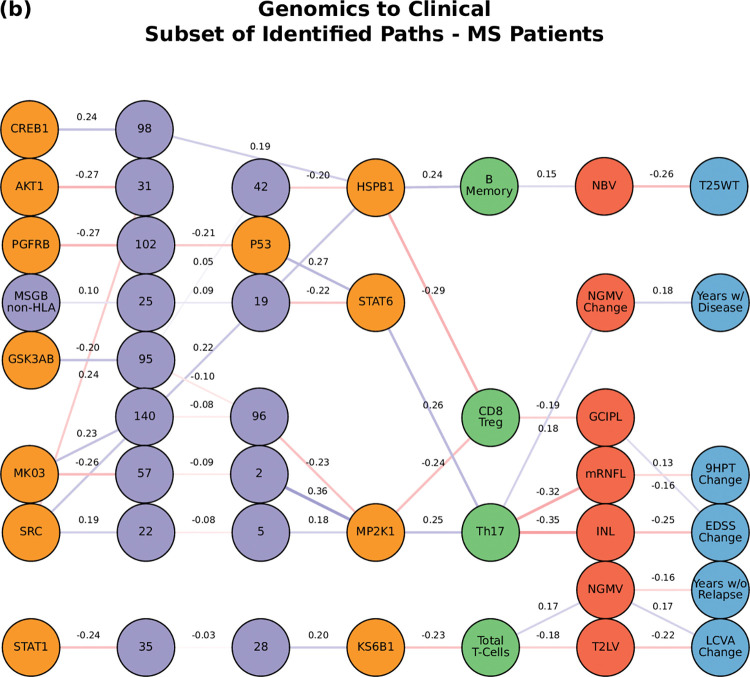
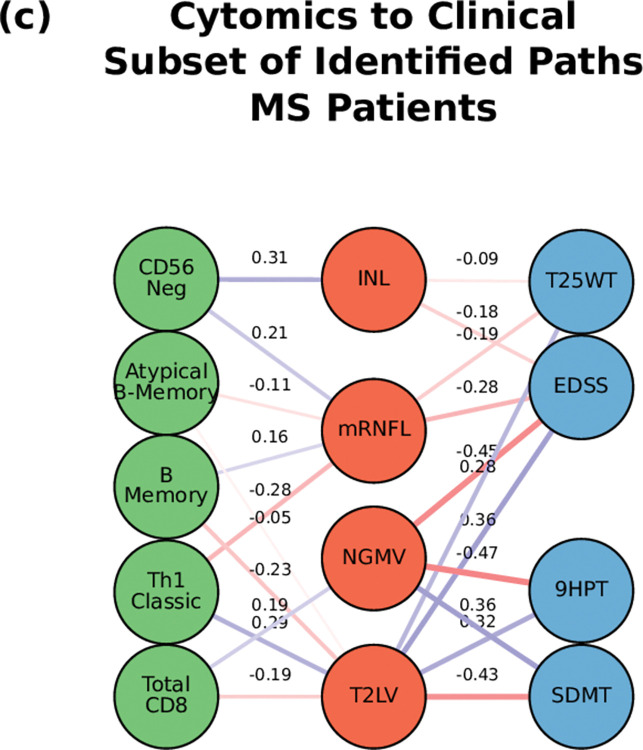
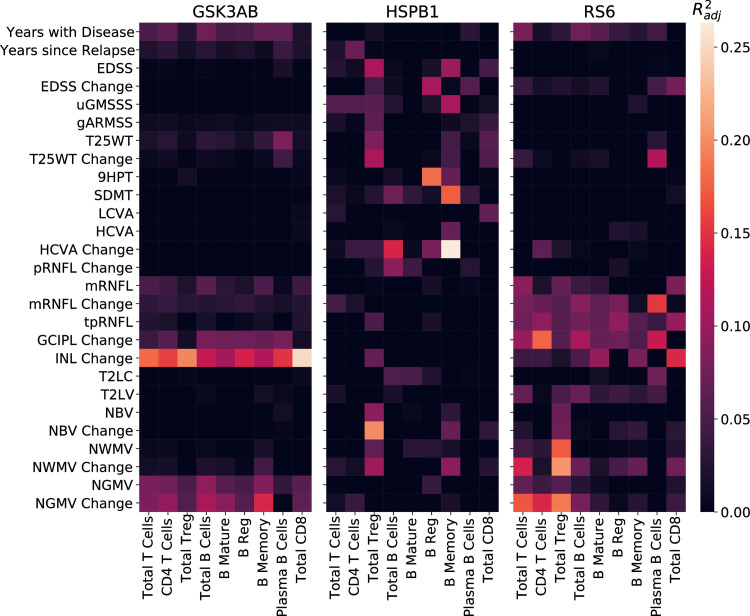
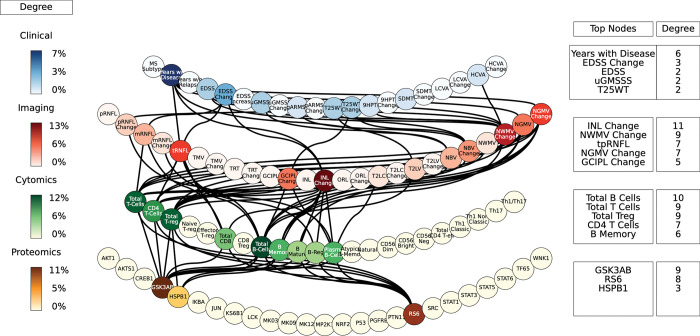
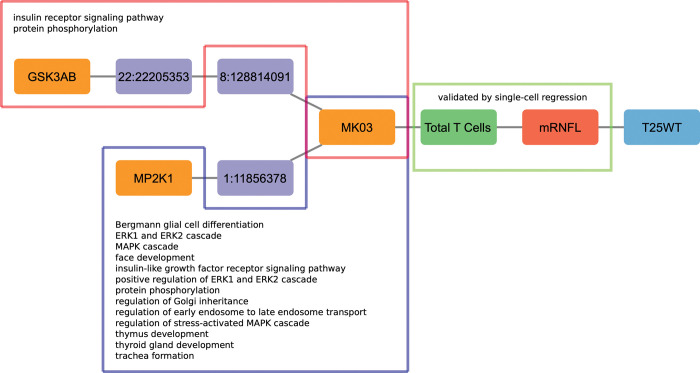
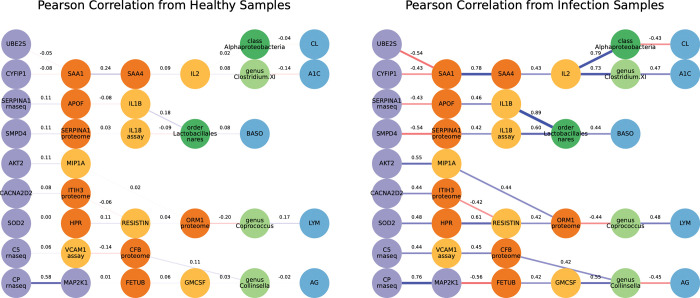
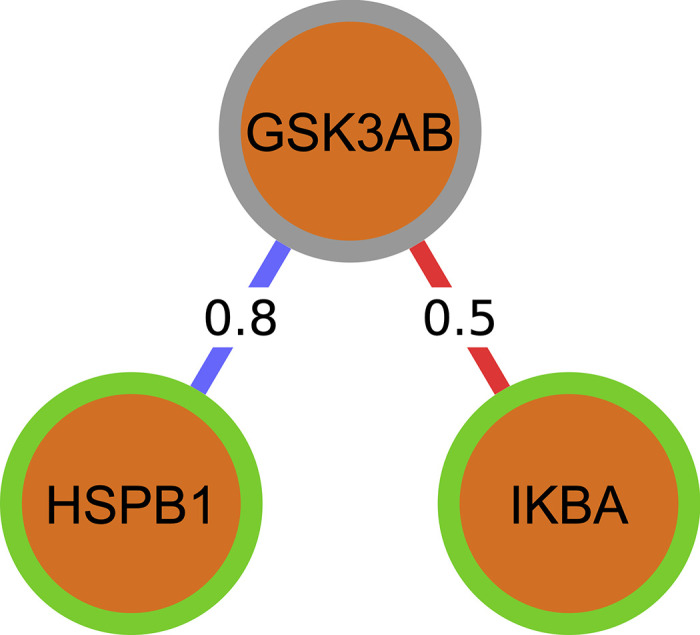
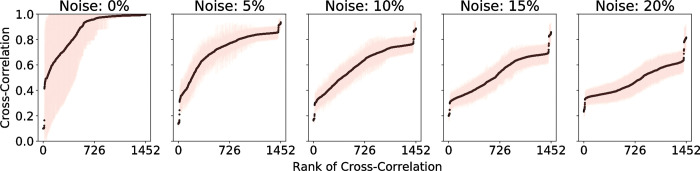
Complex diseases such as Multiple Sclerosis (MS) cover a wide range of biological scales, from genes and proteins to cells and tissues, up to the full organism. In fact, any phenotype for an organism is dictated by the interplay among these scales. We conducted a multilayer network analysis and deep phenotyping with multi-omics data (genomics, phosphoproteomics and cytomics), brain and retinal imaging, and clinical data, obtained from a multicenter prospective cohort of 328 patients and 90 healthy controls. Multilayer networks were constructed using mutual information for topological analysis, and Boolean simulations were constructed using Pearson correlation to identified paths within and among all layers. The path more commonly found from the Boolean simulations connects protein MK03, with total T cells, the thickness of the retinal nerve fiber layer (RNFL), and the walking speed. This path contains nodes involved in protein phosphorylation, glial cell differentiation, and regulation of stress-activated MAPK cascade, among others. Specific paths identified were subsequently analyzed by flow cytometry at the single-cell level. Combinations of several proteins (GSK3AB, HSBP1 or RS6) and immune cells (Th17, Th1 non-classic, CD8, CD8 Treg, CD56 neg, and B memory) were part of the paths explaining the clinical phenotype. The advantage of the path identified from the Boolean simulations is that it connects information about these known biological pathways with the layers at higher scales (retina damage and disability). Overall, the identified paths provide a means to connect the molecular aspects of MS with the overall phenotype.


Conflict of interest statement

We have read the journal’s policy and the authors of this manuscript have the following competing interests: KK reports no disclosures. NKdR reports no disclosures. AU received grants and contracts from FISM, Novartis, Biogen, Merck, Fondazione Cariplo, Italian Ministry of Health, received honoraria, or consultation fees from Biogen, Roche, Teva, Merck, Genzyme, Novartis. FI reports no disclosures. MC reports no disclosures. HFH has received honoraria for lecturing or advice from Biogen, Merck, Roche, Novartis and Sanofi. TB has received unrestricted research grants from Biogen and Sanofi-Genzyme. SDB reports no disclosures. EH received honoraria for lecturing and advisory board activity from Biogen, Merck and Sanofi-Genzyme and unrestricted research grant from Merck. SBI reports no disclosures. SAdRB reports no disclosures. FP received honoraria and research support from Alexion, Bayer, Biogen, Chugai, Merck Serono, Novartis, Genzyme, MedImmune, Shire, Teva, and serves on scientific advisory boards for Alexion, MedImmune, and Novartis. He has received funding from Deutsche Forschungsgemeinschaft (DFG Exc 257), Bundesministerium fu?r Bildung und Forschung (Competence Network Multiple Sclerosis), Guthy Jackson Charitable Foundation, EU Framework Program 7, National Multiple Sclerosis Society of the USA. AUB is named as inventor on multiple patents and patents pending owned by Charité - Universitätsmedizin Berlin and/or University of California Irvine for visual computing-based motor function analysis, multiple sclerosis serum biomarkers, and retinal image analysis. He is cofounder and holds shares of Motognosis GmbH and Nocturne GmbH. He serves on the executive board and is Treasurer/Secretary of IMSVISUAL. He received research support from BMWi, BMBF, NIH ICTS, the Kathleen C. Moore Foundation and the Guthy- Jackson Charitable Foundation. Priscilla Ba?cker-Koduah is funded by the DFG Excellence grant to FP (DFG exc 257) and is a Junior scholar of the Einstein Foundation. CC received honoraria for speaking from Bayer and research funding from Novartis, unrelated to this study. SA received a conference grant from Celgene and honoraria for speaking from Alexion, Bayer and Roche. JB reports no disclosures. JSR declares funding from GSK & Sanofi and fees from Travere Therapeutics & Singularity Bio. MR reports no disclosures. LGA is founder and hold stocks at ProtATonce. MA is an employee of Hoffman-La Roche AG, yet this article is related to his activity at the Hospital Clinic of Barcelona. EHML is an employee of the European Medicines Agency (Human Medicines) since 16 April 2019, yet this article is related to her activity at the Hospital Clinic of Barcelona and consequently, it does not in any way represent the views of the Agency or its Committees. SL received compensation for consulting services and speaker honoraria from Biogen Idec, Novartis, TEVA, Genzyme, Sanofi and Merck. AS received compensation for consulting services and speaker honoraria from Bayer-Schering, Merck- Serono, Biogen-Idec, Sanofi-Aventis, TEVA, Novartis and Roche. EMH reports no disclosures. Elisabeth Solana received travel reimbursement from Sanofi and ECTRIMS and reports personal fees from Roche Spain. IPV is currently an employee of UCB pharma, yet this article is related to her activity at the Hospital Clinic of Barcelona. She has received travel reimbursement from Roche Spain and Genzyme-Sanofi, European Academy of Neurology, and European Committee for Treatment and Research in Multiple Sclerosis for international and national meetings over the last 3 years; she holds a patent for an affordable eye-tracking system to measure eye movement in neurologic diseases, and she holds stock in Aura Innovative Robotics. JGO reports no disclosures. PV has received consultancy fees and held stocks from Accure Therapeutics SL, Attune Neurosciences Inc, Spiral Therapeutics Inc, QMenta Inc, CLight Inc, NeuroPrex Inc, StimuSIL and Adhera Health Inc

Figures

Fig 1
Fig 1. Building multilayer networks using multi-omics, imaging, and clinical data.
(a) Illustration of network construction. The data from each layer is taken from the cohorts and used to create networks, where the nodes are the elements in the dataset (genomics (SNPs), phosphoproteomics, cytomics, CNS tissue imaging, and clinical data), and the edges correspond to the mutual information between element pairs across all subjects. Once individual networks are created, they are linked together, again using mutual information, following a hierarchy that connects each layer successively, starting with genomics and working up to the phenotypic (clinical) layer. (b-f) Topology of individual layer networks from the experimental data. In each of the networks, the degree of each node is color-coded, with higher degrees in darker colors. The edge weights are coded in gray scale in a similar manner, with a darker edge representing a higher weight, and thus a higher correlation between nodes. The genomics network was enriched with the previous knowledge on regulatory networks (f) and included the MS genetic burden scores (g). In the combined five-layer network, the layers are connected using the hierarchy described above, with genomics at the bottom and clinical phenotype at the top. These networks are meant to show the nodes that are more highly correlated with other nodes in the network. They provide the base to examine the topological structure of the overall multilayer network. High resolution network representations for single-layer networks are available at Github link https://keithtopher.github.io/single_networks/#/ and for multilayer networks at https://keithtopher.github.io/combo_networks/#/. Icons used in the figure are open source from onlinewebfonts.com, flaticon.com and icons8.com.
Fig 2
Fig 2. Network densities within and between layers.
(left) The density for each layer was calculated as the ratio of the sum of the weights of all connections and the number of possible connections. The analysis was made using the 67 subjects with complete data in all 5 layers. (right) The network from which the density was calculated. Nodes from all layers were connected together, opposed to the network model with the hierarchy shown before. See high resolution network at https://keithtopher.github.io/combo_networks/#/.
Fig 3
Fig 3. Dynamic network analysis: identification of gene-protein-cell paths.
(a) Networks are constructed using all five layers. The nodes are the same as in the networks above (Fig 1), but now the edges are defined by the Pearson correlation, where the weights represent the Pearson coefficient, which can be either positive or negative. (b) Boolean dynamics are applied to the networks, where the activation state of the nodes changes based on the total sum of the edge weights of its direct neighbors (considering the signs of the connections). (c) Boolean simulations are run where the various nodes, in the example MSGB non-HLA, are used as the input signal, and the simulation was run with 5% noise (see Methods for noise analysis). (d) The cross-correlation coefficient (Cn) is calculated between the signals for each pair of connected nodes. A path score is calculated for all possible paths, defined as the sum of the inverses of the cross-correlation coefficients between all pairs of consecutive nodes constituting a given path. (e) Finally, a path is identified by using a shortest path algorithm which is based on its path score (see Methods).
Fig 4
Fig 4. Path analysis in MS patients.
Representations of the multi-layer paths identified from the Boolean simulations when the input started at the phosphoproteomics layer. The top paths (those that passed the test for negative controls) are shown for each input (gene, protein, or cell)-output (clinical phenotype) pair. The nodes for each layer are color-coded to represent the degree of a given node, i.e., the number of times the node appears in a path, as a percentage of the total number of paths. High resolution paths are available at https://keithtopher.github.io/fivelayer_pathways/.
Fig 5
Fig 5. Path analysis in MS patients.
Representations of the multi-layer paths identified from the Boolean simulations when the input started at the genomics layer. The top paths (those that passed the test for negative controls) are shown for each input (gene, protein, or cell)-output (clinical phenotype) pair. The nodes for each layer are color-coded to represent the degree of a given node, i.e., the number of times the node appears in a path, as a percentage of the total number of paths. High resolution paths are available at https://keithtopher.github.io/fivelayer_pathways/.
Fig 6
Fig 6. Path analysis in MS patients.
Representations of the multi-layer paths identified from the Boolean simulations when the input started at the cytomics layer. The top paths (those that passed the test for negative controls) are shown for each input (gene, protein, or cell)-output (clinical phenotype) pair. The nodes for each layer are color-coded to represent the degree of a given node, i.e., the number of times the node appears in a path, as a percentage of the total number of paths. High resolution paths are available at https://keithtopher.github.io/fivelayer_pathways/.
Fig 7
Fig 7. The network of the top paths associated with MS.
Paths starting at the proteomic layer.
Fig 8
Fig 8. The network of the top paths associated with MS.
Paths staring at the genetic layer (MSGB).
Fig 9
Fig 9. The network of the top paths associated with MS.
Paths starting at the cytomic layer.
Fig 10
Fig 10. Linear regression models between phosphoproteins, cell subtypes and clinical phenotype.
Linear regression analysis relating the percentage of immune cell subtypes expressing phosphorylated GSK3AB, HSBP1 or RS6 with the phenotype. The heatmap shows the adjusted R2 of the significant models. EDSS: Expanded Disability Status Scale; GMSSS: Global Multiple Sclerosis Severity Score; T25WT: timed 25 feet walking test; 9HPT: nine- hole peg test; LCVA: low contrast (2.5%) visual acuity; HCVA: high contrast visual acuity; RNFL: retinal nerve fiber layer (m: macular; tp: temporal peripapillary); INL: inner nuclear layer; T2LV: T2 lesion volume; ORL: outer retinal layer; NBV: normalized brain volume; NWMV: normalized white matter volume; NGMV: normalized gray matter volume.
Fig 11
Fig 11. Multilayer paths from single cell cytometry assays.
Each of the edges was defined using the linear regression analysis of the flow cytometry data. An edge is considered if it was part of a significant regression model and also appeared as part of a path in the original five-layer network constructed from MS patient data (from Fig 4). The edges are weightless, and only show if that particular edge in any of the original paths was present. https://keithtopher.github.io/fivelayer_pathways/.
Fig 12
Fig 12. Venn diagram describing the overlap between the paths identified in the single-cell analysis and the paths identified in the UNIPROT database.
(1) CD56 Neg > INL—mRNFL > EDSS—T25WT; (2) Total CD8 > NGMV—T2LV > EDSS - 9HPT–SDMT; (3) MK03 > Total T Cells > mRNFL > T25WT; (4) HSPB1 > B Memory > NBV > T25WT; (5) STAT6 > Th17 > NGMV Change > Years with Disease; (6) KS6B1—LCK > Total T Cells—Th1 Non Classic > NGMV—T2LV> LCVA Change—MSSS—Years since Relapse; (7) MP2K1—STAT6 > Th17 > mRNFL > T25WT—ARMSS (8) MP2K1—STAT6 > Th17 > INL > EDSS Change; (9) MP2K1 > CD8 Treg > GCIPL > EDSS Change; (10) Atypical B Memory–B Memory–Th1 Classic > mRNFL–T2LV > EDSS–T25WT.
Fig 13
Fig 13. Connection of the path from Boolean simulations with biological pathways (Path (1)) and validation by single-cell analysis.
Highlighted in the red and blue boxes are the nodes that are involved with the biological pathways written inside. Highlighted in the green box is the edge that was validated by single-cell regression.
Fig 14
Fig 14. Difference in Pearson correlation between healthy and infected cases.
The networks shown contain paths that were identified from the Boolean simulations in the infected network. Furthermore, each path contains at least two nodes from two different layers that are present in the acute phase response signaling biological pathway. The same paths do not necessarily appear in the healthy network, so edges with Pearson correlation are shown. There is a notable increase in the strength of the connections, both positive and negative, in the infected case.
Fig 15
Fig 15. Depiction of summing weights to determine next activation state in Boolean simulations.
A green border represents an active node, and a gray border represents an inactive one.
Fig 16
Fig 16. Effect of noise in Boolean simulations on the cross-correlation coefficient of the signals between nodes in the combined network.
With 0% noise, a majority of the cross-correlation values are nearly 1, which does not allow the node pairs to be easily ranked based on the strength of their connections. With 5% noise, there is more deviation in the cross-correlation values, which allows the paths between a chosen source and target to be more easily identified.
Fig 17
Fig 17. Network permutation for negative controls of paths.
The five-layer network built using Pearson correlation is used as the base network. For each of the 100 repetitions, the network was permuted by swapping the edges between pairs of nodes. In permutation 1, the edge between B and C was swapped with the edge between D and E. In the permutation 2, the edge between A and E was swapped with the edge between B and C. In permutation 3, first the edge swap from the top network was applied, followed by the edge swap from the middle network. In each case, the edge swap can only be done if it does not result in two edges between the same pair of nodes. Making the permutation in this way keeps the original degree distribution of the network. The weights for each of the edges are permuted as well. This edge swapping technique is applied 10 times for each edge in the original network. After they are permuted, the top paths for each network are identified in the same manner as before. There are three possibilities for considering whether the paths from the original network appear in the paths from the permuted networks. In permutation 1, the path exists in the permuted network and furthermore was identified as a top path. In permutation 2, the original path does exist in the permuted network but was not identified as a top path. In permutation 3, the original path doesn’t exist in the permuted network at all.

References

    1. Ogino S, Jhun I, Mata DA, Soong TR, Hamada T, Liu L, et al. Integration of pharmacology, molecular pathology, and population data science to support precision gastrointestinal oncology. NPJ Precis Oncol. 2017;1:40–8. Epub 2017/01/01. doi: 10.1038/s41698-017-0042-x. ; PubMed Central PMCID: PMC5856171. - DOI - PMC - PubMed
    1. Zhou W, Sailani MR, Contrepois K, Zhou Y, Ahadi S, Leopold SR, et al. Longitudinal multi-omics of host-microbe dynamics in prediabetes. Nature. 2019;569(7758):663–71. Epub 2019/05/31. doi: 10.1038/s41586-019-1236-x. ; PubMed Central PMCID: PMC6666404. - DOI - PMC - PubMed
    1. Price ND, Magis AT, Earls JC, Glusman G, Levy R, Lausted C, et al. A wellness study of 108 individuals using personal, dense, dynamic data clouds. Nat Biotechnol. 2017;35(8):747–56. Epub 2017/07/18. doi: 10.1038/nbt.3870. ; PubMed Central PMCID: PMC5568837. - DOI - PMC - PubMed
    1. Boccaletti S, Bianconi G, Criado R, Del Genio CI, Gomez-Gardenes J, Romance M, et al. The structure and dynamics of multilayer networks. Phys Rep. 2014;544(1):1–122. Epub 2014/11/01. doi: 10.1016/j.physrep.2014.07.001. ; PubMed Central PMCID: PMC7332224. - DOI - PMC - PubMed
    1. Aleta A, Moreno Y. Multilayer Networks in a Nutshell. Annual Review of Condensed Matter Physics. 2019;10(1):45–62. doi: 10.1146/annurev-conmatphys-031218-013259 - DOI

Publication types