. 2024 Feb 13;121(7):e2311803121.
doi: 10.1073/pnas.2311803121. Epub 2024 Feb 8.

Retinoic acid receptor α activity in proximal tubules prevents kidney injury and fibrosis

Affiliations

Retinoic acid receptor α activity in proximal tubules prevents kidney injury and fibrosis

Krysta M DiKun et al. Proc Natl Acad Sci U S A. .

Abstract

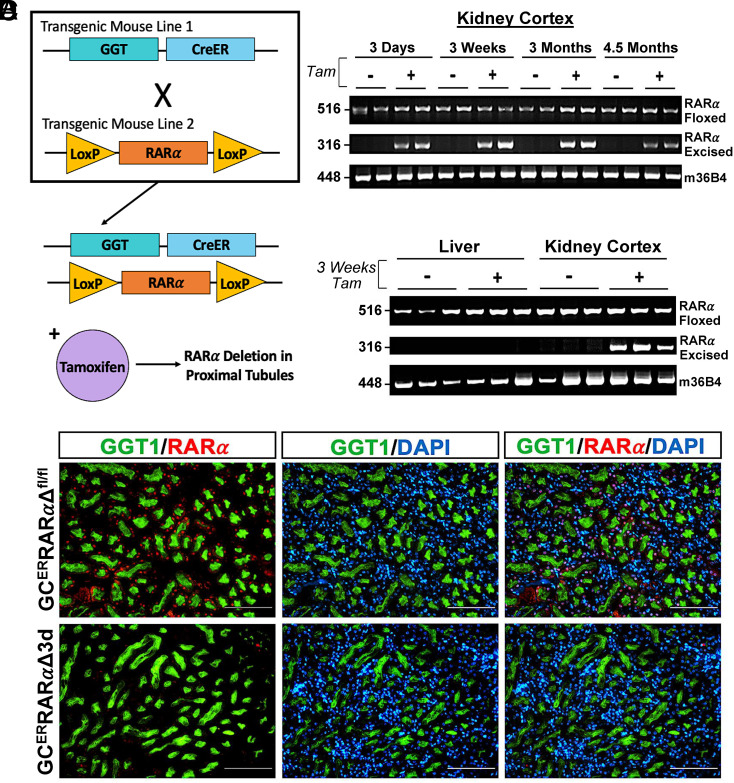
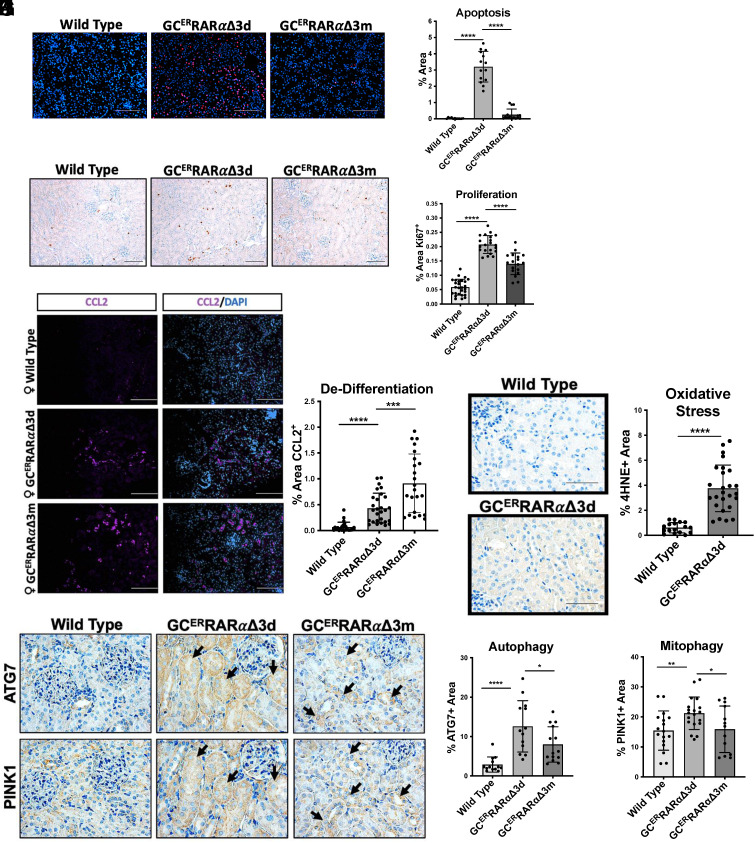
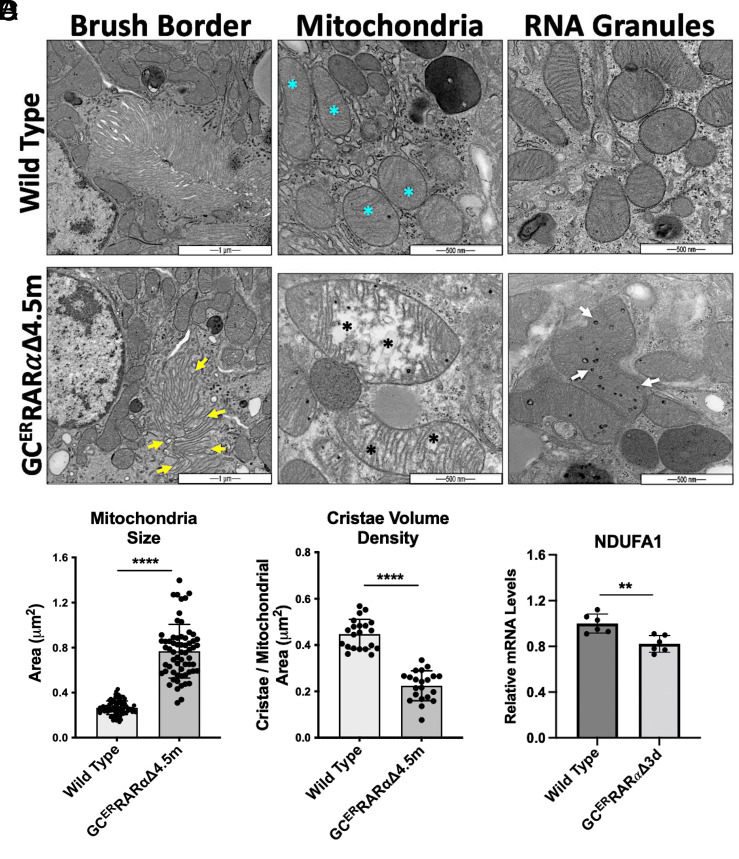
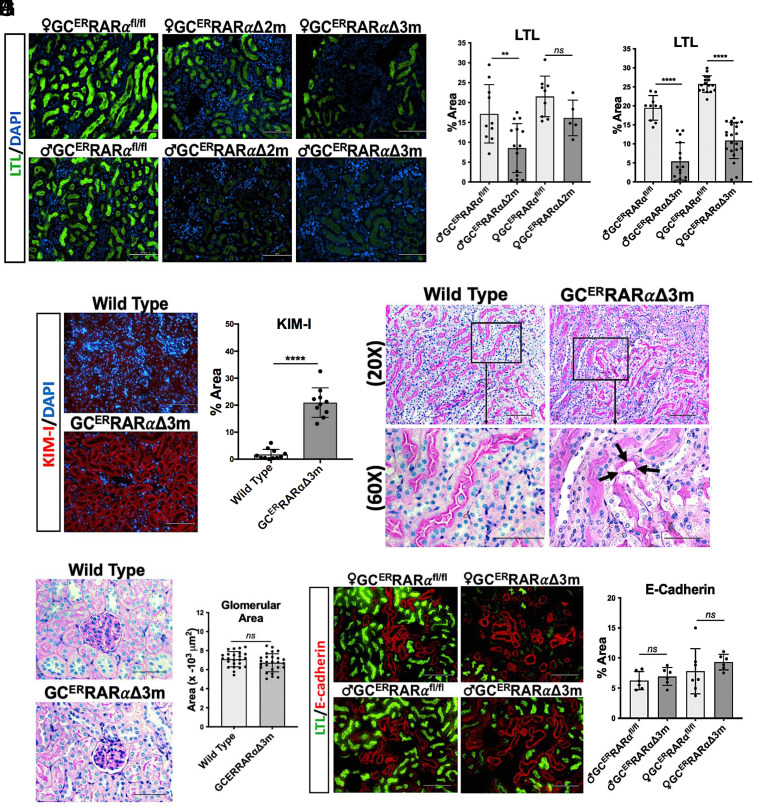
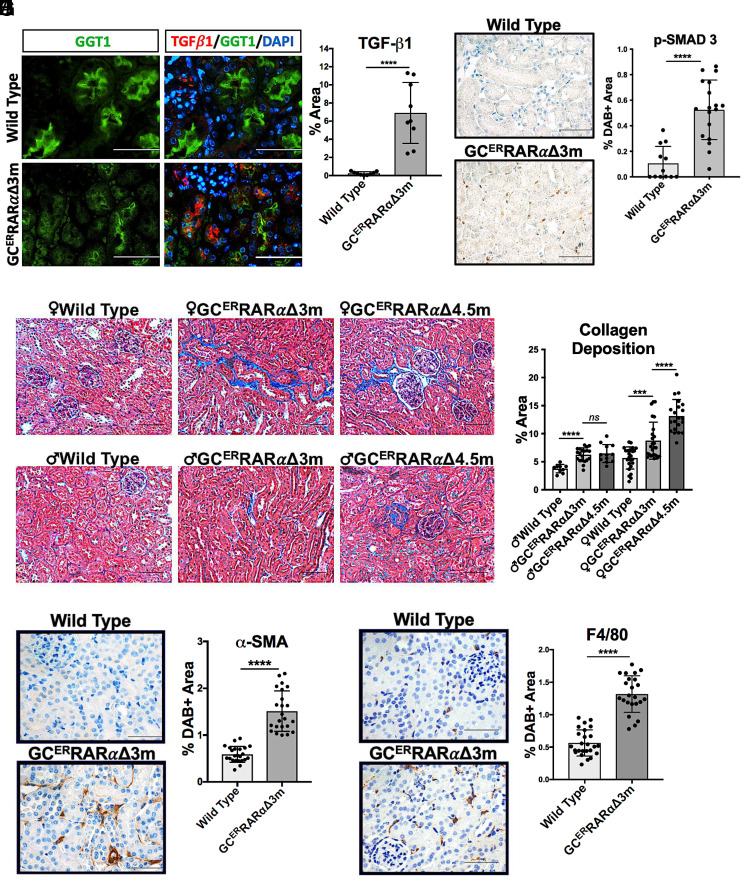
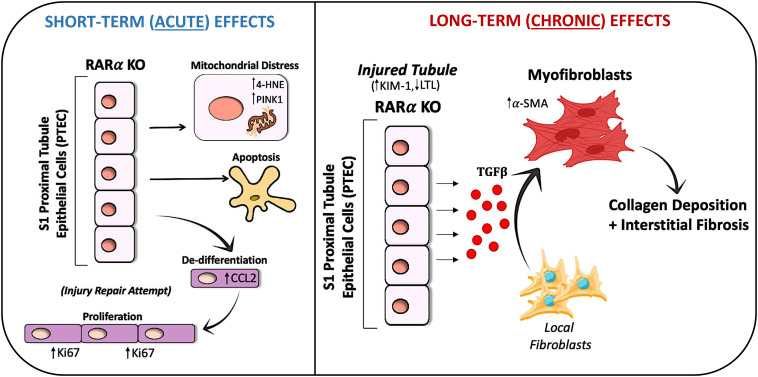
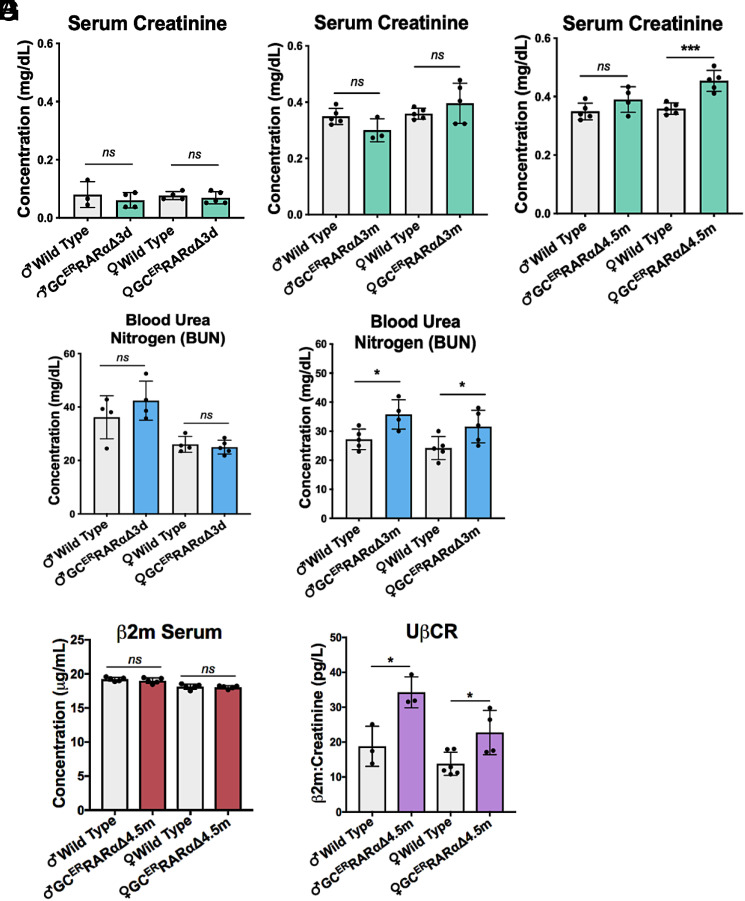
Chronic kidney disease (CKD) is characterized by a gradual loss of kidney function and affects ~13.4% of the global population. Progressive tubulointerstitial fibrosis, driven in part by proximal tubule (PT) damage, is a hallmark of late stages of CKD and contributes to the development of kidney failure, for which there are limited treatment options. Normal kidney development requires signaling by vitamin A (retinol), which is metabolized to retinoic acid (RA), an endogenous agonist for the RA receptors (RARα, β, γ). RARα levels are decreased in a mouse model of diabetic nephropathy and restored with RA administration; additionally, RA treatment reduced fibrosis. We developed a mouse model in which a spatiotemporal (tamoxifen-inducible) deletion of RARα in kidney PT cells of adult mice causes mitochondrial dysfunction, massive PT injury, and apoptosis without the use of additional nephrotoxic substances. Long-term effects (3 to 4.5 mo) of RARα deletion include increased PT secretion of transforming growth factor β1, inflammation, interstitial fibrosis, and decreased kidney function, all of which are major features of human CKD. Therefore, RARα's actions in PTs are crucial for PT homeostasis, and loss of RARα causes injury and a key CKD phenotype.

Keywords: fibrosis; kidney disease; mitochondria; proximal tubule; retinoic acid.


Conflict of interest statement

Competing interests statement:The authors declare no competing interest.

Figures

Fig. 1.
Fig. 1.
Generation of tamoxifen-inducible, PT–specific RARα KO mice. (A) Schematic of the mouse model. (B) Verification of RARα excision at various time points post-tamoxifen injection; semi-quantitative PCR of genomic DNA (n = 2/group) from kidney cortices of GCERRARαfl/fl females with (+) or without (−) tamoxifen that were killed 3 d, 3 wk, 3 mo, or 4.5 mo post-injection. m36B4 utilized as internal control. (C) Verification of tissue-specific RARα excision; semi-quantitative PCR of genomic DNA (n = 3/group) from liver and kidney cortices of GCERRARαfl/fl females with (+) or without (−) tamoxifen that were killed 3 wk post-injection. (D) Representative images (8 fields/mouse) of RARα (TXRED) and GGT1 (GFP) co-stained kidney cortices from GCERRARαΔ females 3 d post-tamoxifen and age-matched GCERRARαfl/fl females (n = 3/group). Magnification 200×. (Scale bar, 100 μm.)
Fig. 2.
Fig. 2.
RARα expression is essential for PT homeostasis, and the deletion of RARα in PTs leads to mitochondrial distress. (A) Representative images (4 to 5 fields/mouse) of TUNEL-stained kidney cortices from GCERRARαΔ females 3 d and 3 mo post-tamoxifen and wild-type females age matched to the GCERRARαΔ 3 mo post-tamoxifen group (n = 3/group). (B) Quantification of % area fluorescence from TUNEL+ cells. (C) Representative images (6 to 9 fields/mouse) of Ki67-stained kidney cortices from mice described in (A). (D) Quantification of Ki67+ % area. (E) Representative images (7 to 9 fields/mouse) of CCL2-stained kidney cortices from mice described in (A). (F) Quantification of CCL2+ % area. (G) Representative images (6 to 9 fields/mouse) of 4-HNE-stained kidney cortices from GCERRARαΔ females 3 d post-tamoxifen and age-matched wild-type females (n = 3/group). (H) Quantification of 4-HNE+ % area. (I) Representative images (6 to 9 fields/mouse) from similar areas of ATG7 and PINK1 stained kidney cortices from mice described in (A). (J) Quantification ATG7+ % area. (K) Quantification of PINK1+ % area. Magnification 200× (A, C, and E) with a 100-μm scale bar or 600× (G and I) with a 50-μm scale bar. *P < 0.05, **P < 0.01, ***P < 0.001, and ****P < 0.0001.
Fig. 3.
Fig. 3.
RARα expression maintains mitochondrial integrity and function in PT cells. (A) Representative images (15 fields/mouse) of TEM of GCERRARαΔ females 4.5 mo post-tamoxifen and age-matched wild-type females (n = 3/group). (B) Quantification of mitochondrial size (µm2) (n = 26 mitochondria/group). (C) Quantification of cristae volume density (µm2) calculated by dividing the total area of cristae per mitochondria by the total area of mitochondria (n = 7 mitochondria/group). (D) Relative mRNA levels by qRT-PCR of NDUFA1 from kidney cortices of GCERRARαΔ females 3 d post-tam and age-matched wild-type females (n = 6/group). TEM magnification at 20,000× (1 μm scale bar) for brush border images and 50,000× (500 nm scale bar) for mitochondria and RNA granule images (A). **P < 0.01 and ****P < 0.0001.
Fig. 4.
Fig. 4.
PT-specific deletion of RARα leads to prolonged kidney injury and development of CKD. (A) Representative images of LTL-stained kidney cortices from GCERRARαΔ males and females 2 mo post-tamoxifen and 3 mo post-tamoxifen (n = 3/group), and GCERRARαfl/fl males and females (n = 3/group) age-matched to the GCERRARαΔ 3-mo post-tamoxifen group. (B) Quantification of LTL % area fluorescence of 2-mo groups. (C) Quantification of LTL % area fluorescence of 3-mo groups. (D) Representative images (3 to 5 fields/mouse) of kidney injury molecule-I (KIM-I)-stained kidney cortices from GCERRARαΔ females 3 mo post-tamoxifen and age-matched wild-type females (n = 3/group). (E) Quantification of KIM-I % area fluorescence. (F) Representative images (8 fields/mouse) of PAS-stained female mice described in (D) highlighting PT brush border. (G) Additional representative images of PAS-stained sections from (F) focusing on glomeruli (n = 3/group). (H) Quantification of glomerular area (μm2) (n = 25 glomeruli/group). (I) Representative images (3 fields/mouse) of LTL (GFP) and E-cadherin (TXRED) co-stained kidney cortices from GCERRARαΔ males and females 3 mo post-tamoxifen (n = 3/group) and age-matched GCERRARαfl/fl males and females (n = 3/group). (J) Quantification of E-cadherin % area fluorescence. Magnification 200× (A, D, F, and I) with a 100-μm scale bar or 600× (F and G) with a 50-μm scale bar. Error bars represent SD. ****P < 0.0001.
Fig. 5.
Fig. 5.
Loss of RARα in PTs leads to an increase in TGF-β1 expression and interstitial fibrosis. (A) Representative images (3 fields/mouse) of LTL (GFP) and TGF-β1(TXRED) co-stained kidney cortices from GCERRARαΔ females 3 mo post-tamoxifen and age-matched wild-type females (n = 3/group). (B) Quantification of TGF-β1 % area fluorescence. (C) Representative images (4 to 6 fields/mouse) of p-SMAD3-stained kidney cortices from mice described in (A). (D) Quantification of p-SMAD3+ % area. (E) Representative images (3 to 6 fields/mouse) of Masson’s Trichrome-stained kidney cortices from GCERRARαΔ males and females 3 mo and 4.5 mo post-tamoxifen (n = 4/group) and wild-type males and females (n = 3/group) age-matched to the GCERRARαΔ 4.5 mo post-tamoxifen group. (F) Quantification of % area of collagen (blue). (G) Representative images (7 to 8 fields/mouse) of α-SMA-stained kidney cortices from mice described in (A). (H) Quantification of α-SMA+ % area. (I) Representative images (7 to 8 fields/mouse) of F4/80-stained kidney cortices of mice described in (A). (J) Quantification of F4/80+ % area. Magnification 200× (E) with a 100-μm scale bar or 600× (A, C, G, and I) with a 50-μm scale bar. Error bars represent SD. ***P < 0.001 and ****P < 0.0001.
Fig. 6.
Fig. 6.
Model of the short- and long-term effects of PT-specific RARα KO. Short-term (acute/3 d post-tam) effects of RARα loss in segment 1 (S1) of PTs are mitochondrial distress, autophagy, mitophagy, and apoptosis. Surviving RARα negative PT cells enter a repair cycle during which they de-differentiate and proliferate to replace injured PT cells. However, RARα loss is sufficient to cause prolonged (chronic/>3 mo post-tam) injury without any external stimuli. Injured S1 PT cells secrete TGF-β1, activating residential fibroblasts to myofibroblasts and leading to ECM deposition and interstitial fibrosis.
Fig. 7.
Fig. 7.
RARα deletion in PTs leads to impaired kidney function without impacting glycemic control. (A) Serum Creatinine (mg/dL) of GCERRARαΔ males (n = 4) and females (n = 5) 3 d post-tamoxifen and age-matched wild-type males (n = 3) and females (n = 4). (B) Serum Creatinine (mg/dL) of GCERRARαΔ males (n = 3) and females (n = 5) 3 mo post-tamoxifen and age-matched wild-type males and females (n = 5/group). (C) Serum Creatinine (mg/dL) of GCERRARαΔ males (n = 4) and females (n = 5) 4.5 mo post-tamoxifen and age-matched wild-type males and females (n = 5/group). (D) BUN (mg/dL) of GCERRARαΔ males (n = 4) and females (n = 5) 3 d post-tamoxifen and age-matched wild-type males and females (n = 4/group). (E) BUN (mg/dL) of GCERRARαΔ males (n = 4) and females (n = 5) 3 mo post-tamoxifen and age-matched wild-type males and females (n = 5/group). (F) β2m of serum (μg/mL) from GCERRARαΔ males and females 4.5 mo post-tamoxifen (n = 5/group) and age-matched wild-type males and females (n = 5/group). (G) Urine β2m (pg/L) to creatinine (pg/L) ratio (UβCR) of GCERRARαΔ males (n = 3) and females (n = 4) 4.5 mo post-tamoxifen and age-matched wild-type males (n = 3) and females (n = 6). Error bars represent SD. *P < 0.05 and ***P < 0.001.

Similar articles

Cited by

References

    1. Levey A. S., Becker C., Inker L. A., Glomerular filtration rate and albuminuria for detection and staging of acute and chronic kidney disease in adults: A systematic review. JAMA 313, 837–846 (2015). - PMC - PubMed
    1. Webster A. C., Nagler E. V., Morton R. L., Masson P., Chronic kidney disease. Lancet 389, 1238–1252 (2017). - PubMed
    1. Cavanaugh K. L., Diabetes management issues for patients with chronic kidney disease. Clin. Diabetes 25, 90–97 (2007).
    1. Said S., Hernandez G. T., The link between chronic kidney disease and cardiovascular disease. J. Nephropathol. 3, 99–104 (2014). - PMC - PubMed
    1. Alfego D., et al. , Chronic kidney disease testing among at-risk adults in the U.S. remains low: Real-world evidence from a National Laboratory Database. Diabetes Care 44, 2025–2032 (2021). - PMC - PubMed

LinkOut - more resources