. 2024 Apr 15;84(8):1221-1236.
doi: 10.1158/0008-5472.CAN-24-0086.

Fibroblasts in the Aged Pancreas Drive Pancreatic Cancer Progression

Affiliations

Fibroblasts in the Aged Pancreas Drive Pancreatic Cancer Progression

Daniel J Zabransky et al. Cancer Res. .

Abstract

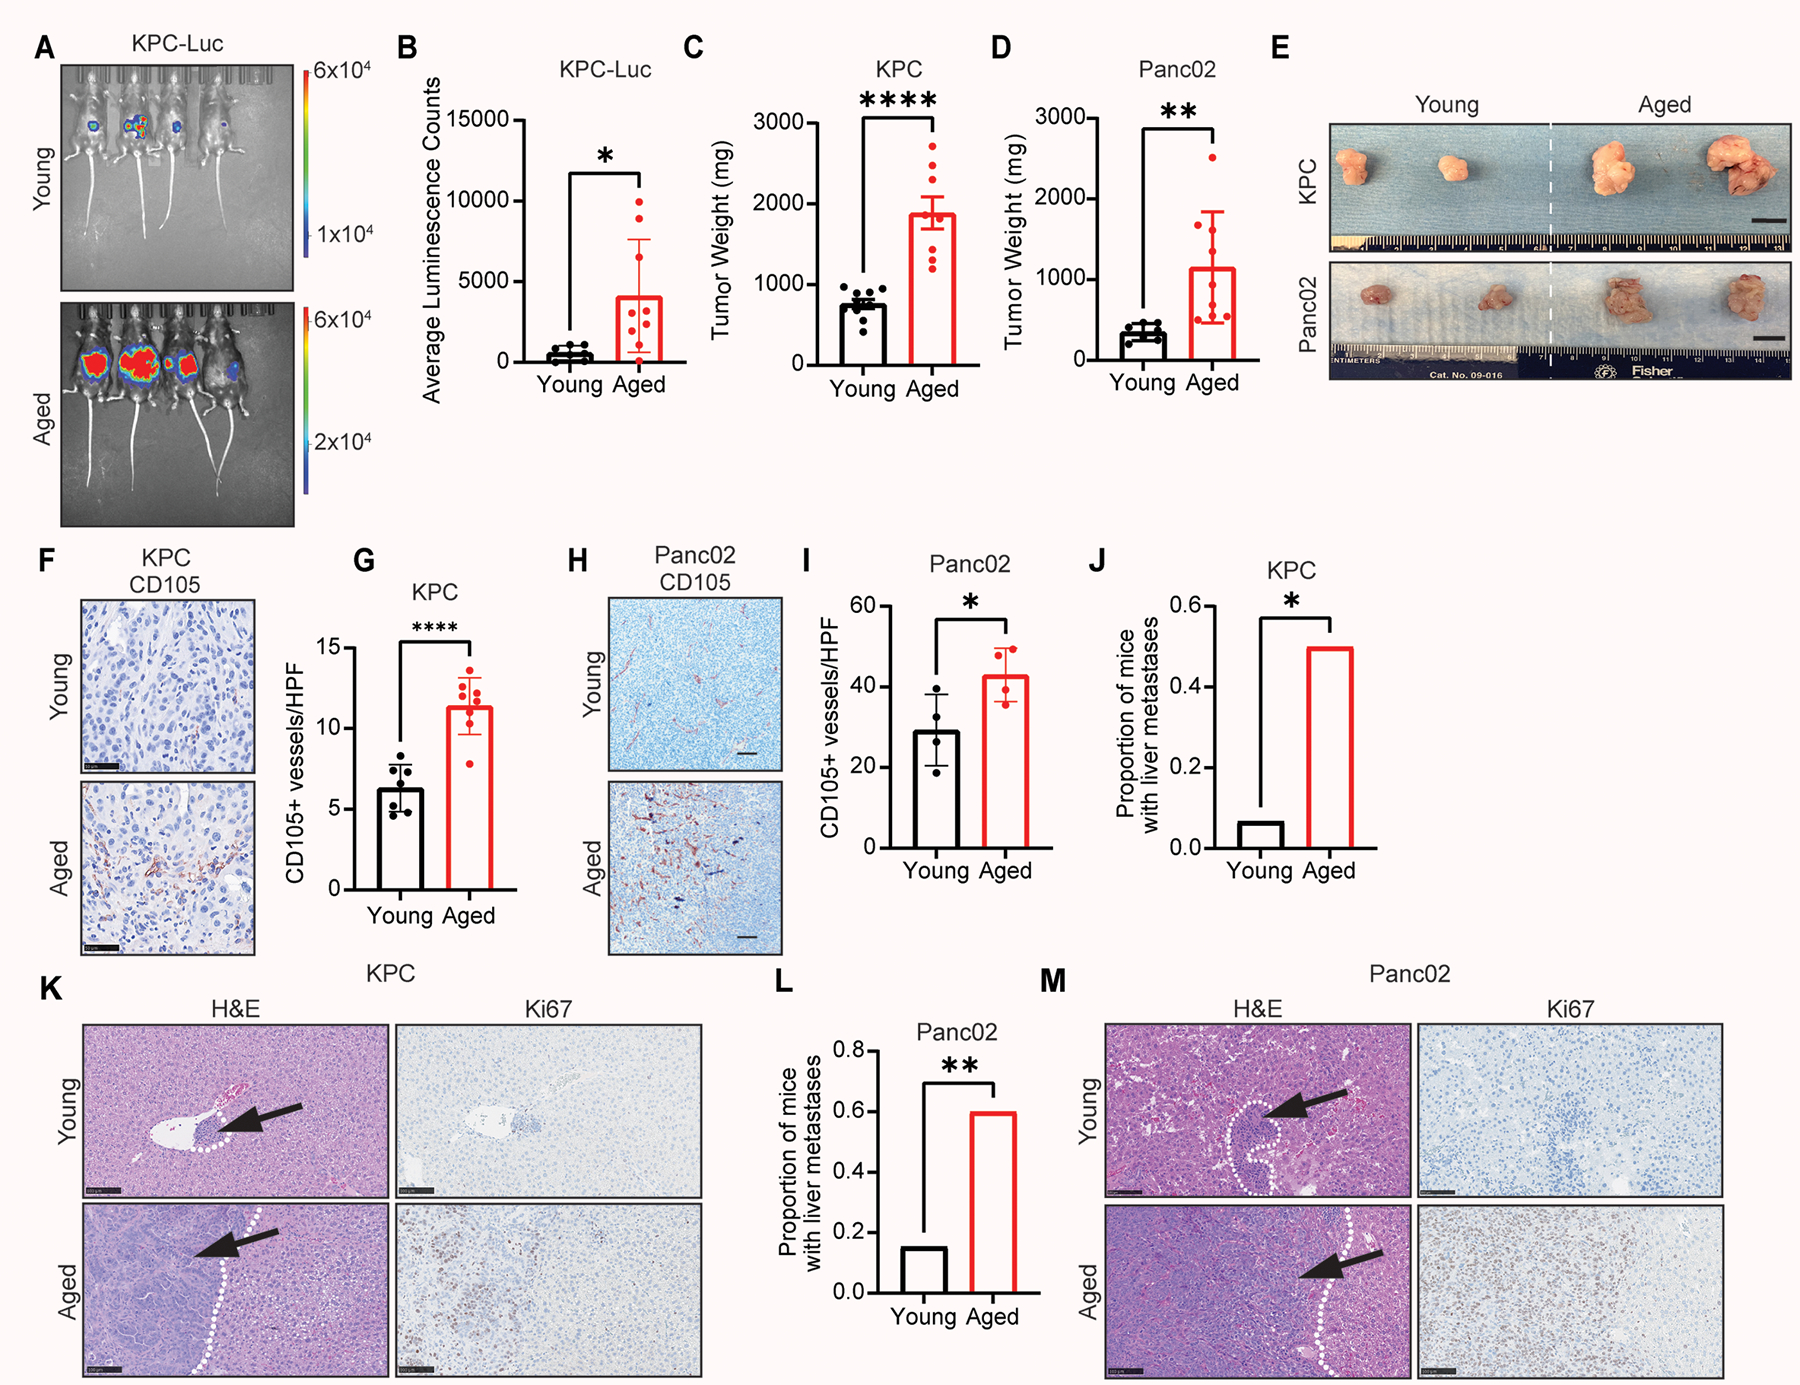
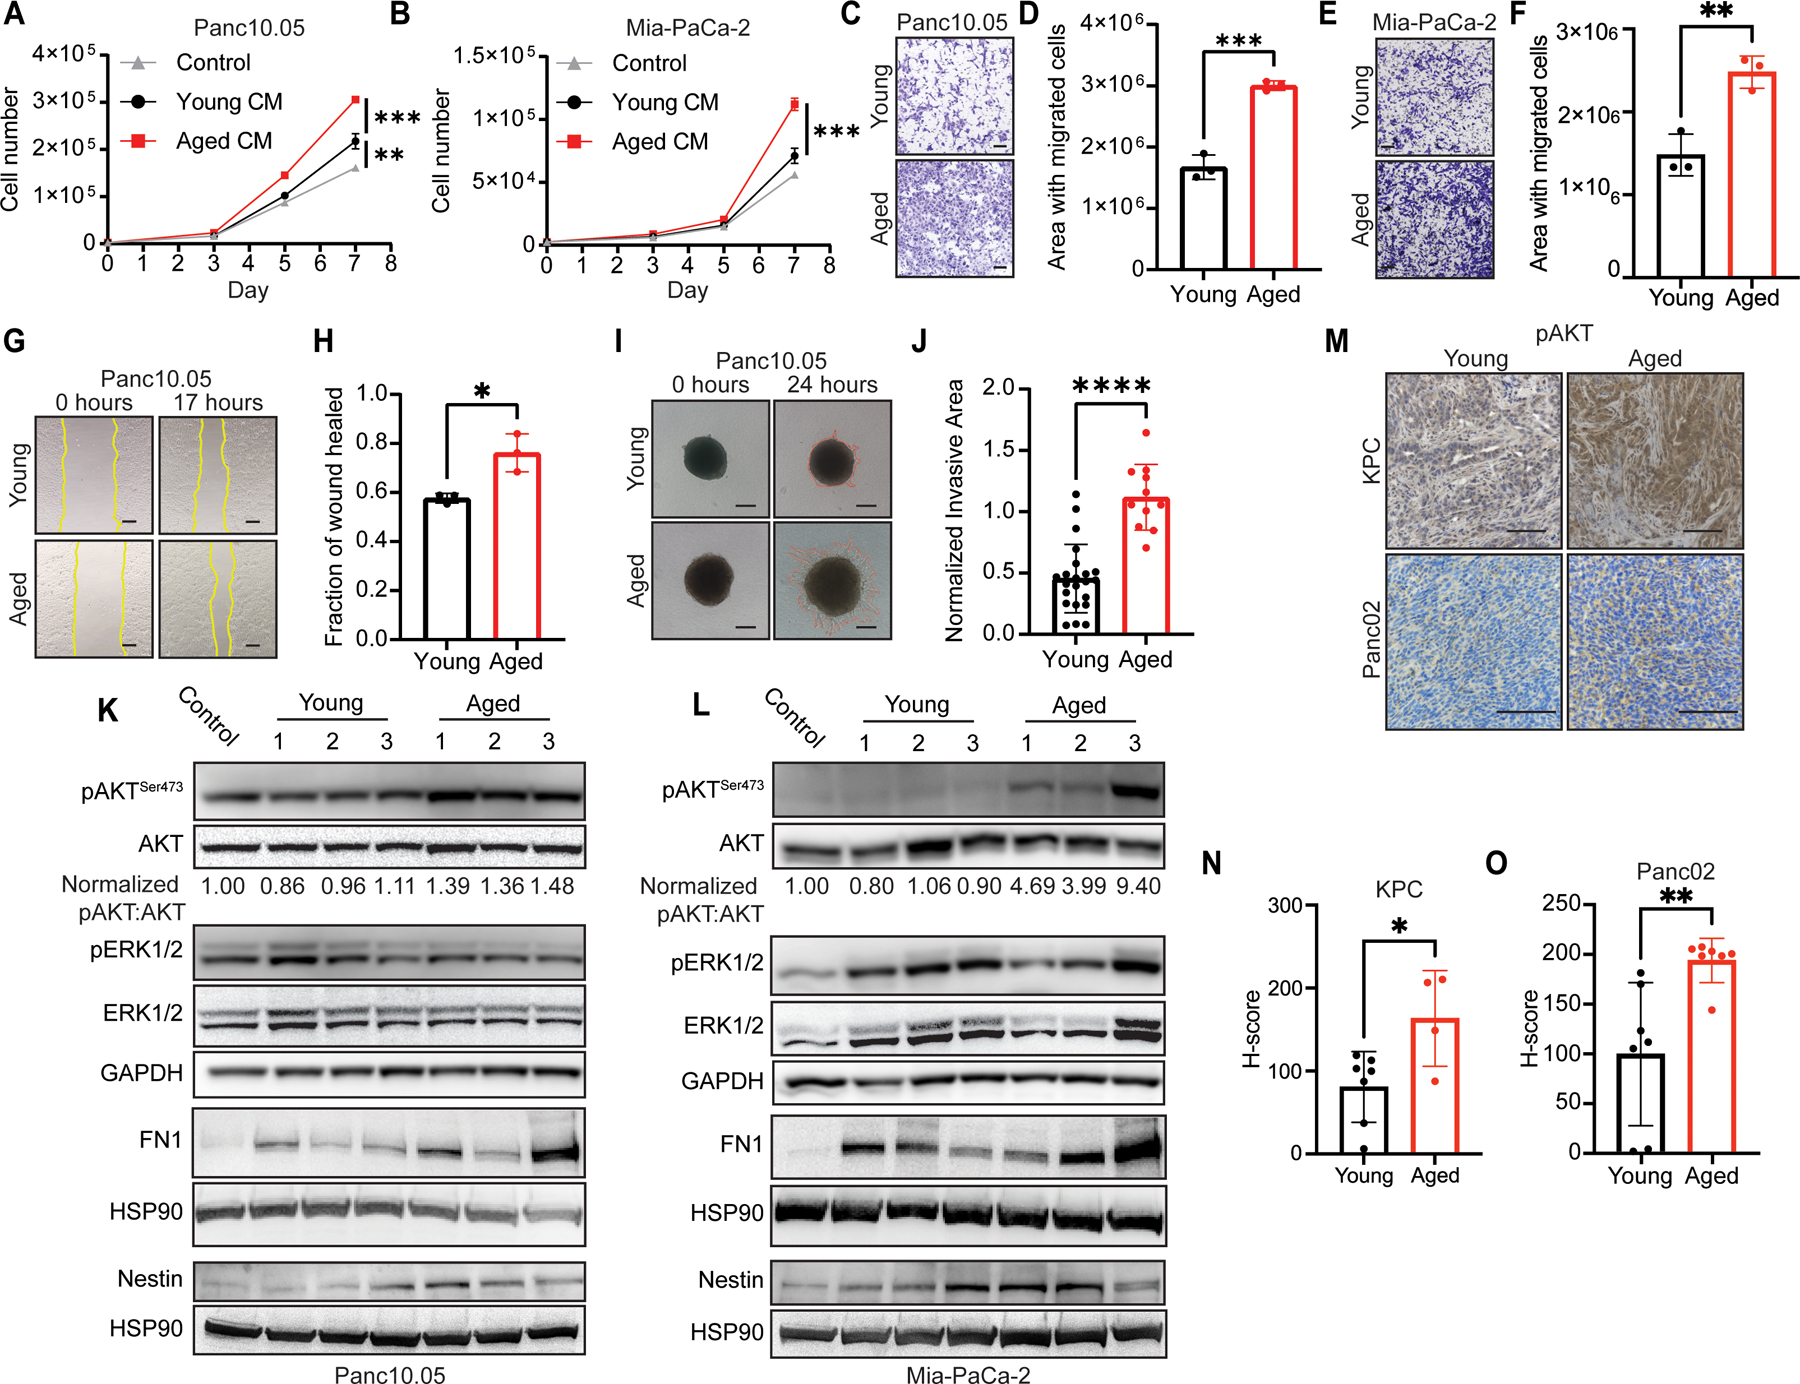
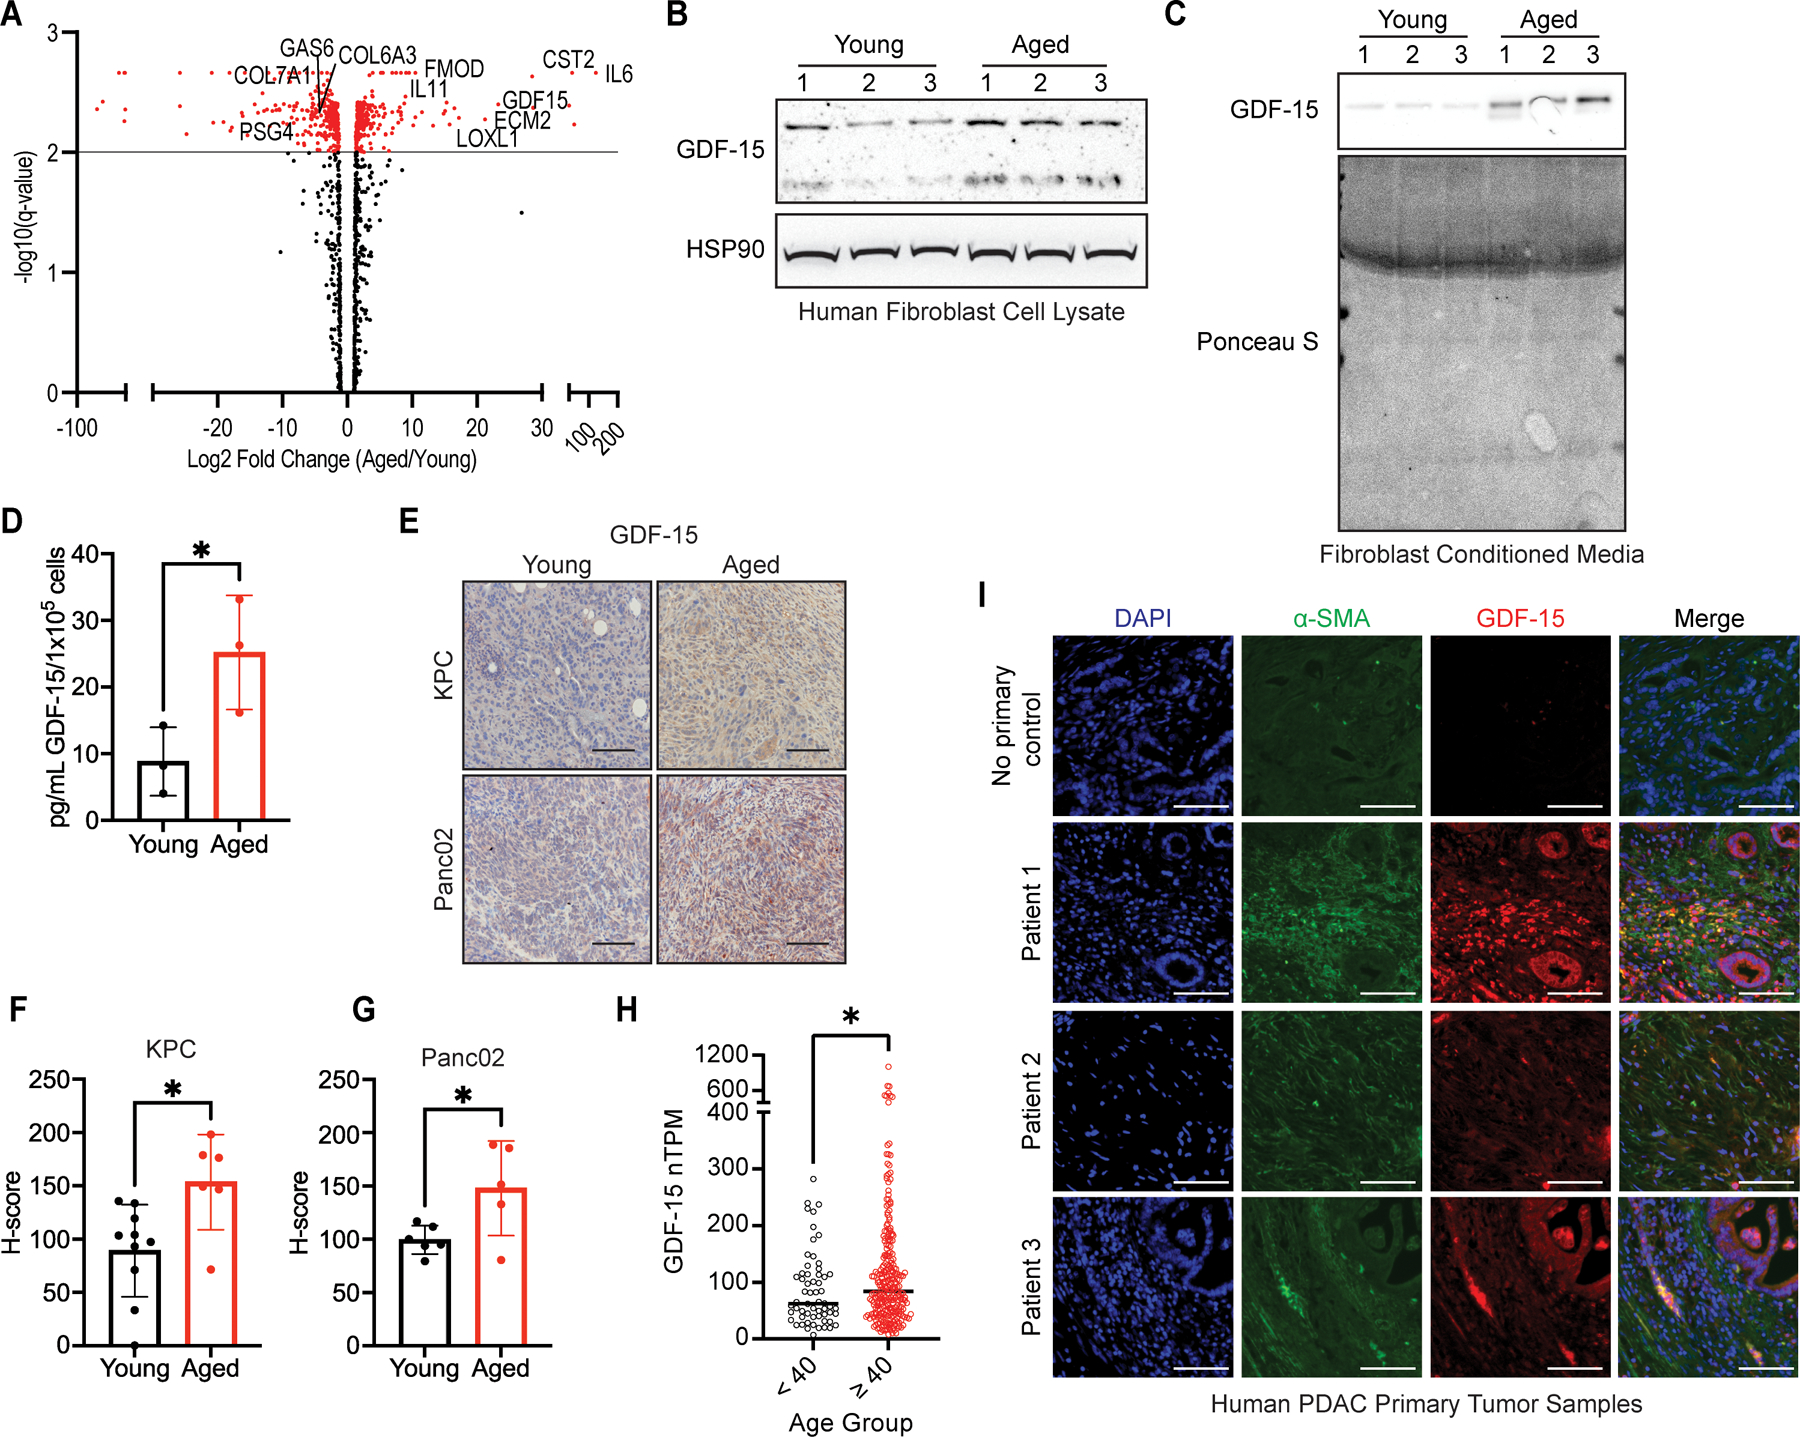
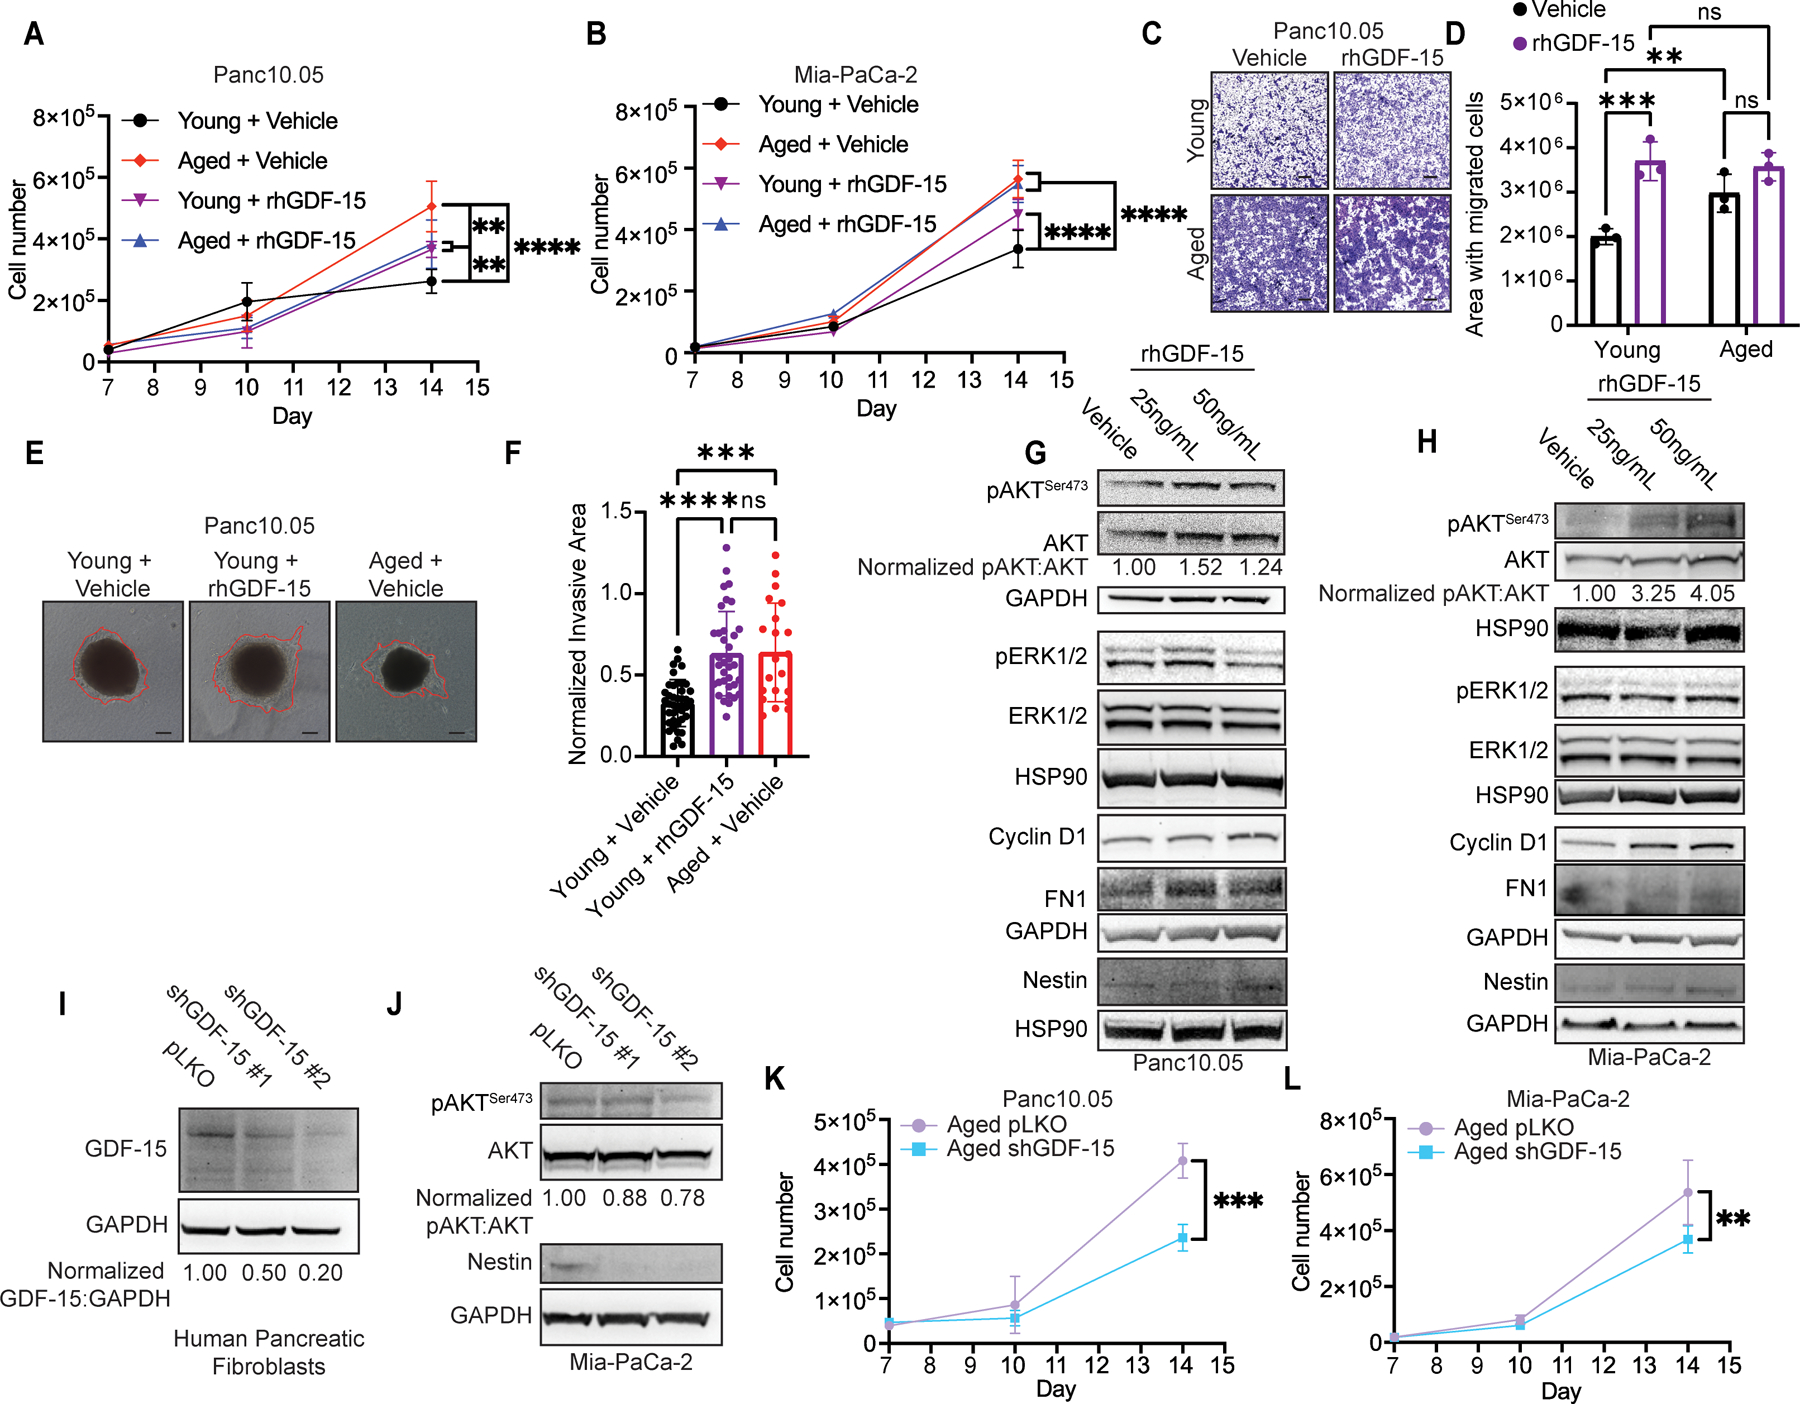
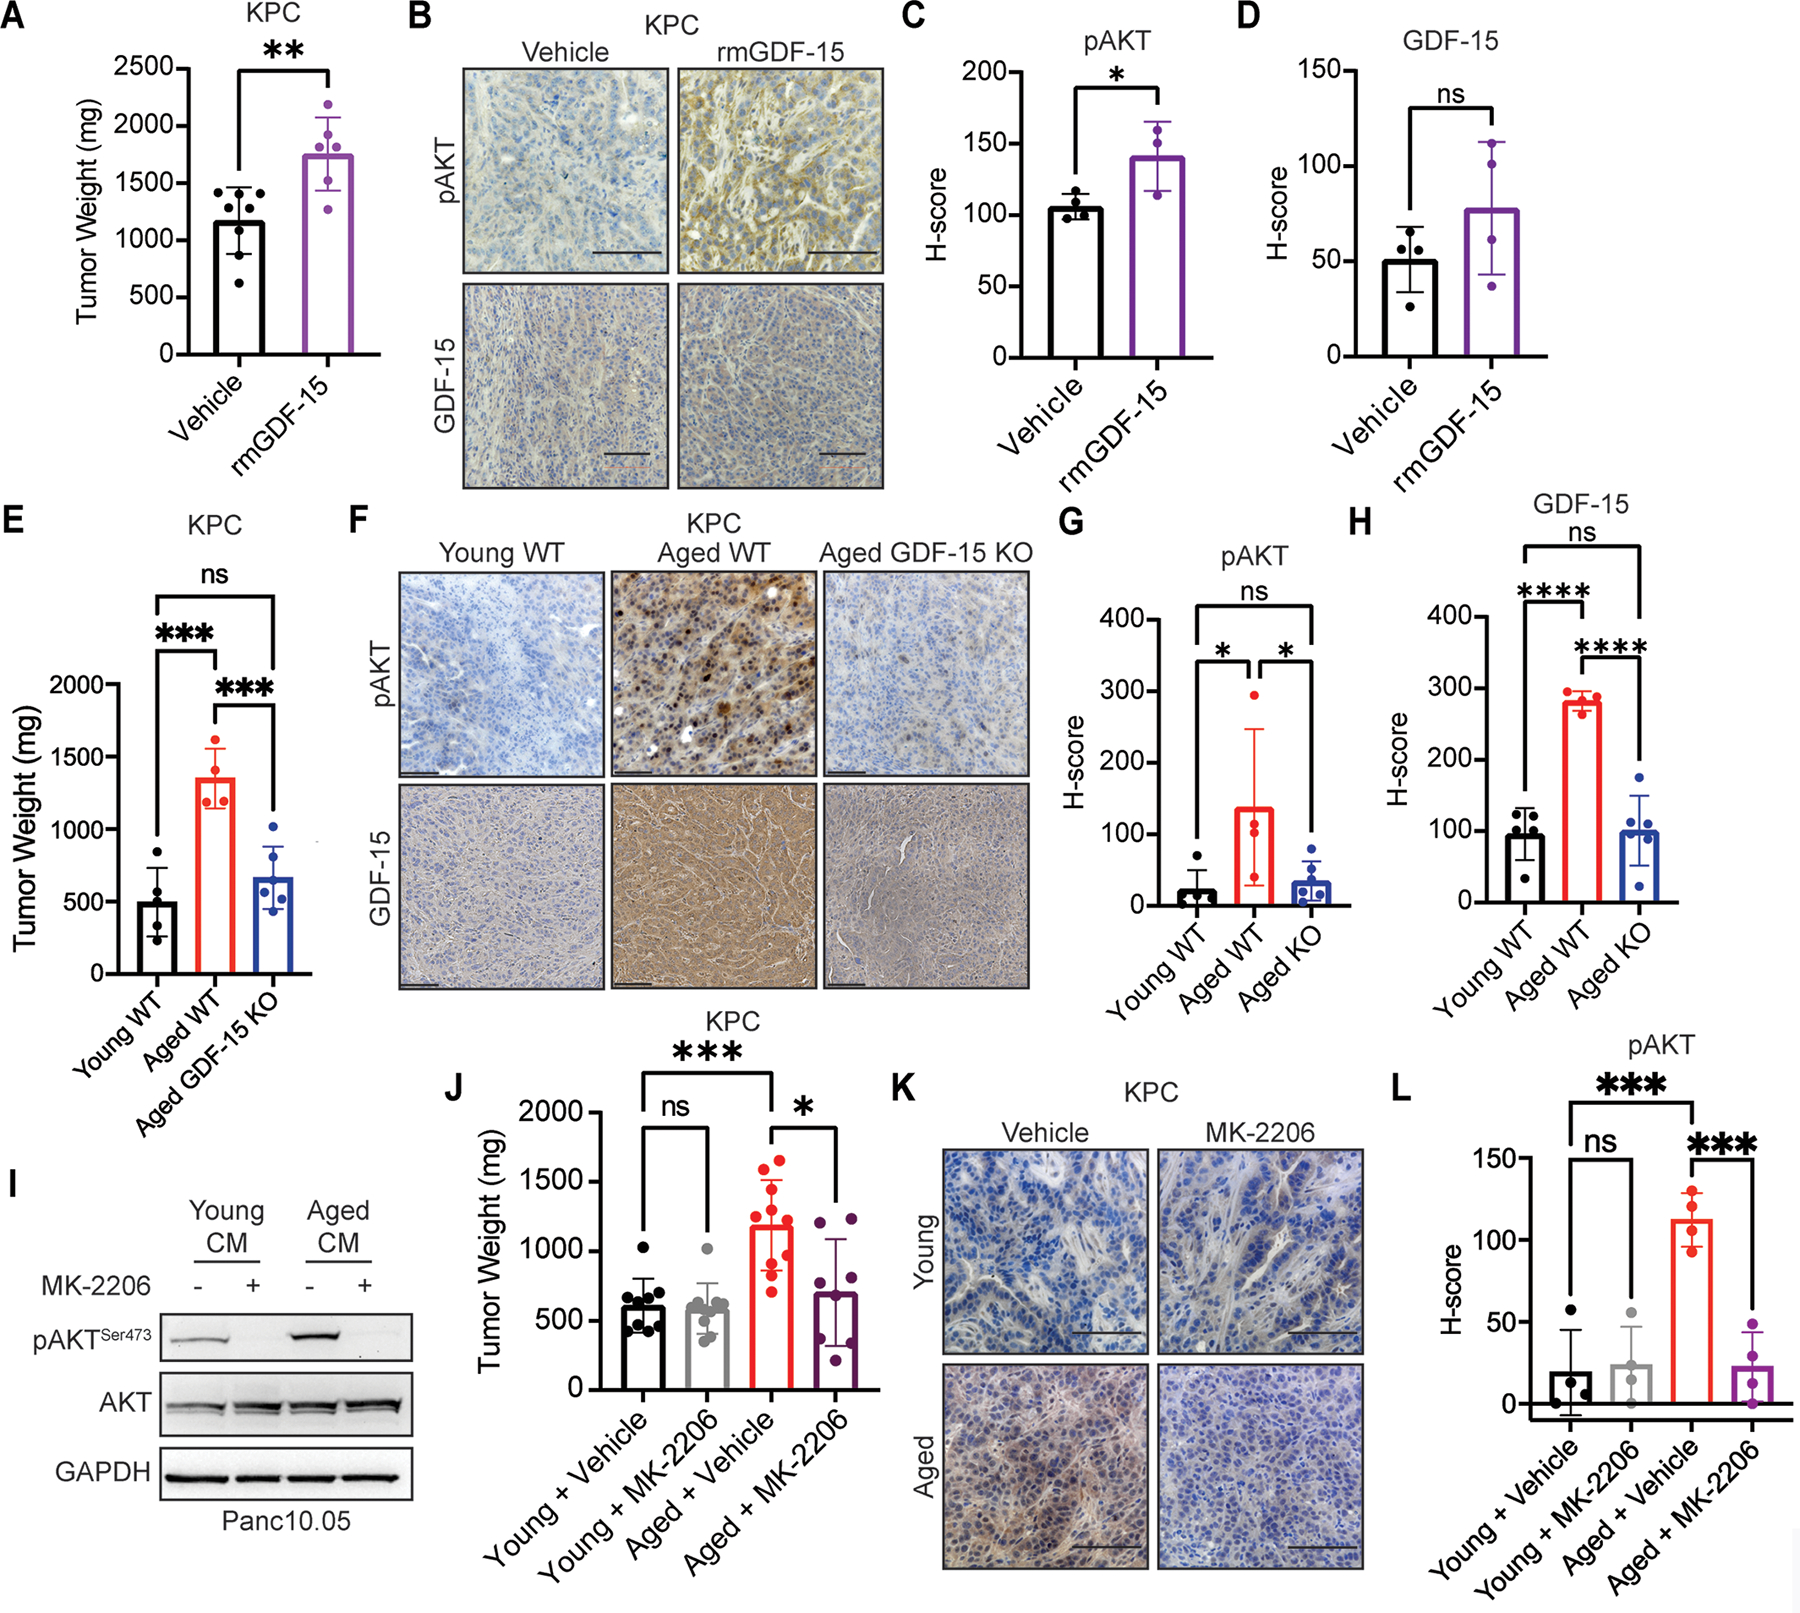
Pancreatic cancer is more prevalent in older individuals and often carries a poorer prognosis for them. The relationship between the microenvironment and pancreatic cancer is multifactorial, and age-related changes in nonmalignant cells in the tumor microenvironment may play a key role in promoting cancer aggressiveness. Because fibroblasts have profound impacts on pancreatic cancer progression, we investigated whether age-related changes in pancreatic fibroblasts influence cancer growth and metastasis. Proteomics analysis revealed that aged fibroblasts secrete different factors than young fibroblasts, including increased growth/differentiation factor 15 (GDF-15). Treating young mice with GDF-15 enhanced tumor growth, whereas aged GDF-15 knockout mice showed reduced tumor growth. GDF-15 activated AKT, rendering tumors sensitive to AKT inhibition in an aged but not young microenvironment. These data provide evidence for how aging alters pancreatic fibroblasts and promotes tumor progression, providing potential therapeutic targets and avenues for studying pancreatic cancer while accounting for the effects of aging.

Significance: Aged pancreatic fibroblasts secrete GDF-15 and activate AKT signaling to promote pancreatic cancer growth, highlighting the critical role of aging-mediated changes in the pancreatic cancer microenvironment in driving tumor progression. See related commentary by Isaacson et al., p. 1185.


Conflict of interest statement

DJZ and JWZ report grant funding paid to Johns Hopkins University from Roche/Genentech. Dr. Jaffee reports other support from Abmeta, other support from Adventris, personal fees from Achilles, personal fees from DragonFly, personal fees from Parker Institute, personal fees from Surge, grants from Lustgarten, grants from Genentech, personal fees from Mestag, personal fees from Medical Home Group, grants from BMS, and grants from Break Through Cancer outside the submitted work. ATW is on the board of ReGain Therapeutics. All other authors declare that they have no affiliations with or involvement in any organization or entity with any financial interest in the subject matter or materials discussed in this manuscript.

Figures

Figure 1.
Figure 1.. The aged pancreas microenvironment promotes growth and metastasis of pancreatic cancer.
(A) In vivo imaging of young (8-week-old, top) and aged (>52-week-old, bottom) mice with orthotopic KPC-Luc tumors at day +18 post-injection. (B) Average luminescence counts in mice from (A) at day +18 post-injection. *, P<0.05, n = 7 young and n = 9 aged mice. (C) Orthotopic KPC tumor weight at day +21 post-injection. ****, P<0.0001, n = 10 young and n = 8 aged mice. (D) Orthotopic Panc02 tumor weight at day +35 post injection. **, P<0.01, n = 7 young and n = 9 aged mice. (E) Representative images of orthotopic KPC tumors at day +21 (top) and orthotopic Panc02 (bottom) tumors at day +35 from young and aged mice. Major ruler graduations are in centimeters, scale bar = 1cm. (F) Representative images of orthotopic KPC tumors from young and aged mice stained with CD105. Scale bar = 50µm. (G) Quantification of CD105+ vessels per 20X high-power field (HPF) from (F), n = 7 young and n = 8 aged tumors, ****, P<0.001. (H) Representative images of orthotopic Panc02 tumors from young and aged mice stained with CD105. Scale bar = 100µm. (I) Quantification of CD105+ vessels per high-power field (HPF) from (H), *, P<0.05, n = 4 tumors per group. (J) Proportion of young and aged mice with orthotopic KPC tumors with identified liver metastases by H&E staining at day +21 post-injection with representative liver metastases (black arrow) shown in (K). *, P<0.05, n = 15 young and n = 14 aged mice. Scale bar = 100µm. (L) Proportion of young and aged mice with orthotopic Panc02 tumors with identified liver metastases by H&E staining at day +35 post-injection with representative liver metastases (black arrow) shown in (M). **, P<0.01, n = 13 young and n = 15 aged mice. Scale bar = 100µm. Values presented as mean ± SD.
Figure 2.
Figure 2.. Aged pancreatic fibroblasts increase proliferation, migratory capacity, and invasiveness of pancreatic cancer cells.
(A) Cell counts for Panc10.05 cells grown in non-conditioned, young human pancreatic fibroblast conditioned, or aged human pancreatic fibroblast conditioned media. ***, P<0.001, **, P<0.01, n = 3 biological replicates performed in duplicate for each timepoint per fibroblast line in each conditioned media group and 6 technical replicates per timepoint for the control media group. (B) Cell counts for Mia-PaCa-2 cells grown in non-conditioned control, young fibroblast conditioned, or aged fibroblast conditioned media. ***, P<0.001, n = 3 biological replicates with two technical replicates per timepoint per fibroblast line in each conditioned media group and 6 technical replicates per timepoint for the control media group. (C) Representative brightfield images of transwell migration of Panc10.05 cells grown in the presence of young or aged fibroblast conditioned media. Scale bar = 200µm. (D) Quantification of area containing migrated cells/HPF (right) from (C). ***, P<0.001, n = 3 biological replicates with two technical replicates per fibroblast conditioned media group. (E) Representative brightfield images of transwell migration of Mia-PaCa-2 cells grown in the presence of young or aged fibroblast conditioned media. Scale bar = 200µm. (F) Quantification of area containing migrated cells/HPF in (E). **, P<0. 01, n = 3 biological replicates with two technical replicates per fibroblast conditioned media group. (G) Representative brightfield images from a scratch wound healing assay for Panc10.05 cells in the presence of young or aged fibroblast conditioned media with wound edge outlined in yellow. Scale bar = 200µm. (H) Quantification of percentage of time 0 wound healed at 17 hours from (G). *, P<0.05, n = 3 biological replicates with three technical replicates per fibroblast conditioned media group. (I) Representative brightfield images of Panc10.05 and pancreatic fibroblast co-culture spheroid invasion with invasive area outlined in red. Scale bar = 200µm. (J) Quantification of normalized invasive area at 24 hours represented as percent invasion relative the size of the central spheroid from time 0 from (I), ****, P<0.0001, n = 22 young and n = 11 aged fibroblast co-culture with Panc10.05 spheroids. (K) Immunoblot analysis of cellular lysates from Panc10.05 cells cultured in the presence of control growth media, 3 young, or 3 aged fibroblast conditioned media. HSP90 was used as a loading control. (L) Immunoblot analysis of cellular lysates from Mia-PaCa-2 cells cultured in the presence of control growth media, 3 young, or 3 aged fibroblast conditioned medias. HSP90 was used as a loading control. (M) Representative images of orthotopic KPC and Panc02 primary tumors from young and aged mice stained for pAKT (Ser473). Scale bar = 100µm. (N) Quantification of pAKT IHC staining in orthotopic KPC tumors, *, P<0.05, n = 7 young and n = 4 aged tumors. (O) Quantification of pAKT IHC staining in orthotopic Panc02 tumors, **, P<0.01, n = 7 tumors per age group. Values presented as mean ± SD.
Figure 3.
Figure 3.. Aged pancreatic fibroblasts secrete unique factors including GDF-15 in the aged pancreas microenvironment.
(A) Proteomics analysis on conditioned media from human pancreatic fibroblasts from three young and three aged fibroblasts lines in performed in technical triplicate. A false discovery rate of less than 5% was considered significant. (B) Immunoblot for GDF-15 in human pancreatic fibroblast lysates stratified by age. HSP90 was used as a loading control. (C) Immunoblot for GDF-15 in fibroblast conditioned media stratified by age. Ponceau S staining was used as a loading control. (D) ELISA for GDF-15 on conditioned media from age stratified human pancreatic fibroblasts, *, P<0.05, n = 3 biological replicates per age group. (E) Representative images of orthotopic KPC and Panc02 primary tumors from young and aged mice stained for GDF-15, n = 3–5 per group. Scale bar = 100µm. (F) Quantification of GDF-15 IHC staining in KPC tumors, *, P<0.05, n= 9 young and n = 6 aged tumors (G) Quantification of GDF-15 IHC staining in Panc02 tumors, *, P<0.05, n = 6 young and n = 5 aged tumors. (H) Whole pancreas GDF-15 RNA expression GDF-15 from the Human Protein Atlas stratified by age, *, P<0.05, n = 60 <40 years old, n = 268 ≥40 years old. (I) Representative images of immunofluorescence staining for α-SMA and GDF-15 in primary human PDAC tumor samples. Scale bar = 100µm. Values presented as mean ± SD.
Figure 4.
Figure 4.. GDF-15 mediates age-related increases in PDAC proliferation, migration, and invasion.
(A) Cell counts for Panc10.05 cells grown in young or aged fibroblast conditioned media + vehicle control or young fibroblast conditioned media with 25ng/mL rhGDF-15. ****, P<0.0001, **, P<0.01, young and aged vehicle CM groups n = 3 biological replicates and each rhGDF-15 supplemented group contains at least 3 technical replicates per time point. (B) Cell counts for Mia-PaCa-2 cells grown in young or aged fibroblast conditioned media + vehicle control or young fibroblast conditioned media with 25ng/mL rhGDF-15. ****, P<0.0001, young and aged vehicle CM groups n = 3 biological replicates and each rhGDF-15 supplement group contains at least 3 technical replicates per time point. (C) Representative brightfield images of transwell migration of Panc10.05 cells grown in the presence of young or aged fibroblast conditioned media with either rhGDF-15 or vehicle control. Scale bar = 200µm. (D) Quantification of area containing migrated cells/HPF in (C). ***, P<0.001, **, P<0.01, ns, non-significant, n = 3 biological replicates per group. (E) Representative brightfield images of Panc10.05 and young or aged human pancreatic fibroblast co-culture spheroids supplemented with media containing vehicle control or rhGDF-15. Invasive area outlined in red, scale bar = 200µm. (F) Quantification of normalized invasive area at 24 hours represented as percent invasion relative the size of the central spheroid from time 0 from (F), ****, P<0.0001, ***, P<0.001, n = 29 young + vehicle control, n = 35 young + rhGDF-15 and n = 21 aged + vehicle control fibroblast co-culture spheroids. (G) Immunoblot of Panc10.05 cell lysates from cells treated with vehicle or the indicated dose of rhGDF-15 for 48 hours. HSP90 was used as a loading control. (H) Immunoblot of Mia-PaCa-2 cell lysates from cells treated with vehicle or the indicated dose of rhGDF-15 for 48 hours. HSP90 was used as a loading control. (I) Immunoblot analysis for GDF-15 performed on cell lysates from aged fibroblasts transduced with a lentiviral shGDF-15 or control construct. GAPDH was used as a loading control. (J) Immunoblot analysis of cell lysates from Mia-PaCa-2 cells cultured in the presence of conditioned media from shGDF-15 or control transduced aged fibroblasts. GAPDH was used as a loading control. (K) Cell counts for Panc10.05 cells cultured with shGDF-15 aged fibroblasts or control vector transduced aged fibroblast conditioned media. ***, P<0.001, n = 3 technical replicates per time point per group. (L) Cell counts for Mia-PaCa-2 cells cultured with shGDF-15 aged fibroblasts or control vector transduced aged fibroblast conditioned media. **, P<0.01, n = 3 technical replicates per time point per group. Values presented as mean ± SD.
Figure 5.
Figure 5.. GDF-15 drives pancreatic cancer growth in vivo through age-dependent activation of AKT signaling.
(A) Weights of primary KPC orthotopic tumors at day +21 post-injection in mice treated with rmGDF-15 or vehicle control. **, P<0.01, n = 8 vehicle and n = 6 rmGDF-15 treated mice. (B) Representative images of tumors from mice in (B) stained for pAKT (Ser473), GDF-15, or Ki67, n ≥ 3 tumors, scale bar = 100µm. (C) Quantification of pAKT IHC staining from tumors in (B), *, P<0.05, n = 4 vehicle and 3 rmGDF-15 tumors. (D) Quantification of GDF-15 IHC staining from tumors in (B), ns, non-significant, n = 4 tumors per group. (E) Weights of primary KPC orthotopic tumors at day +21 post-injection from young wild type (WT), aged WT, or aged GDF-15 knock out (KO) mice. ***, P<0.001, ns, non-significant, n = 5 young WT, n = 4 aged WT, and n = 6 aged GDF-15 KO mice tumors. (F) Representative images of tumors from mice in (B) stained for pAKT or GDF-15. Scale bar = 100µm. (G) Quantification of pAKT IHC staining from tumors in (D), *, P<0.05, ns = non-significant, n = 5 young WT, n = 4 aged WT, and n = 6 aged GDF-15 KO mice tumors. (H) Quantification of GDF-15 IHC staining from tumors in (D), ****, P<0.0001, ns = non-significant, n = 5 young WT, n = 4 aged WT, and n = 6 aged GDF-15 KO mice tumors. (I) Immunoblot analysis of Panc10.05 cellular lysates cultured in the presence of either young or aged fibroblast conditioned media for 48 hours and either MK-2206 or vehicle control for 24 hours prior to lysis. GAPDH was used as a loading control. (J) Weights of primary KPC orthotopic tumors at day +21 post-injection in mice treated MK-2206 or vehicle control. *, P<0.05, ***, P<0.001, ns, non-significant, n = 8–10 mice per group. (K) Representative images of tumors from mice in (J) were stained for pAKT, n = 4 tumors per group, scale bar = 100µm. (L) Quantification of pAKT IHC staining from tumors in (K), n = 4 tumors per group, ns, non-significant, ***, P<0.001. Values presented as mean ± SD.

Comment in

Similar articles

Cited by

References

    1. Capasso M, Franceschi M, Rodriguez-Castro KI, Crafa P, Cambiè G, Miraglia C, et al. Epidemiology and risk factors of pancreatic cancer. Acta Biomed 2018;89:141–6. - PMC - PubMed
    1. Ntala C, Debernardi S, Feakins RM, Crnogorac-Jurcevic T. Demographic, clinical, and pathological features of early onset pancreatic cancer patients. BMC Gastroenterol 2018;18:139. - PMC - PubMed
    1. He J, Edil BH, Cameron JL, Schulick RD, Hruban RH, Herman JM, et al. Young patients undergoing resection of pancreatic cancer fare better than their older counterparts. J Gastrointest Surg 2013;17:339–44. - PMC - PubMed
    1. Tas F, Sen F, Keskin S, Kilic L, Yildiz I. Prognostic factors in metastatic pancreatic cancer: Older patients are associated with reduced overall survival. Mol Clin Oncol 2013;1:788–92. - PMC - PubMed
    1. Fane M, Weeraratna AT. How the ageing microenvironment influences tumour progression. Nature Reviews Canc 2020;20:89–106. - PMC - PubMed

Publication types

MeSH terms

Substances