. 2024 Feb 1;30(1):14-52.
doi: 10.1212/CON.0000000000001390.

Clinical Approach to Myelopathy Diagnosis

Clinical Approach to Myelopathy Diagnosis

Carlos A Pardo. Continuum (Minneap Minn). .

Abstract

Objective: This article describes an integrative strategy to evaluate patients with suspected myelopathy, provides advice on diagnostic approach, and outlines the framework for the etiologic diagnosis of myelopathies.

Latest developments: Advances in diagnostic neuroimaging techniques of the spinal cord and improved understanding of the immune pathogenic mechanisms associated with spinal cord disorders have expanded the knowledge of inflammatory and noninflammatory myelopathies. The discovery of biomarkers of disease, such as anti-aquaporin 4 and anti-myelin oligodendrocyte glycoprotein antibodies involved in myelitis and other immune-related mechanisms, the emergence and identification of infectious disorders that target the spinal cord, and better recognition of myelopathies associated with vascular pathologies have expanded our knowledge about the broad clinical spectrum of myelopathies.

Essential points: Myelopathies include a group of inflammatory and noninflammatory disorders of the spinal cord that exhibit a wide variety of motor, sensory, gait, and sensory disturbances and produce major neurologic disability. Both inflammatory and noninflammatory myelopathies comprise a broad spectrum of pathophysiologic mechanisms and etiologic factors that lead to specific clinical features and presentations. Knowledge of the clinical variety of myelopathies and understanding of strategies for the precise diagnosis, identification of etiologic factors, and implementation of therapies can help improve outcomes.


Figures

FIGURE 1-1
FIGURE 1-1. The diagnostic spectrum of myelopathies comprises a broad group of clinical conditions associated with diverse pathogenic mechanisms categorized as inflammatory and noninflammatory.
AFM = acute flaccid myelitis; AVM = arteriovenous malformation; dAVF = dural arteriovenous fistula; MOG = myelin oligodendrocyte glycoprotein; NMO = neuromyelitis optica.
FIGURE 1-2
FIGURE 1-2. Overview of the spectrum of myelopathies initially diagnosed as transverse myelitis, indicating the final etiologic diagnosis based on a single-center cohort of 1193 patients.
AVF = arteriovenous fistula; AVM = arteriovenous malformation; CIS = clinically isolated syndrome; MS = multiple sclerosis; NMOSD = neuromyelitis optica spectrum disorder. Reprinted from Murphy OC et al, J Neurol Sci. © 2022 The Authors. Published by Elsevier B.V.
FIGURE 1-3
FIGURE 1-3. The strategic approach for establishing a precise etiologic diagnosis of myelopathies includes a comprehensive clinical history and neurologic examination combined with laboratory analysis of blood and CSF and neuroimaging techniques.
ACL = anticardiolipin; ANA = antinuclear antibodies; ANCA = antineutrophil cytoplasmic autoantibody; AQP4 = aquaporin 4; CNS = central nervous system; FDG-PET = fludeoxyglucose positron emission tomography; HIV = human immunodeficiency virus; HSV = herpes simplex virus; HTLV-I = human T-cell lymphotropic virus type 1; IgG = immunoglobulin G; IgM = immunoglobulin M; MOG = myelin oligodendrocyte glycoprotein; PCR = polymerase chain reaction; PMH = past medical history; SSA/SSB = anti-Ro/Sjögren syndrome A and anti-La/Sjögren syndrome B; TB = tuberculosis; VZV = varicella-zoster virus; WNV = West Nile virus.
FIGURE 1-4
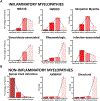
FIGURE 1-4. Distribution of temporal profile of symptom evolution in patients with inflammatory and noninflammatory myelopathies. Histograms are presented demonstrating the temporal profile of symptom evolution of the different types of inflammatory myelopathies (A) and noninflammatory myelopathies (B).
AVF = arteriovenous fistula; AVM = arteriovenous malformation; CIS = clinically isolated syndrome; MS = multiple sclerosis; NMOSD = neuromyelitis optica spectrum disorder. Reprinted from Murphy OC et al, J Neurol Sci. © 2022 The Authors. Published by Elsevier B.V.
FIGURE 1-6
FIGURE 1-6
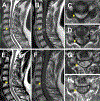
Spine CT and MRI from a patient with epidural lipomatosis. A, Sagittal spine CT shows extraaxial epidural low attenuation (arrowheads) in the thoracic and lumbosacral regions. B, Axial spine CT at the T8 level shows the posterior perispinal low-attenuation abnormality (fat tissue) surrounding the cord (the spine goblet sign [arrowhead]). C, Axial spine CT at the sacral region S1 level shows the low-attenuation abnormality (fat tissue) surrounding the neural elements of the cauda equina (the Y sign [arrowhead]). D, Sagittal fluid-attenuation inversion recovery (FLAIR) MRI of the thoracic spine shows the posterior extraaxial hyperintensity, representing the accumulation of adipose tissue compressing the thoracic spinal cord (arrowheads). E, F, Axial T2-weighted images of the thoracic spinal cord (levels of the blue lines in panel D) show the mass effect produced on the spinal cord by the accumulation of fat tissue (arrowheads).
FIGURE 1-7
FIGURE 1-7
Presurgical and postsurgical spine MRI of a patient with compressive spondylotic myelopathy. A-D, Presurgical sagittal T2-weighted (A) image shows the focal area of extrinsic compression produced by the disk protrusion (arrowhead) at C5 to C6. The arrowhead in panel A indicates the focal site of hyperintense signal abnormality and cord edema below the point of compression in the narrowed canal. The corresponding sagittal gadolinium-contrasted T1-weighted image (B) shows a transverse line of enhancement (pancake sign, arrowhead) that matches the focal area of cord compression. Matched axial T2-weighted (C) and contrasted T1-weighted (D) images at the level of cord compression (arrowheads) corresponding to the arrowheads in panels A and B. E-H, Postsurgical sagittal T2-weighted (E) and corresponding sagittal gadolinium-contrasted T1-weighted (F) images show a residual focal area of signal abnormality (E, arrowhead) at C5 to C6 and the pancake sign (F, arrowhead) 12 months after an anterior cervical discectomy and fusion surgery. Matched axial T2-weighted (G) and contrasted T1-weighted (H) images at the level of presurgical cord compression (arrowheads) corresponding to the arrowheads in panels E and F. The axial images show residual asymmetric T2 hyperintensities (G) and residual contrast enhancement in the left aspect of the white matter (H) at the site of presurgical compression corresponding to the arrowheads in panels A, B, E, and F).
FIGURE 1-8
FIGURE 1-8
MRI examples in the different myelopathy diagnostic categories. A, Cervical spine MRI from a patient with idiopathic inflammatory myelopathy reveals a short-segment lesion in T2-weighted (T2W) images and T1-weighted gadolinium-enhanced (T1W + Gad) images in the posterolateral region of the cervical cord. B, Cervical spine MRI from a patient with spinal cord infarction shows a longitudinally extensive, anterior lesion in T2W images in both sagittal and axial views, which appears unenhanced in T1W + Gad images. C, Thoracic MRI in a patient with a dural arteriovenous fistula seen as a longitudinally extensive myelopathy and diffuse intraaxial enhancement in the central cord; there are enlarged vessels in the dorsal surface of the cord (arrow). D, Cervical spine MRI in a patient with spondylotic myelopathy shows posterior disk protrusion with mass effect on the spinal cord and intraaxial signal abnormality in T2W images and focal enhancement in T1W + Gad images in the central cervical cord. Reprinted with permission from Barreras P et al, Neurology. © 2018 American Academy of Neurology.
FIGURE 1-9
FIGURE 1-9
Serial spinal cord MRI in a patient with spinal cord infarction. A, Sagittal T2-weighted images of the thoracolumbar cord region at 3 days after symptom onset show longitudinally extensive hyperintense signal abnormalities, which are localized in the anterior horn–gray matter region of the cord (arrowhead) as demonstrated in the axial image (shown in panel F). B, Sagittal T2-weighted images at 5 days after symptom onset show progression of intraaxial hyperintensities and newly developed hypointense lesions (arrowhead) reflecting likely hemorrhagic conversion (shown in the axial image in panel G). C, Sagittal gadolinium-contrasted T1-weighted images at day 5 show subtle evidence of intraaxial enhancement (arrowhead) (shown in the axial image in panel H) and perispinal congestion. D, Sagittal T2-weighted images obtained 12 weeks after the onset of symptoms show residual focal areas of hyperintense and hypointense signal abnormalities (arrowhead). E, Sagittal gadolinium-contrasted T1-weighted spinal images show persistent intraaxial focal areas of contrast enhancement as well as enhancement of the anterior and posterior nerve roots as shown in panel J (arrowheads). I, Axial image at the arrowhead level in panel D showing ventral and dorsal nerve roots (arrowheads) and corresponding to the same structures (arrowheads) visualized in gadolinium-contrasted T1-weighted images shown in panel J. The orange lines in panels A and C represent the intervertebral space T6 to T7 (upper orange line) and vertebral body L1 (lower orange line). The green lines in panels A, B, and C indicate the cord level at the T10 vertebral body which, are represented in panels F, G, and H.
FIGURE 1-5
FIGURE 1-5
Spinal cord MRI from the patient in CASE 1–1. A, Sagittal T2-weighted images of the thoracolumbar cord region show an intraaxial hyperintense signal abnormality that extends longitudinally to involve most of the thoracic and upper lumbar cord segments B, Sagittal gadolinium-contrasted T1-weighted image shows a subtle marginal cord enhancement (white arrowhead) that extends downward. C, D, Matched T2-weighted and contrasted T1-weighted axial images show the central cord T2 hyperintensity (C) and corresponding marginal and perilesional contrast enhancement likely reflecting venous congestion (D). The yellow arrows with a line in panels A and B indicate levels of the axial images represented in panels C and D.

References

    1. Lennon VA, Kryzer TJ, Pittock SJ, Verkman AS, Hinson SR. IgG marker of optic-spinal multiple sclerosis binds to the aquaporin-4 water channel. J Exp Med 2005;202(4):473–477. doi:10.1084/jem.20050304 - DOI - PMC - PubMed
    1. O’Connor KC, McLaughlin KA, De Jager PL. Self-antigen tetramers discriminate between myelin autoantibodies to native or denatured protein. Nat Med 2007;13(2):211–217. doi:10.1038/nm1488 - DOI - PMC - PubMed
    1. Gailloud P Spinal vascular malformations: Angiographic evaluation and endovascular management. Handb Clin Neurol 2021;176: 267–304. doi:10.1016/B978-0-444-64034-5.00013-4 - DOI - PubMed
    1. Gailloud P Introduction to diagnostic and therapeutic spinal angiography. Neuroimaging Clin N Am 2019;29(4):595–614. doi:10.1016/j.nic.2019.07.008 - DOI - PubMed
    1. Murphy OC, Messacar K, Benson L, et al. Acute flaccid myelitis: cause, diagnosis, and management. Lancet Lond Engl 2021;397(10271):334–346. doi:10.1016/S0140-6736(20)32723-9 - DOI - PMC - PubMed