. 2024 Apr:70:103072.
doi: 10.1016/j.redox.2024.103072. Epub 2024 Feb 2.

Macrophage Tim-3 maintains intestinal homeostasis in DSS-induced colitis by suppressing neutrophil necroptosis

Affiliations

Macrophage Tim-3 maintains intestinal homeostasis in DSS-induced colitis by suppressing neutrophil necroptosis

Fangfei Wang et al. Redox Biol. 2024 Apr.

Abstract

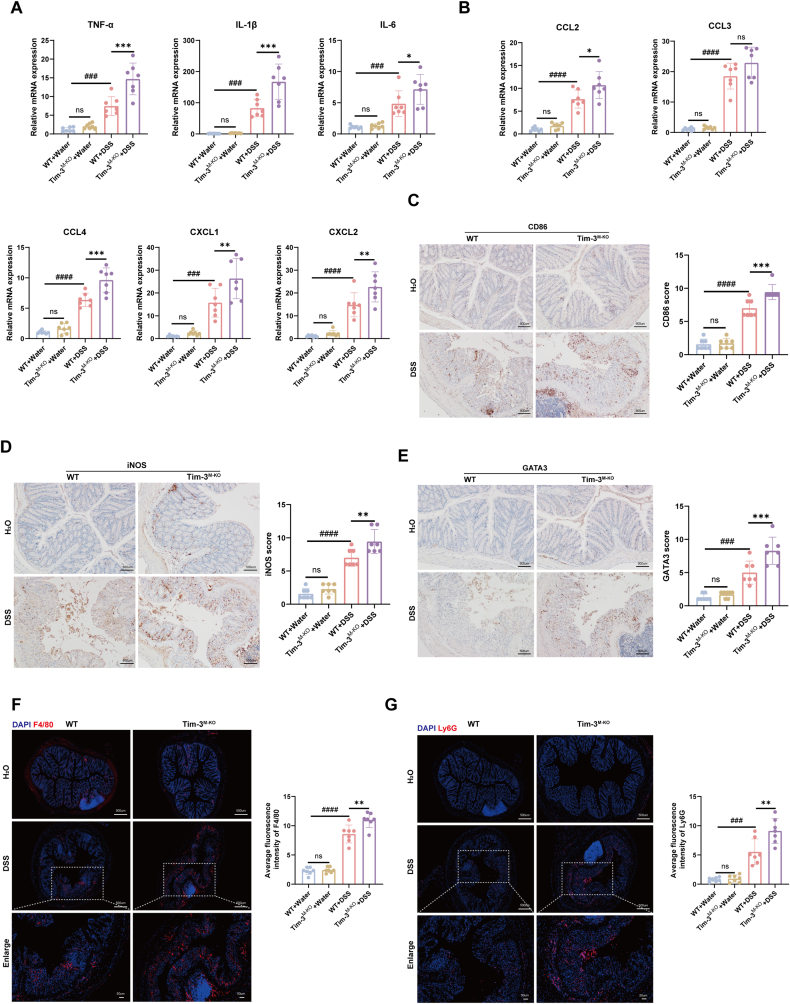
T-cell immunoglobulin domain and mucin domain-3 (Tim-3) is a versatile immunomodulator that protects against intestinal inflammation. Necroptosis is a type of cell death that regulates intestinal homeostasis and inflammation. The mechanism(s) underlying the protective role of macrophage Tim-3 in intestinal inflammation is unclear; thus, we investigated whether specific Tim-3 knockdown in macrophages drives intestinal inflammation via necroptosis. Tim-3 protein and mRNA expression were assessed via double immunofluorescence staining and single-cell RNA sequencing (sc-RNA seq), respectively, in the colonic tissues of patients with inflammatory bowel disease (IBD) and healthy controls. Macrophage-specific Tim3-knockout (Tim-3M-KO) mice were generated to explore the function and mechanism of Tim-3 in dextran sodium sulfate (DSS)-induced colitis. Necroptosis was blocked by pharmacological inhibitors of receptor-interacting protein kinase (RIP)1, RIP3, and reactive oxygen species (ROS). Additionally, in vitro experiments were performed to assess the mechanisms of neutrophil necroptosis induced by Tim-3 knockdown macrophages. Although Tim-3 is relatively inactive in macrophages during colon homeostasis, it is highly active during colitis. Compared to those in controls, Tim-3M-KO mice showed increased susceptibility to colitis, higher colitis scores, and increased pro-inflammatory mediator expression. Following the administration of RIP1/RIP3 or ROS inhibitors, a significant reduction in intestinal inflammation symptoms was observed in DSS-treated Tim-3M-KO mice. Further analysis indicated the TLR4/NF-κB pathway in Tim-3 knockdown macrophages mediates the TNF-α-induced necroptosis pathway in neutrophils. Macrophage Tim-3 regulates neutrophil necroptosis via intracellular ROS signaling. Tim-3 knockdown macrophages can recruit neutrophils and induce neutrophil necroptosis, thereby damaging the intestinal mucosal barrier and triggering a vicious cycle in the development of colitis. Our results demonstrate a protective role of macrophage Tim-3 in maintaining gut homeostasis by inhibiting neutrophil necroptosis and provide novel insights into the pathogenesis of IBD.

Keywords: Inflammatory bowel disease; Macrophage; Necroptosis; Neutrophil; ROS; Tim-3.


Conflict of interest statement

Declaration of competing interest The authors declare that they have no known competing financial interests or personal relationships that could have appeared to influence the work reported in this paper.

Figures

Image 1
Graphical abstract
Fig. 1
Fig. 1
Tim-3 expression level is elevated in the colonic macrophages of IBD tissues. (A) Dual immunofluorescence staining for CD68 (red) and Tim-3 (green) in human colon biopsy tissues. The upper panel shows healthy tissues (n = 12), the middle panel shows active Crohn's disease (ACD) (n = 12) and CD in remission (RCD) tissues (n = 12), and the lower panel shows active ulcerative colitis (AUC) (n = 12) and UC in remission (RUC) tissues (n = 12). DAPI (blue)-stained nuclei. Scale bars: 20 μm. Quantitative analysis of CD68 colocalization with Tim-3 was carried out using the colocalization plugin of Image J. (B) UMAP findings illustrate the expression as well as distribution of Tim-3 in relation to single-cell clusters, accompanied by a box plot showcasing the levels of Tim-3 in colonocytes among patients with CD, UC, and healthy controls. n = 6 per group. (C) Quantification of Tim-3 expression in inflammatory bowel disease (IBD) patient datasets (GSE126124). The samples included healthy individuals (n = 39), and patients with CD (n = 39) and UC (n = 18), correspondingly. (D) Dual-immunofluorescence staining of F4/80 (red) and Tim-3 (green) in murine colon tissues. DAPI (blue)-stained nuclei. n = 6 for each group. Scale bars: 50 μm. Data are presented as the mean ± SD. *P < 0.05, ***P < 0.001, ****P < 0.0001, in comparison to control group.
Fig. 2
Fig. 2
Tim-3 in macrophages protects mice from acute colitis. (A) Summary of the experimental protocol for experimental colitis in wild-type (WT) and macrophage-specific Tim-3 deletion (Tim-3M−KO) mice. (B) WT and Tim-3M−KO mice's relative survival rate. n = 7 for each group. The survival curve was generated utilizing the Kaplan-Meier approach and compared using the log-rank test. (C–F) WT and Tim-3M−KO mice were fed with 3 % DSS for 7 days. n = 7 mice per group. (C) The mouse disease activity index (DAI) was documented daily. (D) The colony length and (E) spleen weight of each mouse was evaluated. Representative pictures were taken on day 8. (F) An H&E staining representative diagram of the entire colonic intestine and colon cross-sections. Histological analysis of the colon tissue. Scale bars: 1000 μm. (G) Immunofluorescence staining confirming successful knockdown of Tim-3 in macrophages. n = 6 mice per group. Scale bars: 50 μm. Data are presented as mean ± SD except those in Fig. 2C, which were presented as mean ± SEM. *P < 0.05, **P < 0.01, ****P < 0.0001 versus WT colitis mice; ####P < 0.0001 versus WT control mice; ns, no significance.
Fig. 3
Fig. 3
Macrophage Tim-3 deficiency aggravates inflammation and M1 polarization in the colon. (A, B) qRT-PCR examination of proinflammatory molecule expression in mouse colonic tissue isolated from WT and Tim-3M−KO mice with or without DSS treatment. n = 7 mice per group. (C–E) Immunohistochemical staining of M1 macrophage markers (CD86 and iNOS) and Th2 cell marker (GATA3) in colonic tissues. n = 7 mice per group. Scale bars: 500 μm. (F–G) Immunofluorescence staining of F4/80 and Ly6G in colon tissues (n = 7). Scale bars: 500 μm. Data are presented as the mean ± SD. *P < 0.05, **P < 0.01, ***P < 0.001 versus WT colitis mice; ###P < 0.001, ####P < 0.0001 versus WT control mice; ns, no significance.
Fig. 4
Fig. 4
Macrophage Tim-3 deficiency promotes necroptosis. (A) TUNEL staining representative images (green, TUNEL-positive staining; blue, DAPI). n = 7 mice per group. Scale bars: 50 μm. (B) Gene Set Enrichment Analysis (GSEA) of colonic differentially expressed genes (DEGs) between DSS-treated WT and Tim-3M−KO mice using RNA-seq analysis (n = 3). GSEA suggested significant enrichment of the cellular response to tumor necrosis factor pathway (n = 3). (C) Immunohistochemical staining of p-RIP1, p-RIP3, and p-MLKL in colonic tissues. Quantification of the relative number of positive cells is shown in the graph below (n = 7). Scale bars: 500 μm. (D) Immunofluorescence staining of p-MLKL in the colonic tissues (n = 7). Scale bars: 50 μm. (E) Western blot analysis of p-RIP1, p-RIP3, and p-MLKL protein levels, and quantitative analyses were performed using ImageJ (n = 5 for each group). Data are presented as the mean ± SD. *P < 0.05, **P < 0.01, ***P < 0.001, ****P < 0.0001 versus WT colitis mice; #P < 0.05, ####P < 0.0001 versus WT control mice; ns, no significance.
Fig. 5
Fig. 5
Pharmacological inhibition of RIP1 or RIP3 alleviates colitis in macrophage Tim-3 deficient mice. (A) An illustration of the study design. Mice were intraperitoneally treated with either the vehicle control, Nec-1 (5 mg/kg/day), or GSK-872 (10 mg/kg/day) throughout the entire experimental period. n = 7 mice per group. (B) H&E staining representative diagram of colon cross-sections. Histological analysis of the colon tissue. Scale bars: 1000 μm. n = 7 mice per group. (C) Immunofluorescence staining of Ly6G in colon tissues (n = 7). Scale bars: 500 μm. (D) Immunohistochemical staining of p-RIP1, p-RIP3, and p-MLKL in colonic tissues from DSS-treated mice with or without Nec-1 or GSK-872 administration on day 7. The quantification of the relative number of positive cells is shown in the graph below (n = 7). Scale bars: 500 μm. Data are presented as the mean ± SD. *P < 0.05, **P < 0.01, ***P < 0.001, ****P < 0.0001 versus WT colitis mice; ns, no significance versus WT colitis mice treated with pharmacological inhibitors.
Fig. 6
Fig. 6
Tim-3 deficient macrophages increase neutrophil necroptosis. (A) Dual-label immunofluorescence of colonic tissues of WT and Tim-3M−KO mice using F4/80 (red) and p-MLKL (green) antibodies (n = 7). Scale bars: 50 μm. (B) Dual-label immunofluorescence for Ly6G (red) and p-MLKL (green) (n = 7). Scale bars: 50 μm. (C) Dual-label immunofluorescence for CD3 (red) and p-MLKL (green) (n = 7). Scale bars: 50 μm. (D) qRT-PCR analysis of IL8, CXCR1, and CXCR2 expression in the colons of WT and Tim-3M−KO mice. n = 7 mice per group. (E) Immunohistochemical staining of MPO in colon tissues of WT and Tim-3M−KO mice. n = 7 mice per group. Scale bars: 500 μm. (F) GSEA analysis suggested substantial enrichment of the neutrophil chemotaxis pathway (n = 3). Data are presented as the mean ± SD. **P < 0.01, ***P < 0.001, ****P < 0.0001, versus WT colitis mice; ns, no significance; ##P < 0.01, ###P < 0.001, ####P < 0.0001, versus WT control mice.
Fig. 7
Fig. 7
Tim-3 deficient macrophages induce neutrophil chemotaxis and trigger necroptosis. (A) Schematic of in vitro co-culture experiments. (B) qRT-PCR analysis of CD11B mRNA in DMSO-treated HL-60 cells (n = 3). (C) Neutrophil migration with crystal violet induced by control (Scr) and Tim-3 knockdown (ShTim-3) THP-1 cells (n = 6 for each group). Scale bars: 500 μm. (D) Phalloidin staining of the actin cytoskeleton in HL-60 cells. HL-60 cells were co-cultured directly with Scr or ShTim-3 THP-1 cells. The bar charts show the average fluorescence intensity of phalloidin (n = 3 for each group). Scale bars: 20 μm. (E) Phalloidin staining of the actin cytoskeleton in peripheral blood of murine neutrophils. Peripheral blood neutrophils were collected from WT and Tim-3M−KO mice on day 8 following DSS administration. The bar charts show the average fluorescence intensity of phalloidin (n = 6 for each group). Scale bars: 20 μm. (F) Study design. THP-1 cells were incubated with LPS. The supernatant of Scr or ShTim-3 THP-1 cells was harvested and added to HL-60 cells. The HL-60 cells underwent pretreatment with the RIP1 inhibitor (30 μM Nec-1) or RIP3 inhibitor (50 μM GSK-872) for 30 min (n = 3). (G) TEM images showing the typical morphology of necroptosis in HL-60 cells treated with the supernatant from Tim-3 knockdown macrophages. Scale bar, 2 μm (overview) and 1 μm (magnification). (H) qRT-PCR results of CXCR1 and CXCR2 in HL-60 cells. (I) Representative images of the immunofluorescence assay results for anti-p-MLKL (green) and DAPI (blue) staining, and quantitative analyses were performed using ImageJ (n = 3). Data are presented as the mean ± SD. *P < 0.05, ***P < 0.001, ****P < 0.0001; ##P < 0.01, ###P < 0.001, ####P < 0.0001; ns, no significance.
Fig. 8
Fig. 8
Tim-3 deficient macrophages induce neutrophil chemotaxis via the release of IL-8 and trigger neutrophil necroptosis by TNF-α release. (A) Control (Scr) and Tim-3 knockdown (ShTim-3) THP-1 cells were incubated for 6 h in medium alone or medium containing LPS (400 ng/ml); then the supernatants were tested for TNF-α and IL-8 (n = 3). (B) Representative images of p-MLKL+ immunofluorescent staining for HL-60 cells. THP-1 cells were incubated with LPS. The supernatant of Scr or ShTim-3 THP-1 cells underwent pretreatment with isotype control or anti-TNF-α antibody and added to HL-60 cells (n = 3). Scale bars: 20 μm. (C) qRT-PCR results of CXCR1 and CXCR2 in HL-60 cells. THP-1 cells were incubated with LPS. The supernatant of Scr or ShTim-3 THP-1 cells underwent pretreatment with isotype control or anti-IL-8 antibody and added to HL-60 cells (n = 3). (D) TNF-α-induced necroptosis upregulation is in a TNF-α dose-dependent manner. Necroptosis was stimulated with different doses of TNF-α as indicated. Protein was collected at 4 h after TNF-α stimulation (n = 3). (E) Representative images of p-MLKL+ immunofluorescent staining for HL-60 cells. The HL-60 cells underwent pretreatment with the RIP1 inhibitor (30 μM Nec-1) or RIP3 inhibitor (50 μM GSK-872) for 30 min. Then, HL-60 cells were incubated with TNF-α (50 ng/ml) or PBS (n = 3). Scale bars: 20 μm. (F) Dual-label immunofluorescence of colonic tissues of WT and Tim-3M−KO mice using F4/80 (red) and TNF-α (green) antibodies (n = 7). Scale bars: 50 μm. (G) Dual-label immunofluorescence for Ly6G (red) and IL-8 (green) (n = 7). Scale bars: 50 μm. Data are presented as the mean ± SD. *P < 0.05, **P < 0.01, ***P < 0.001, ****P < 0.0001; ###P < 0.001, ####P < 0.0001; ns, no significance.
Fig. 9
Fig. 9
Macrophage Tim-3 inhibits inflammatory responses via downregulating TLR4/NF-κB signaling pathway (A-C) Control (Scr) and Tim-3 knockdown (ShTim-3) THP-1 cells were incubated in medium alone or medium containing LPS (400 ng/ml); then cells were collected at 6 h (n = 3). (A) Western blot analysis of p–NF–κB, TLR4, and β-actin from Scr or ShTim-3 THP-1 cells. (B, C) Representative immunofluorescence images stained for p–NF–κB and TLR4 (n = 3). Scale bars: 50 μm. (D–H) Scr and ShTim-3 THP-1 cells were incubated with LPS for 6 h. The THP-1 cells underwent pretreatment with the NF-κB inhibitor (50 μM BAY11-7082) or TLR4 inhibitor (50 μM TAK-242) for 30 min. The supernatant of THP-1 cells was harvested and added to HL-60 cells (n = 3). (D) The supernatants of THP-1 cells were tested for TNF-α and IL-8. (E) Phalloidin staining of the actin cytoskeleton in HL-60 cells (n = 3 for each group). Scale bars: 20 μm. (F) Representative immunofluorescence images stained for p-MLKL in HL-60 cells (n = 3 for each group). Scale bars: 20 μm. (G) Representative images of Scr and ShTim-3 THP-1 cells transwell migration (n = 3). Scale bars: 500 μm. (H) qRT-PCR results of CCL2, CCL3, CCL4, CXCL1 and CXCL2 in Scr and ShTim-3 THP-1 cells (n = 3 for each group). Data are presented as the mean ± SD. *P < 0.05, **P < 0.01; #P < 0.05, ##P < 0.01, ###P < 0.001, ####P < 0.0001; ns, no significance.
Fig. 10
Fig. 10
ROS plays a critical role in macrophage Tim-3 deficiency-mediated necroptosis. (A) DHE staining to evaluate ROS levels in colonic tissues of WT and Tim-3M−KO mice (n = 6 for each group). Scale bars: 500 μm. (B–D) Representative pictures of ROS levels in the HL-60 cells (B) and THP-1 cells (C, D). Intracellular ROS levels were examined using DHE staining (n = 3). Scale bars: 1000 μm. (E) Study design of the experiment. Mice were intraperitoneally treated with either the vehicle control or N-Acetyl-Cysteine (NAC) (100 mg/kg/day) throughout the entire experimental period. n = 7 mice per group. (F) Representative diagram for the H&E staining of colon cross-sections. Histological analysis of the colon tissue. Scale bars: 1000 μm. n = 7 mice per group. (G) Representative images of mouse colons. n = 7 mice per group. (H) DAI of mice was documented daily. n = 7 mice per group. (I) Immunohistochemical staining of p-RIP1, p-RIP3, and p-MLKL in colonic tissues from DSS-treated mice with or without NAC administration. The quantification of the relative number of positive cells is shown in the graph below (n = 7). Scale bars: 500 μm. (J) Representative image of the immunofluorescence assay result for anti-p-MLKL (green) and DAPI (blue) staining, and quantitative analyses were performed using ImageJ (n = 3). Data are presented as mean ± SD except for those in Fig. 10H, which are presented as mean ± SEM. *P < 0.05, **P < 0.01; ##P < 0.01, ###P < 0.001, ####P < 0.0001; ns, no significance.
Fig. 11
Fig. 11
Macrophage Tim-3 maintains the intestinal epithelial barrier by inhibiting neutrophil necroptosis (A, B) Immunofluorescence staining of ZO-1 in mouse colonic tissue isolated from WT and Tim-3M−KO mice with or without DSS treatment. n = 7 mice per group. (C) Study design. The experiments were divided into two groups: THP-1 + HL-60 + Caco2 cells and THP-1 + Caco2 cells. Scr or ShTim-3 THP-1 cells were incubated with LPS. The upper panel shows that the supernatants of THP-1 cells were harvested and added to HL-60 cells; then, the supernatants of the co-culture medium (THP-1 + HL-60 cells) added to Caco2 cells (THP-1 + HL-60 + Caco2 cells). The lower panel shows the supernatants of THP-1 cells were harvested and added to Caco-2 cells (THP-1 + Caco2 cells). The supernatant of Scr or ShTim-3 THP-1 cells underwent pretreatment with isotype control or anti-TNF-α antibody and added to HL-60 cells. The HL-60 cells underwent pretreatment with the RIP1 inhibitor (30 μM Nec-1) or RIP3 inhibitor (50 μM GSK-872) for 30 min. (D–F) Representative immunofluorescence images stained for ZO-1 in Caco2 cells (n = 3 for each group). Scale bars: 20 μm. (G–I) qRT-PCR results of ZO-1 in Caco2 cells (n = 3 for each group). (J, K) The supernatants of THP-1 cells or the co-culture medium (THP-1 cells + HL-60 cells) were tested for HMGB1. Data are presented as the mean ± SD. **P < 0.01, ***P < 0.001; ##P < 0.01, ###P < 0.001, ####P < 0.0001; ns, no significance.
Fig. S1
Fig. S1
Tim-3 expression level is elevated in the colonic macrophages of IBD tissues. (A) UMAP visualizations of clusters of single cells from the colonic mucosa of patients with CD or UC and healthy individuals were generated using a database for single-cell sequencing (GSE214695). (B) Percentages of Tim-3+ cells within each cluster were calculated. n = 6 per group.
Fig. S2
Fig. S2
Pharmacological inhibition of RIP1 or RIP3 alleviates colitis in macrophage Tim-3 deficient mice. (A) DAI of mice was documented daily. n = 7 mice per group. (B) Representative images of mouse colons. Colon length of each mouse was evaluated. Representative pictures were taken on day 8. n = 7 mice per group. (C) qRT-PCR examination of proinflammatory molecule expression in mouse colonic tissue isolated from WT and Tim-3M−KO mice treated with or without Nec-1 or GSK-872. n = 7 mice per group. Data are presented as mean ± SD except for those in Fig. S2A, which are presented as mean ± SEM. *P < 0.05, **P < 0.01, versus WT colitis mice; ns, no significance versus WT colitis mice treated with pharmacological inhibition.
Fig. S3
Fig. S3
ROS plays a critical role in macrophage Tim-3 deficiency-mediated necroptosis. (A) Immunohistochemical staining of COX2 expression in the colonic tissues of WT and Tim-3M−KO mice. n = 7 mice per group. Scale bars: 500 μm. (B) Representative pictures of ROS levels in the HL-60 cells (n = 3). Scale bars: 500 μm. (C) Representative image of the immunofluorescence assay result for anti-p-MLKL (green) and DAPI (blue) staining (n = 3). Data were presented as the mean ± SD. *P < 0.05, **P < 0.01, ****P < 0.0001; ##P < 0.01, ####P < 0.0001; ns, no significance.

References

    1. Hodson R. Inflammatory bowel disease. Nature. 2016;540(7634):S97. doi: 10.1038/540S97a. - DOI - PubMed
    1. Khor B., Gardet A., Xavier R.J. Genetics and pathogenesis of inflammatory bowel disease. Nature. 2011;474(7351):307–317. doi: 10.1038/nature10209. - DOI - PMC - PubMed
    1. Abraham C., Cho J.H. Inflammatory bowel disease. N. Engl. J. Med. 2009;361(21):2066–2078. doi: 10.1056/NEJMra0804647. - DOI - PMC - PubMed
    1. Dave M., Papadakis K.A., Faubion W.A., Jr. Immunology of inflammatory bowel disease and molecular targets for biologics. Gastroenterol. Clin. N. Am. 2014;43(3):405–424. doi: 10.1016/j.gtc.2014.05.003. - DOI - PMC - PubMed
    1. Wéra O., Lancellotti P., Oury C. The dual role of neutrophils in inflammatory bowel diseases. J. Clin. Med. 2016;5(12) doi: 10.3390/jcm5120118. - DOI - PMC - PubMed

Substances