. 2025 Feb:68:1-15.
doi: 10.1016/j.jare.2024.02.002. Epub 2024 Feb 7.

Identification of a transcription factor AoMsn2 of the Hog1 signaling pathway contributes to fungal growth, development and pathogenicity in Arthrobotrys oligospora

Affiliations

Identification of a transcription factor AoMsn2 of the Hog1 signaling pathway contributes to fungal growth, development and pathogenicity in Arthrobotrys oligospora

Qianqian Liu et al. J Adv Res. 2025 Feb.

Abstract

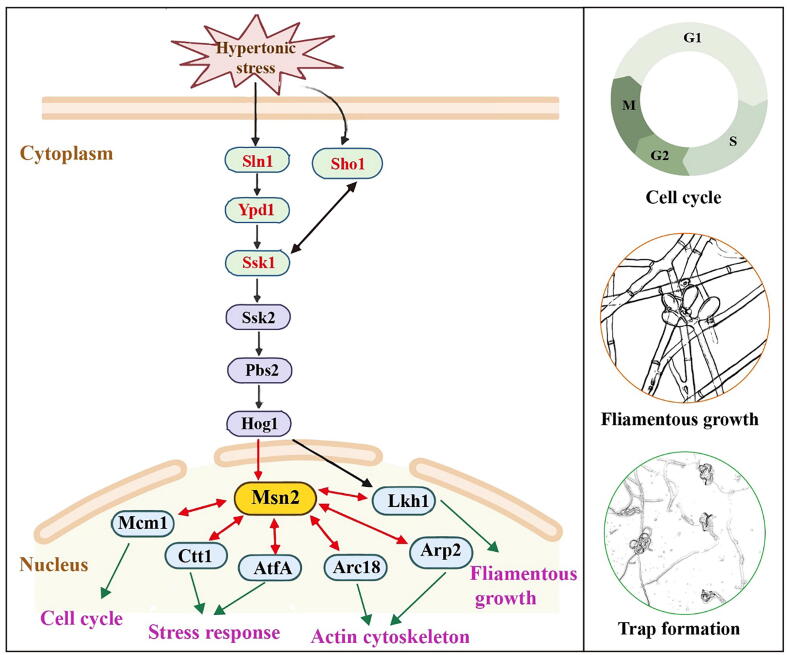
Introduction: Arthrobotrys oligospora has been utilized as a model strain to study the interaction between fungi and nematodes owing to its ability to capture nematodes by developing specialized traps. A previous study showed that high-osmolarity glycerol (Hog1) signaling regulates the osmoregulation and nematocidal activity of A. oligospora. However, the function of downstream transcription factors of the Hog1 signaling in the nematode-trapping (NT) fungi remains unclear.

Objective: This study aimed to investigate the functions and potential regulatory network of AoMsn2, a downstream transcription factor of the Hog1 signaling pathway in A. oligospora.

Methods: The function of AoMsn2 was characterized using targeted gene deletion, phenotypic experiments, real-time quantitative PCR, RNA sequencing, untargeted metabolomics, and yeast two-hybrid analysis.

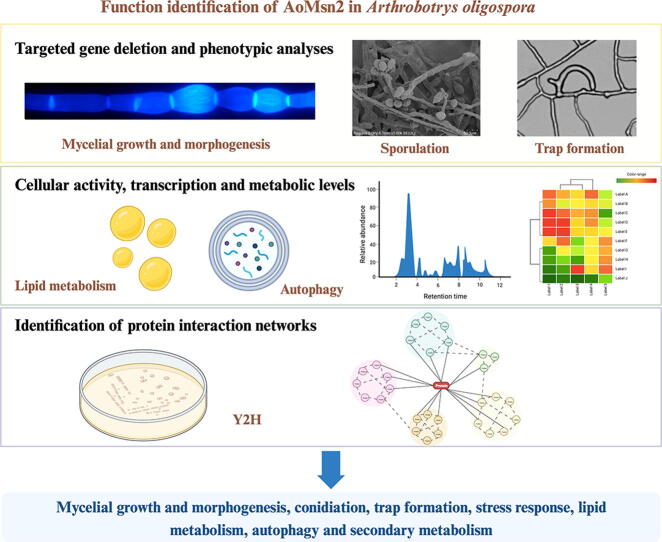
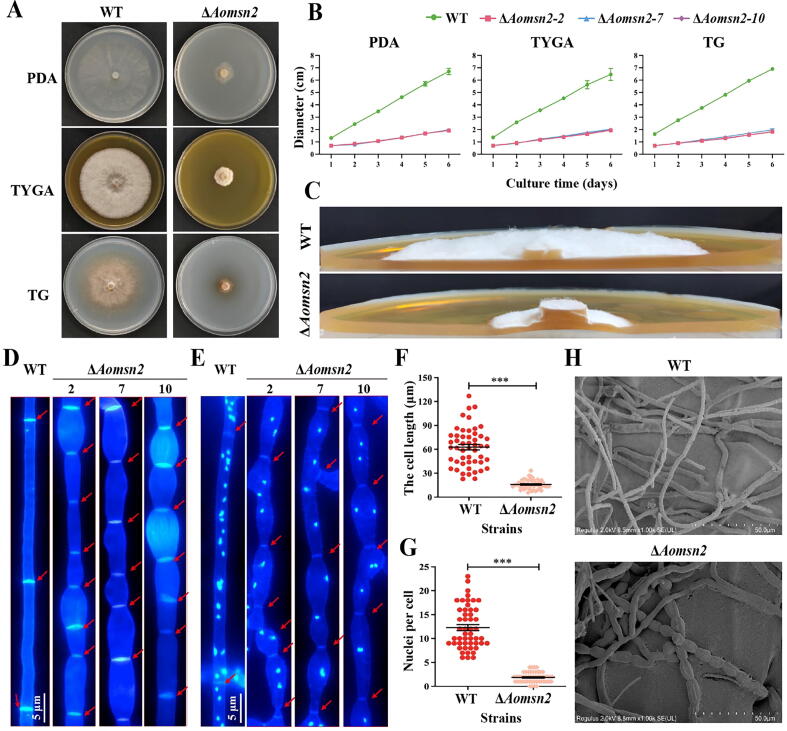
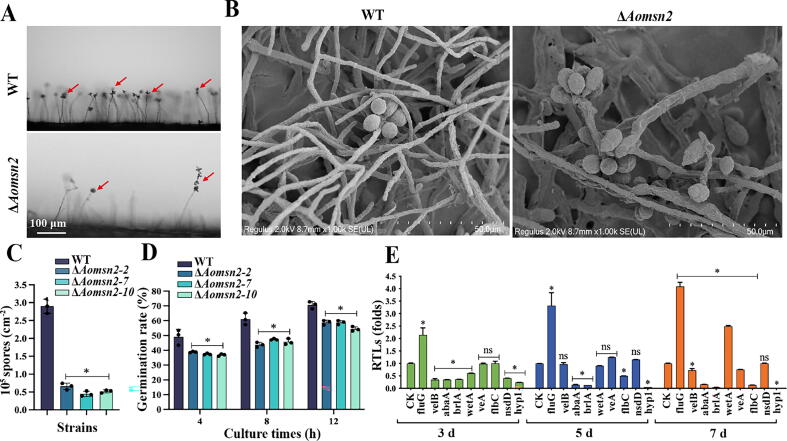
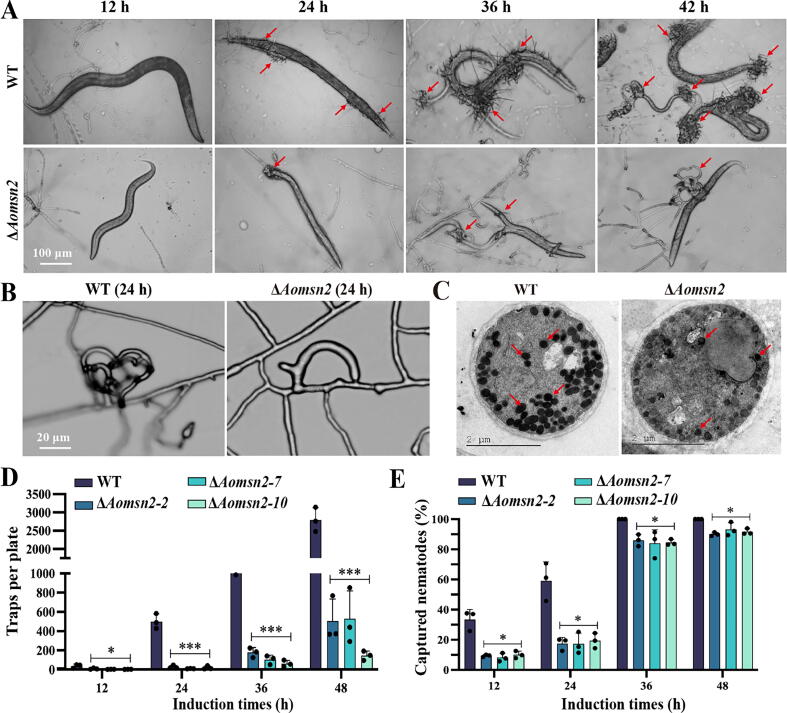
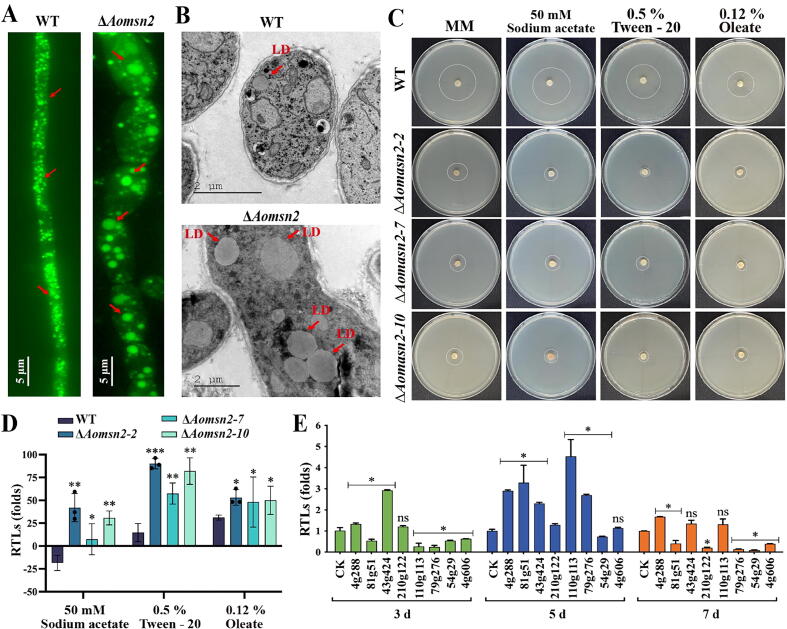
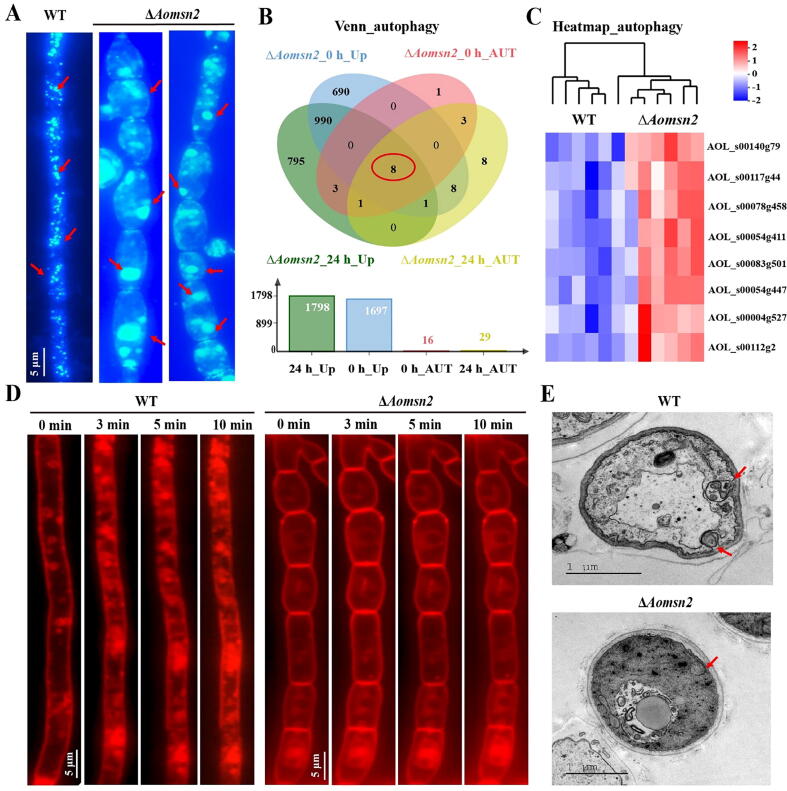
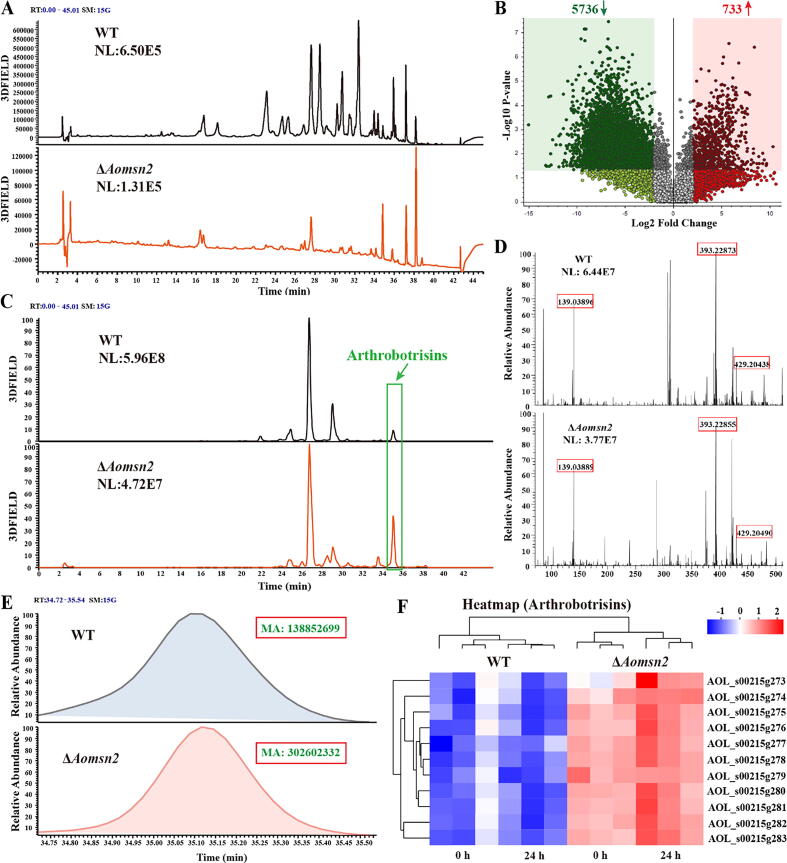
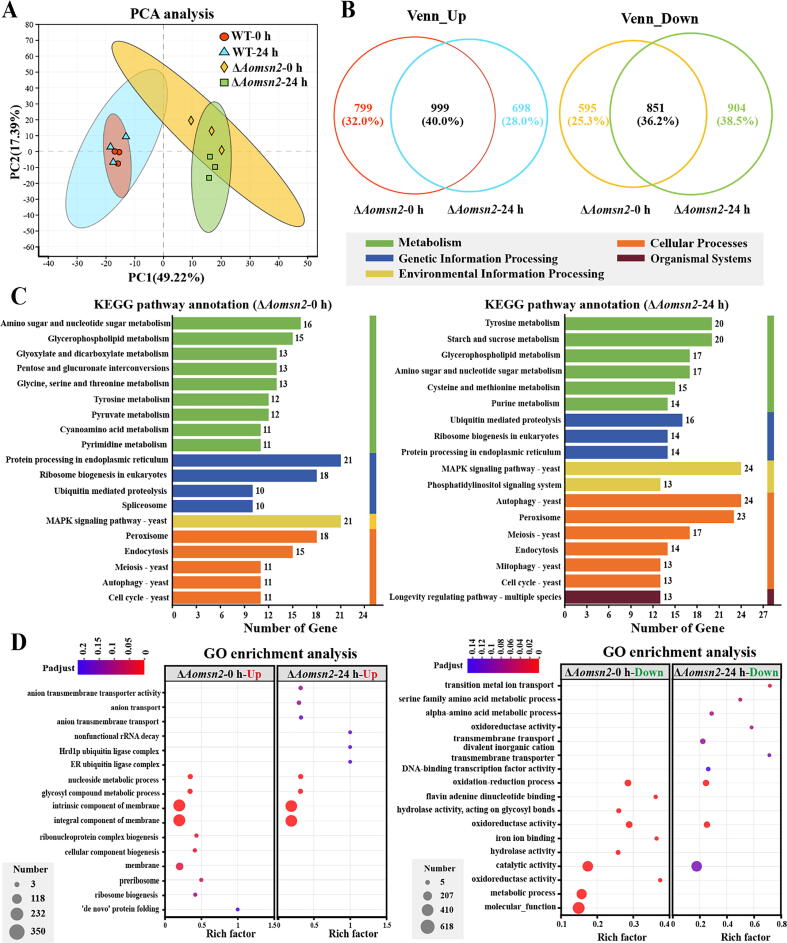
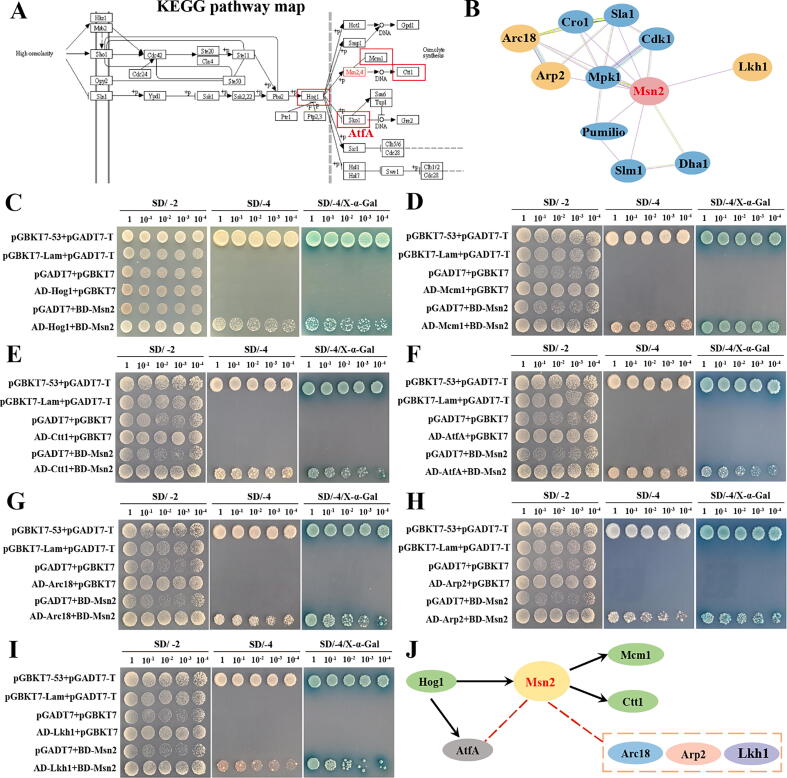
Results: Loss of Aomsn2 significantly enlarged and swollen the hyphae, with an increase in septa and a significant decrease in nuclei. In particular, spore yield, spore germination rate, traps, and nematode predation efficiency were remarkably decreased in the mutants. Phenotypic and transcriptomic analyses revealed that AoMsn2 is essential for fatty acid metabolism and autophagic pathways. Additionally, untargeted metabolomic analysis identified an important function of AoMsn2 in the modulation of secondary metabolites. Furtherly, we analyzed the protein interaction network of AoMsn2 based on the Kyoto Encyclopedia of Genes and Genomes pathway map and the online website STRING. Finally, Hog1 and six putative targeted proteins of AoMsn2 were identified by Y2H analysis.

Conclusion: Our study reveals that AoMsn2 plays crucial roles in the growth, conidiation, trap development, fatty acid metabolism, and secondary metabolism, as well as establishes a broad basis for understanding the regulatory mechanisms of trap morphogenesis and environmental adaptation in NT fungi.

Keywords: Arthrobotrys oligospora; Conidiation; Hog1 signaling pathway; Secondary metabolism; Transcription factor Msn2; Trap formation.


Conflict of interest statement

Declaration of competing interest The authors declare that they have no known competing financial interests or personal relationships that could have appeared to influence the work reported in this paper.

Figures

None
Graphical abstract
Fig. 1
Fig. 1
Comparison of hyphal growth and morphogenesis between wild-type (WT) and ΔAomsn2 mutant strains. (A) Colonies of the WT and ΔAomsn2 strains grown on PDA, TG, and TYGA plates at 28 °C for 6 days. (B) Quantification of colony diameter of the indicated strains grown on PDA, TYGA, and TG plates. (C) Lateral sections of WT and ΔAomsn2 mutants cultured on TYGA plates for 6 days were examined. (D) Morphology of WT and ΔAomsn2 hyphal cells observed using 20 μg/ml CFW staining. (E) Number of nuclei in hyphal cells visualized using DAPI and CFW staining. Cell septa are indicated with red arrows. (G–H) Quantification of mycelial lengths (G) and cell nuclei (H) of WT and ΔAomsn2 mutant strains. Bar = 5 μm. An asterisk (G and H) indicates a significant difference between the ΔAomsn2 mutant and WT strain (n = 50, Tukey’s HSD, ***p < 0.001). (F) Mycelial morphologies of WT and ΔAomsn2 mutant strains were observed using scanning electron microscopy. Bar = 50 μm. (For interpretation of the references to colour in this figure legend, the reader is referred to the web version of this article.)
Fig. 2
Fig. 2
Comparison of conidia formation between the WT and ΔAomsn2 mutant strains. (A) Conidiophores of WT and ΔAomsn2 mutants grown on PDA plates were observed under light microscopy. Bar = 100 μm. Red arrow: conidia. (B) Scanning electron microscope images of the spore morphology of WT and ΔAomsn2 mutants. Bar = 50 μm. (C–D) Quantification of spore yields (C) and spore germination rates (D) of WT and ΔAomsn2 mutants. (E) Comparison of relative transcript levels (RTL) of sporulation-related genes in ΔAomsn2 mutant and WT strains at days 3, 5, and 7. CK was used as the criterion for RTL statistical analysis. Asterisks indicate significant differences between ΔAomsn2 mutants and WT strains (n = 30, Tukey's HSD, *p < 0.05).
Fig. 3
Fig. 3
Comparison of trap formation and pathogenicity between WT and ΔAomsn2 mutant strains. (A) Partial representative images of trap formation at 12, 24, 36, and 48 h, respectively. Red arrow: traps. Bar = 100 μm. (B) The morphology of traps produced by the WT and ΔAomsn2 mutant strains at 24 h. (C) Transmission electron microscope (TEM) images of electron-dense (ED) bodies in trap cells of WT and ΔAomsn2 mutants. Red arrow: EDs. Bar = 2 μm. (D–E) Quantification of the number of traps (D) and captured nematodes (E) by WT and ΔAomsn2 mutant strains at 12, 24, 36, and 48 h. Asterisks (D and E) indicate significant differences between the ΔAomsn2 mutant and WT strain (Tukey's HSD, *p < 0.05, ***p < 0.001). (For interpretation of the references to colour in this figure legend, the reader is referred to the web version of this article.)
Fig. 4
Fig. 4
Comparison of lipid metabolism between the WT and ΔAomsn2 mutant strains. (A) Comparison of lipid droplets (LDs) in WT and ΔAomsn2 mutant hyphal cells. LDs were stained with 10 µg/mL BODIPY dye. Red arrow: LDs. Bar = 5 µm. (B) LDs were observed using TEM. Red arrow: LDs. Bar = 2 µm. (C) Colony morphology of WT and ΔAomsn2 strains cultured on TG plates at 28 °C for 6 days supplemented with different fatty acids as the only carbon source. (D) Relative transcript levels (RTLs) of fungal strains under different fatty acids are the only carbon source. (E) Comparison of RTLs of fatty acid oxidation-related genes in ΔAomsn2 mutant and WT strains at days 3, 5, and 7. CK (whose RTL is 1) was used as the criterion for RTL statistical analysis. Asterisks indicate significant differences between ΔAomsn2 mutants and WT strains (Tukey's HSD, *p < 0.05, **p < 0.01, ***p < 0.001). (For interpretation of the references to colour in this figure legend, the reader is referred to the web version of this article.)
Fig. 5
Fig. 5
Comparison of autophagy and endocytosis between WT and ΔAomsn2 mutant strains. (A) Comparison of autophagosomes in WT and ΔAomsn2 mutant hyphal cells were stained with MDC dye (100 µg/mL). Red arrows: autophagosomes. Bar = 5 µm. (B) Venn analysis of autophagy-related genes and upregulated genes of mutants in transcriptome data. (C) Cluster analysis of the expression levels of eight autophagy-related genes in WT and ΔAomsn2 mutant strains. (D) Comparison of endocytosis of WT and ΔAomsn2 mutants were stained with FM4-64 dye at different times. Bar = 5 µm. (E) Endocytic vesicles in hyphal cells were visualized using TEM. Red arrows: endocytic vesicles. Bar = 1 µm. (For interpretation of the references to colour in this figure legend, the reader is referred to the web version of this article.)
Fig. 6
Fig. 6
Comparison of metabolic profiling between the WT and ΔAomsn2 mutant strains. (A) High-performance liquid chromatography analysis of WT and ΔAomsn2 mutant strains. (B) Volcano plot of differential metabolites between the ΔAomsn2 mutant and WT strain. (C) Chromatograms of arthrobotrisins in WT and ΔAomsn2 mutant strains (Rt = 35 min). (D) Mass spectra of arthrobotrisins in WT and ΔAomsn2 mutant strains (diagnostic fragment ions at m/z 139, 393, and 429). Rt = 35.14 min. (E) Peak area of arthrobotrisins for WT and ΔAomsn2 mutant strains. MA represents the peak area. (F) Clustering heatmap of genes associated with the biosynthesis of arthrobotrisins in transcriptome data.
Fig. 7
Fig. 7
Transcription analysis of WT and ΔAomsn2 mutant strains. (A) Principal Component Analysis (PCA) plots for WT and ΔAomsn2 mutant strains at 0 and 24 h. (B) Venn diagram showing the overlap of upregulated and downregulated differentially expressed genes (DEGs) in the ΔAomsn2 mutant at 0 and 24 h. (C) KEGG enrichment analysis of DEGs in the ΔAomsn2 mutant at 0 and 24 h. (D) The top 16 up- and downregulated enrichment GO terms in the ΔAomsn2 mutant at 0 and 24 h.
Fig. 8
Fig. 8
Identification of candidate proteins interacted with AoMsn2. (A) Prediction of the interaction network of the AoMsn2 protein based on the KEGG pathway analysis. (B) Analysis of the candidate proteins that interacted with AoMsn2 using the online database STRING. (C–I) Yeast two‐hybrid (Y2H) assay of the interactions between AoMsn2 with AoHog1, AoMcm1, AoCtt1, AoAtfA, AoArc18, AoArp2, and AoLKh1. The pGBKT7-53 and pGADT7-T interaction was a positive control, and the pGBKT7-Lam and pGADT7-T interaction was a negative control. (J) A predicted interaction network of AoMsn2.
Fig. 9
Fig. 9
Schematic diagram of the Hog1-MAPK signaling pathway regulated by AoMsn2 in A. oligospora. Red double arrows indicate proteins that interact with AoMsn2; green arrows indicate interacting proteins of AoMsn2 that may be involved in the regulation of the cell cycle, catalase, filamentous growth, and actin cytoskeleton. Of these, Ctt1 and AtfA are associated with the stress response, and Arc18 and Arp2 are associated with the cytoskeleton. (For interpretation of the references to colour in this figure legend, the reader is referred to the web version of this article.)

References

    1. Li J., Zou C., Xu J., Ji X., Niu X., Yang J., et al. Molecular mechanisms of nematode-nematophagous microbe interactions: basis for biological control of plant-parasitic nematodes. Annu Rev Phytopathol. 2015;53(1):67–95. - PubMed
    1. Kenney E., Eleftherianos I. Entomopathogenic and plant pathogenic nematodes as opposing forces in agriculture. Int J Parasitol. 2016;46(1):13–19. - PMC - PubMed
    1. Ahmad G., Khan A., Khan A.A., Ali A., Mohhamad H.I. Biological control: a novel strategy for the control of the plant parasitic nematodes. Antonie Van Leeuwenhoek. 2021;114(7):885–912. - PubMed
    1. Jiang X., Xiang M., Liu X., Heitman J., Crous P.W., James T.Y. Nematode-Trapping Fungi. Microbiol Spectr. 2017;5(1) - PMC - PubMed
    1. Su H., Zhao Y., Zhou J., Feng H., Jiang D., Zhang K.-Q., et al. Trapping devices of nematode-trapping fungi: formation, evolution, and genomic perspectives. Biol Rev Camb Philos Soc. 2017;92(1):357–368. - PubMed

MeSH terms

Supplementary concepts