Review
. 2024 Feb 28;124(4):1899-1949.
doi: 10.1021/acs.chemrev.3c00622. Epub 2024 Feb 8.

Macromolecular Crowding, Phase Separation, and Homeostasis in the Orchestration of Bacterial Cellular Functions

Affiliations
Review

Macromolecular Crowding, Phase Separation, and Homeostasis in the Orchestration of Bacterial Cellular Functions

Begoña Monterroso et al. Chem Rev. .

Abstract

Macromolecular crowding affects the activity of proteins and functional macromolecular complexes in all cells, including bacteria. Crowding, together with physicochemical parameters such as pH, ionic strength, and the energy status, influences the structure of the cytoplasm and thereby indirectly macromolecular function. Notably, crowding also promotes the formation of biomolecular condensates by phase separation, initially identified in eukaryotic cells but more recently discovered to play key functions in bacteria. Bacterial cells require a variety of mechanisms to maintain physicochemical homeostasis, in particular in environments with fluctuating conditions, and the formation of biomolecular condensates is emerging as one such mechanism. In this work, we connect physicochemical homeostasis and macromolecular crowding with the formation and function of biomolecular condensates in the bacterial cell and compare the supramolecular structures found in bacteria with those of eukaryotic cells. We focus on the effects of crowding and phase separation on the control of bacterial chromosome replication, segregation, and cell division, and we discuss the contribution of biomolecular condensates to bacterial cell fitness and adaptation to environmental stress.


Conflict of interest statement

The authors declare no competing financial interest.

Figures

Figure 1
Figure 1
Molecular effects of crowding. (A and B) Crowding increases the chemical potential (activity) of a test protein (T) in solution in a size- and shape-dependent manner. The squares represent a volume element containing spherical macromolecules (in black) that occupy about 30% of the total volume, as is typical of bacterial cytoplasm. The available volume to the center of T is indicated by the blue-colored regions, and its complement (in red) is referred to as the excluded volume. If T is very small relative to the background macromolecules (A), the available volume is almost equal to the total unoccupied volume. But if the size of T is comparable to that of the other solutes (B), the available volume is considerably smaller and the contribution of steric repulsion to reduced entropy and increased free energy is correspondingly greater. Clearly, one of the ways in which the system can reduce its free energy is to maximize the available volume (or, alternatively, to minimize the excluded volume). Reproduced from ref (20). Copyright 2001 Elsevier Inc. under Creative Commons CC-BY license [https://creativecommons.org/licenses/by/4.0/]. (C) Thermodynamic cycles illustrating how dilute or crowded solutions determine free energy differences for (i) a binary heteroassociation between molecules A and B, (ii) a ligand L interacting with its binding site, and (iii) a two-state folding of a protein (red). Reproduced from ref (15). Copyright 2008 Annual Reviews.
Figure 2
Figure 2
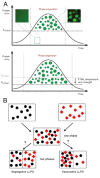
Phase separation. (A) Top: A scheme showing the time-dependent formation of liquid droplets of a protein above the critical concentration for phase separation. These protein microcompartments are dynamic and can exchange molecules with the surrounding phase. Below the critical concentration, they dislodge to form a one-phase state. The insets above show original data from a phase separation experiment with purified GFP-tagged FUS (a prion-like RNA-binding protein). Bottom: Post-translational modifications (PTMs) or changes in temperature or ionic strength can lower the critical threshold for phase separation and allow droplet formation at a much lower protein concentration. Reproduced with permission from ref (42). Copyright 2017 Elsevier Ltd. (B) Liquid–liquid phase separation in a solution containing two macromolecular solute species. Black circles denote species 1, and red diamonds denote species 2. Segregative phase transitions occur when the heterointeraction between molecules of species 1 and 2 is more repulsive than self-interactions between molecules of either species 1 or species 2. Associative phase transitions occur when heterointeractions between molecules of species 1 and species 2 are more attractive than self-interactions between molecules of either species 1 or species 2. Reproduced from ref (43). Copyright 2020 American Chemical Society under an ACS AuthorChoice license [https://pubs.acs.org/page/policy/authorchoice_termsofuse.html].
Figure 3
Figure 3
Decarboxylation of malate by malolactic enzyme MleA, and electrogenic transport of malate via antiport or uniport by MleP. Passive diffusion of lactic acid across the membrane is shown by the dashed arrow. The energetics of malate/lactic acid antiport and malate uniport plus lactic acid diffusion are equivalent. Reproduced with permission from ref (70). Copyright 2019 Wiley-VCHVerlag GmbH&Co. KGaA,Weinheim.
Figure 4
Figure 4
Osmotic challenges and changes in the physicochemistry of the cell. Hypertonicity leads to cell shrinkage and a lowering of the turgor pressure (Δπ); cells plasmolyze when Δπ is zero. During plasmolysis, the cell membrane shrinks away from the cell wall, leading to the collapse of the cytoplasm. The effect of hypertonicity on the overall physicochemistry of the cytoplasm is indicated in the bottom right of the figure. Hypotonicity leads to water uptake and swelling of cells, which increases Δπ and ultimately leads to cell lysis. Figure modified from ref (56). Copyright the Author(s) 2023. Published by Oxford University Press under the terms of the Creative Commons Attribution-NonCommercial License [http://creativecommons.org/licenses/by-nc/4.0/]. Top right: Illustration by David S. Goodsell, RCSB Protein Data Bank depicting the high crowding environment of the bacterial cell, the exclusion of large macromolecular complexes [e.g., (poly)ribosomes in purple] from the nucleoid, and the two-membrane system plus peptidoglycan layer of a Gram-negative bacterium.
Figure 5
Figure 5
Factors that affect protein diffusion inside cells. (A) Hard sphere collisions of the probe (blue) with other freely diffusing molecules (crowders) lowers its diffusion coefficient. (B) Movement through the hydrodynamic wake of another molecule slows down the probe. (C) Complex formation with another particle leads to a lower diffusion coefficient due to the increased effective size of the complex. (D) Immobile barriers such as membranes confine particles in a given part of the cell. The dimensionality of diffusion is reduced at small distances from the barriers. (E) Sieving effects occur when the mesh size of immobile barriers is smaller than the size of the probe, leading to a size-dependent alteration of diffusion. (F) Weak intermolecular forces and steric repulsion between the different biopolymers induce spatial heterogeneity, leading to location-dependent diffusion coefficients of the probe. Reproduced from ref (68). Copyright 2018 Schavemaker, Boersma and Poolman under Creative Commons Attribution License (CC BY) [CC BY 4.0 Deed | Attribution 4.0 International | Creative Commons].
Figure 6
Figure 6
Structure ofEscherichia colicytoplasm and impact of confinement, protein aggregation, and perceived viscosity on the translational diffusion of proteins (red particles). The image in the middle shows a diffusion map obtained by single-molecule displacement mapping (right), a method to determine the mobility of (macro)molecules,, which is overlaid with a schematic of the cytoplasm. The figure emphasizes three factors that affect the translational diffusion of molecules: (i) confinement; (ii) aggregation of macromolecules at the cell poles; and (iii) perceived viscosity. Since diffusion of proteins scales with their complex mass, bigger particles will be affected more by the crowding of the cytoplasm than smaller molecules (hence they perceive a different viscosity) and move relatively more slowly, leading to the deviation from the Einstein–Stokes equation. Dapp = apparent diffusion coefficient of molecules; the pixel size indicates the spatial resolution at which the diffusion of molecules in the cell can be determined. Reproduced from ref (143). Copyright 2023 Mantovanelli et al. under the terms of the Creative Commons Attribution License [https://creativecommons.org/licenses/by/4.0/].
Figure 7
Figure 7
Effect of osmotic upshift (NaCl stress) on the diffusion coefficient of the red fluorescent protein mPlum and NBD-glucose (FSugar). The D values are normalized relative to the diffusion coefficients in the absence of NaCl (D0); data taken from ref (67). Copyright 2010 Blackwell Publishing Ltd. The images on the right show a photobleaching experiment of E. coli cells untreated (left) or upshifted with 500 mM NaCl (right).
Figure 8
Figure 8
The bacterial genome is organized as a phase-separated nucleoid. HU is a histone-like protein that packages DNA into a dense core surrounded by a less dense phase of DNA and associated proteins. Transcriptional foci are dynamic condensates comprised of RNA polymerase and other transcription factors. The single-stranded DNA binding protein (SSB) also forms compartments. Abbreviations: dsDNA, double-stranded DNA; ssDNA, single-stranded DNA. Figure adapted and modified with permission from ref (221). Copyright 2021 Elsevier Ltd.
Figure 9
Figure 9
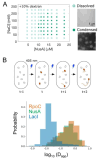
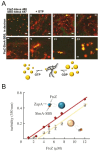
Formation of biomolecular condensates by NusA and dynamics of components of RNAP clusters. (A) Phase diagram for purified NusA in the presence of dextran. Open circles correspond to conditions in which the protein is dissolved, as in the image on the right (top), while closed circles indicate conditions in which the protein is condensed, as in the image on the right (bottom). (B, top) A cartoon depicting how single molecules of NusA are tracked over time in living E. coli cells. Cells expressing NusA fused to the photoconvertible fluorescent protein mMaple are continuously activated with 405 nm light, which photoconverts mMaple from a green-emitting form to a red-emitting form, allowing single NusA-mMaple molecules to be tracked over time. (B, bottom) Distribution of Dapp (apparent diffusion coefficients) for fluorescent fusions of RpoC, NusA, or LacI that were tracked over time, showing faster movement of the former two compared with DNA-bound LacI. Figure adapted from ref (145). Copyright 2020 the Authors. Published by PNAS under Creative Commons Attribution-NonCommercial-NoDerivatives License 4.0 (CC BY-NC-ND) [CC BY-NC-ND 4.0 Deed | Attribution-NonCommercial-NoDerivs 4.0 International | Creative Commons].
Figure 10
Figure 10
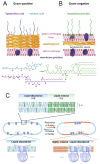
Structure of the bacterial cell envelope and fluid state of the membrane. (A and B) Models of Gram-positive (A) and Gram-negative (B) cell envelopes. Adapted in part from ref (237). Copyright 2019 the Authors. Published by Springer under the terms of the Creative Commons Attribution 4.0 International License [http://creativecommons.org/licenses/by/4.0/]. (C) Reversible phase separation induced by reduction of membrane fluidity. Bilayers are typically in the liquid-disordered phase (Ld, blue), but they can phase separate into liquid-disordered and liquid-ordered phases (Lo, green) when, e.g., hopanoids are present. Both are fluid phases. Extreme fluidity reduction triggers massive phase separation into highly ordered Lo phases within large parts of the membrane, forcing membrane proteins into the fluid phases. Under these conditions the membrane maintains its integrity and semipermeability. Adapted and modified with permission from ref (234). Copyright 2022 the Author.
Figure 11
Figure 11
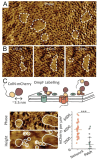
Outer membrane ofE. colicontains protein-free LPS patches. (A) AFM phase image with phase-separated LPS patches highlighted by dashed lines. The pores identify the protein network surrounding the patches, formed by porins as OmpF. (B) At time scales consistent with cell division, under these experimental conditions, patches merge, grow, and split apart. (C) Illustration of OmpF labeling by colicin N1–185mCherry, used to localize the porin within the membrane surface in the height image. The phase image of the same area is used to localize the patches. Quantification of the labels per area shows that OmpF colocalizes with the pore network. Reprinted in part with permission from ref (242). Copyright 2021 PNAS.
Figure 12
Figure 12
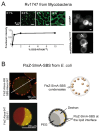
Biomolecular condensates formed by integral or amphitropic proteins at the lipid membrane. (A) (top, left) Fluorescence images showing spontaneous clustering of Rv17471–310 on supported lipid bilayers. Nonphosphorylated His6-tagged OG-Rv17471–310 is anchored to the DGS-NTA(Ni2+) within the lipid bilayers. (bottom, left) Quantification of the phase separation by the fractional fluorescence intensity vs weight percentage of the NTA(Ni2+) lipid. (right) Clustering also occurs in yeast, as shown by the arrowheads in the fluorescence images of cells expressing msfGFP-Rv17471–310, in contrast to cells expressing msfGFP. Reprinted in part with permission from ref (246). Copyright 2019 PNAS. (B) Representative merged confocal images of the encapsulated FtsZ-SlmA-SBS nucleoprotein condensates into microfluidics-based microdroplets stabilized by the E. coli lipid mixture, showing preferential membrane location in a homogeneous crowding model generated with dextran (top) and in a compartmentalized cytoplasm model generated by a binary PEG/dextran LLPS system (bottom). The distribution of the condensates within the encapsulated systems is depicted on the right. Top, partly reproduced from ref (247). Copyright 2023 the Authors. Published by the Royal Society under the terms of the Creative Commons Attribution License [http://creativecommons.org/licenses/by/4.0/]. Bottom, partly reproduced with permission from ref (248). Copyright 2018 the Authors.
Figure 13
Figure 13
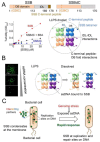
Formation of biomolecular condensates by SSB and regulation by ssDNA. (A) Multifaceted interactions of SSB structural regions are required for efficient LLPS. Schematic domain structures of SSB constructs are shown at the top, with numbers indicating amino acid positions at boundaries of structural regions. The SSBdC construct lacks the C-terminal peptide region. Below, turbidity is shown as a function of protein concentration, in the absence and presence of BSA (150 g/L), along with a model of LLPS-driving interactions. (B) SsDNA regulates SSB phase separation, as shown at the left by fluorescence microscopy of samples containing SSB, fluorescein-labeled SSB, and increasing concentrations of unlabeled dT79, and, on the right, a schematic model for the LLPS-inhibiting effect of ssDNA (black line). (C) Proposed model for the in vivo role of SSB LLPS, based on data from refs (253) and (250). Figure adapted from ref (253). Copyright 2020 the Authors. Published by PNAS under Creative Commons Attribution-NonCommercial-NoDerivatives License 4.0 (CC BY-NC-ND) [CC BY-NC-ND 4.0 Deed | Attribution-NonCommercial-NoDerivs 4.0 International | Creative Commons].
Figure 14
Figure 14
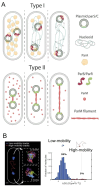
DNA segregation and effects of phase separation. (A) (top) Plasmid segregation by parABS following a pulling mechanism (Type I). ParB binds parS sequences on the plasmids, and the ParB-parS nucleoprotein complex moves poleward, with its attached plasmid, through interactions with ParA that is localized between ParB-parS and the poles. Dashed arrows depict the path of the plasmids. (bottom) Plasmid segregation by ParMRC through a pushing mechanism (Type II). ParR binds parC sequences on the plasmids. A ParM filament polymerizes from soluble monomers between the ParR-parC nucleoprotein complexes on a pair of plasmids and pushes them apart toward the poles. Reprinted in part and adapted from ref (324). Copyright 2021 Gogou, Japaridze, and Dekker under the Creative Commons Attribution License (CC BY) [CC BY 4.0 Deed | Attribution 4.0 International | Creative Commons]. (B) Dynamic properties of ParB condensates. (left) Representative image of a live cell (cell contour represented by a white line) with low-mobility (blue) and high-mobility (red) trajectories of single ParB molecules. Magnified views of each ParB condensate with different low-mobility trajectories are shown with different colors. (right) Histogram of apparent diffusion coefficients for low-mobility (blue) and high-mobility (red) trajectories. Reprinted in part with permission from ref (148). Copyright 2020 Elsevier Inc.
Figure 15
Figure 15
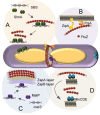
Schematic representation of a dividing E. coli cell showing the FtsZ ring at midcell. (A) Nucleoid occlusion, mediated by the protein SlmA bound to specific DNA sequences (SBSs) on the chromosome, antagonizes Z-ring formation near the chromosome. (B) Two proteins, ZipA and FtsA, anchor the Z-ring to the membrane. (C) The Ter linkage involving the proteins ZapA, ZapB, and MatP, which binds matS sequences at the Ter macrodomain of the chromosome, promotes Z-ring assembly at midcell. (D) The oscillatory MinCDE system, formed by the proteins MinC, MinD, and MinE, prevents Z-ring assembly at the cell poles. Adapted from ref (371). Copyright 2021 by the Authors. Published by MDPI, Basel, Switzerland under the terms and conditions of the Creative Commons Attribution (CC BY) license [https:// creativecommons.org/licenses/by/4.0/].
Figure 16
Figure 16
Effect of crowders on the polymerization of FtsZ. (A) Electron microscopy images of GTP-triggered FtsZ polymers in the presence of the specified crowders. (B) Variation of the critical concentration of polymerization (Cc) of FtsZ with the concentration of Ficoll 70, ovomucoid, and RNase A. Lines correspond to simulations according to a volume exclusion model, showing a pure volume exclusion behavior for Ficoll 70 (υFicoll = 0.96 mL/g) and for RNase A (υRNase = 0.703 mL/g). Experimental data in the presence of ovomucoid cannot be explained in terms of a pure volume exclusion behavior (dashed line, υOvo = 0.69 mL/g) or assuming repulsion with like molecules (dotted line, υOvo = 1.61 mL/g), instead being compatible with a model assuming additional effects (solid line, υOvo = 6.6 mL/g). Arrow in the legend depicts increasing volume exclusion. Adapted or reprinted in part from ref (378), copyright 2016 Monterroso et al. Published by PLOS under the terms of the Creative Commons Attribution License [CC BY 4.0 Deed | Attribution 4.0 International | Creative Commons], and ref (23), copyright 2003 Elsevier Inc. under the terms of the Creative Commons CC-BY license [CC BY 4.0 Deed | Attribution 4.0 International | Creative Commons].
Figure 17
Figure 17
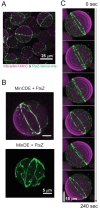
Positioning of Z-ring by the Min system in vesicles. (A) 3D maximum projection of a merged confocal image of vesicles containing the MinCDE proteins (mScarlet-I-MinC, magenta) and FtsZ-Venus-MTS (green) in dextran 70, showing that Z-rings are spatially restricted to the vesicle midpoint by the inhibitory action of the Min-oscillatory wave. The MTS is a heterologous amphipathic helix (membrane targeting sequence) fused to FtsZ-Venus that artificially tethers it to the membrane. (B) 3D projections of a Z-ring positioned by the MinCDE system (top) as in panel A, and a Z-ring that is still positioned at the vesicle midpoint, albeit less efficiently, by the Min system lacking MinC (bottom: Min waves are not visible because of the absence of mScarlet-I-MinC). (C) Time-lapse confocal images of the Z-ring (FtsZ-Venus-MTS, green) stabilized by the oscillatory pole-to-pole Min waves (magenta) as reflected by mScarlet-I-MinC. Adapted in part from ref (396). Copyright 2022 the Authors. Published by Springer Nature under a Creative Commons Attribution 4.0 International License [https://creativecommons.org/licenses/by/4.0/].
Figure 18
Figure 18
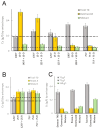
Effect of mixed crowders, involving inert polymers and proteins, on the polymerization of FtsZ. (A and B) Cc values determined in the presence of the specified crowders. F, O, and R are Ficoll 70, ovomucoid, and RNase A, respectively. The numbers in the x-axis are their concentrations in g/L, alone, or in the mixtures. Total crowder concentration in the mixtures is 150 g/L. Long and short dashed lines depict the Cc values in the presence of 150 g/L Ficoll (A and B) and ovomucoid (A) or RNase A (B), respectively. (C) Cc of FtsZ assembly in the presence of the specified individual crowders and their mixtures (50%). Adapted from ref (378). Copyright 2016 Monterroso et al. Published by PLOS under the terms of the Creative Commons Attribution License [CC BY 4.0 Deed | Attribution 4.0 International | Creative Commons].
Figure 19
Figure 19
FtsZ and phase separation. (A) FtsZ distributes differently in encapsulated phase-separated binary mixtures of crowders (PEG/dextran 500 and PEG/Ficoll 70 are shown as examples) depending on its association state. Dissociation of polymers upon GTP depletion produces redistribution within phases of FtsZ species, that are no longer found at the lipid membrane confining the microdroplets. (B) Under crowding conditions promoting phase separation, FtsZ, alone or in the presence of binding partners, forms biomolecular condensates that congregate at the lipid boundary depending on their composition.,
Figure 20
Figure 20
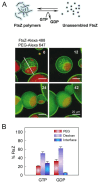
Dynamic relocation of the bacterial division protein FtsZ as a function of its polymerization state in two-phase systems encapsulated inside lipid-stabilized microdroplets. (A) FtsZ filaments preferentially locate in the dextran phase and at the interface of the dextran/PEG system. Upon GTP depletion the filaments disassemble and the protein partitions principally into the dextran phase with no obvious accumulation at the interface. Numbers in the confocal images correspond to time in minutes. A scheme of the association reactions of FtsZ is shown above. (B) Relative amount of FtsZ in each of the phases and at the interface obtained from fluorescence measurements. Reprinted in part from ref (401). Copyright 2016 the Authors. Published by Springer Nature under a Creative Commons Attribution 4.0 International License [CC BY 4.0 Deed | Attribution 4.0 International | Creative Commons].
Figure 21
Figure 21
Dynamic FtsZ-SlmA-SBS condensates in crowded media. (A) Assembly of GTP-triggered FtsZ polymers after addition of nucleotide to FtsZ-SlmA-SBS condensates. The number of condensates decreases with polymer formation. After disassembly of the polymers due to GTP exhaustion, condensates reassemble. Times are in minutes (time zero, GTP addition). Scale bars: 5 μm. A scheme of the dynamic process is shown below. Reprinted in part with permission from ref (248). Copyright 2018 the Authors. (B) Incorporation of ZapA slightly decreases the csat of condensation of FtsZ-SlmA-SBS, monitored using turbidity. Reprinted in part from ref (247). Copyright 2023 the Authors. Published by the Royal Society under the terms of the Creative Commons Attribution License [http://creativecommons.org/licenses/by/4.0/].
Figure 22
Figure 22
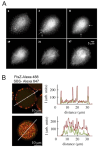
E. coliFtsZ foci suggestive of condensates. (A) FtsZ-GFP foci and filament formation in Chinese hamster ovary cells, after treatment with vinblastine. FtsZ-GFP localization is shown in the same living cell at various times after addition of the drug, in minutes. Arrows indicate growth of filaments from the foci at random locations in the cytoplasm. With time, filaments grow longer, forming a network of filaments, while foci disappear except in the nucleus. Reprinted with permission from ref (409). Copyright 1999 The Company of Biologists Ltd. (B) Representative confocal images of FtsZ-SlmA-SBS condensates (top) and GTP-triggered polymers (bottom) in lipid-stabilized microfluidics-based microdroplets. Also shown are the intensity profiles of the green and red channels, obtained along the line drawn in the images. Reprinted in part from ref (247). Copyright 2023 the Authors. Published by the Royal Society under the terms of the Creative Commons Attribution License [http://creativecommons.org/licenses/by/4.0/].
Figure 23
Figure 23
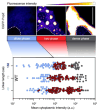
PopZ condensates are regulated by PopZ structural features. Shown at the top are phase diagrams of PopZ expressed in mammalian cells, with PopZ in a dilute phase, two phases, or a dense phase. The nucleoid boundary is represented as a white dotted line. Scale bar, 10 μm. Shown below are phase diagrams of EGFP fused to three PopZ variants with different linker lengths. Each dot represents data from a single cell, and dot color indicates phase. Figure reprinted in part from ref (146). Copyright 2022 the Authors. Published by Springer Nature under a Creative Commons Attribution 4.0 International License [http://creativecommons.org/licenses/by/4.0/].
Figure 24
Figure 24
Biomolecular condensates of the proteins SpmX and PopZ from C. crescentus. (A) Localization of PopZ and its associated scaffold proteins PodJ and SpmX, and signaling proteins PleC and DivJ, at specific cell poles of C. crescentus before and after cell division. SpmX recruits DivJ to condensates at the old pole and stimulates the latter’s kinase activity. CtrA-phosphate is a master transcriptional regulator that controls expression of multiple C. crescentus genes and is selectively enriched at the new cell pole. Figure reproduced from ref (249). Copyright 2022 the Authors. Published by Springer Nature under a Creative Commons Attribution 4.0 International License [http://creativecommons.org/licenses/by/4.0/]. (B) Super-resolution images of purified PopZ (labeled with Atto488) and SpmX (ΔTM, labeled with Cy3) with (top) or without its IDR (bottom), showing demixing of the condensates of SpmX within the condensates of PopZ in vitro, driven by the IDR. (C) False-colored images of C. crescentus cells expressing mCherry-PopZ (green) and SpmX-dL5 (magenta) with (top) or without the SpmX IDR (bottom), suggesting that wild-type SpmX forms multiple condensates in the PopZ microdomain in vivo, also promoted by the IDR. The percentage of PopZ condensates enclosing more than one SpmX condensate (B) or cells with more than one SpmX cluster in the PopZ microdomain (C) is indicated on the right. Scale bars, 5 μm. Figure adapted from ref (150). Copyright 2022 the Authors. Published by American Association for the Advancement of Science under a Creative Commons Attribution License 4.0 (CC BY) [https://creativecommons.org/licenses/by/4.0/].
Figure 25
Figure 25
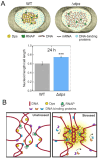
Protection of the DNA by Dps under stress conditions. (A) In wild-type cells, Dps condenses the DNA during the stationary phase (left). This condensation does not take place in the absence of Dps (right). Below, ratios of nucleoid length to cell length in cells with and without Dps. (B) Schematic representation of the model proposed for the protection of DNA by Dps. In the absence of stress conditions, Dps binds to DNA but no major condensation of the nucleoid occurs (left). Under stress conditions, Dps forms biomolecular condensates on a large part of the nucleoid into which RNAP can freely diffuse while other proteins are excluded, which blocks their access to the DNA (right). Figure adapted with permission from ref (425). Copyright 2018 Elsevier Inc.

Similar articles

Cited by

References

    1. Dewachter L.; Verstraeten N.; Fauvart M.; Michiels J. An Integrative View of Cell Cycle Control in Escherichia Coli. FEMS Microbiol. Rev. 2018, 42 (2), 116–136. 10.1093/femsre/fuy005. - DOI - PubMed
    1. Luby-Phelps K. The Physical Chemistry of Cytoplasm and Its Influence on Cell Function: An Update. Mol. Biol. Cell 2013, 24 (17), 2593–2596. 10.1091/mbc.e12-08-0617. - DOI - PMC - PubMed
    1. Spitzer J.; Poolman B. The Role of Biomacromolecular Crowding, Ionic Strength, and Physicochemical Gradients in the Complexities of Life’s Emergence. Microbiol. Mol. Biol. Rev. 2009, 73 (2), 371–388. 10.1128/MMBR.00010-09. - DOI - PMC - PubMed
    1. Rivas G.; Minton A. P. Toward an Understanding of Biochemical Equilibria within Living Cells. Biophys. Rev. 2018, 10 (2), 241–253. 10.1007/s12551-017-0347-6. - DOI - PMC - PubMed
    1. Rivas G.; Minton A. P. Influence of Nonspecific Interactions on Protein Associations: Implications for Biochemistry In Vivo. Annu. Rev. Biochem. 2022, 91 (1), 321–351. 10.1146/annurev-biochem-040320-104151. - DOI - PubMed

Publication types

Substances