. 2024 Feb 8;7(4):e202302400.
doi: 10.26508/lsa.202302400. Print 2024 Apr.

ADAM19 cleaves the PTH receptor and associates with brachydactyly type E

Affiliations

ADAM19 cleaves the PTH receptor and associates with brachydactyly type E

Atakan Aydin et al. Life Sci Alliance. .

Abstract

Brachydactyly type E (BDE), shortened metacarpals, metatarsals, cone-shaped epiphyses, and short stature commonly occurs as a sole phenotype. Parathyroid hormone-like protein (PTHrP) has been shown to be responsible in all forms to date, either directly or indirectly. We used linkage and then whole genome sequencing in a small pedigree, to elucidate BDE and identified a truncated disintegrin-and-metalloproteinase-19 (ADAM19) allele in all affected family members, but not in nonaffected persons. Since we had shown earlier that the extracellular domain of the parathyroid hormone receptor (PTHR1) is subject to an unidentified metalloproteinase cleavage, we tested the hypothesis that ADAM19 is a sheddase for PTHR1. WT ADAM19 cleaved PTHR1, while mutated ADAM-19 did not. We mapped the cleavage site that we verified with mass spectrometry between amino acids 64-65. ADAM-19 cleavage increased Gq and decreased Gs activation. Moreover, perturbed PTHR1 cleavage by ADAM19 increased ß-arrestin2 recruitment, while cAMP accumulation was not altered. We suggest that ADAM19 serves as a regulatory element for PTHR1 and could be responsible for BDE. This sheddase may affect other PTHrP or PTH-related functions.


Conflict of interest statement

The authors declare that they have no conflict of interest.

Figures

None
Graphical abstract
Figure 1.
Figure 1.. Family tree and mutations.
The genomes of three family members were sequenced with the complete Genomics platform. All affected members have the ADAM19 mutation, while non-affected persons do not. (A) Sequenced persons designated with asterisk (A). (B) Hand roentgenograms of a patient illustrating brachydactyly type E with shortened, stubby metacarpals, cone-shaped epiphyses, and shortened proximal phalanges, which were present in all affected family members (B). ADAM19 contains 23 exons. The mutation resides within exon 5. We show the amino acid sequence from amino acids 111–135. The mutation features a deletion resulting in an amino acid exchange at 117, followed by a substitution-insertion and a second insertion. As a result, amino acids 117–135 are faulty, compared to WT. (C) Finally, a TAG stop codon resides after amino acid 135 (C). (D) Multiple ADAM19 peptide-sequence alignments from five different species near the identified mutation(s) were highly conserved region (D).
Figure S1.
Figure S1.. LOD score for South African family by positions (in cM).
Order and cumulative distance between markers. (A) Complete Genomics whole-genome sequencing of family members. (B) A mean coverage of about 60 for each individual sample was achieved (B). (C) The detected insertion and deletion (Indel) events compared to genome assembly hg19 (C). (D) The substitution events are summarized (D).
Figure S2.
Figure S2.. Electropherograms.
Sanger sequencing results of family members numbering from top to bottom: (Aff), (Non), (Aff), (Aff), (Aff), (Aff) and (Non). Pedigree is shown in Fig 1A.
Figure 2.
Figure 2.. Domain organization and ADAM19 structure.
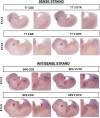
(A) The coding sequence contains 918 amino acids (AA) and different domains: signal peptide (S); pro-peptide domain (P); metalloproteinase domain (M); disintegrin domain (D); cysteine-rich domain (C); EGF-like domain; transmembrane domain (T); and the cytoplasmic (Cyt) domain (A). Immunoprecipitation results from HEK-293T cell extracts were performed. Full-length WT ADAM19 (WT; NM_033274.4) and ADAM19 with the mutations (MT) were transiently transfected in HEK-293T cells to express FLAG-tagged ADAM19 and analyzed with an antibody raised against the pro-domain (Y 50–122) with the epitope to amino acid 50–122, the metalloproteinase domain (Y 216–266) with the epitope to amino acid 216–266 of ADAM19 and a FLAG antibody directed at the tagged cytoplasmic-domain. Two mock transfection controls were used: mock1 (w/o) without ADAM19 cDNA but only with vector-DNA alone and mock 2 (w/o) without PEI. (B) Chondrogenic Adam19 expression in mouse embryos was investigated at 12.5 and 13.5 d by RNA in situ hybridization. (C) Adam19 was expressed in inter-digital space and the developing joints. Scale bars 1 mm (C). Flag-tagged ADAM19 was expressed in HEK-293T cells. (D) Immunofluorescence against the Flag-tag shows that WT ADAM19 is located on the membrane surface, while mutated ADAM19 was not identified (Scale bars 50 μm) (D).
Figure S3.
Figure S3.. Whole-mount RNA in situ hybridization.
Results from E12,5 and E13,5 mouse embryos. Blue/purple color denotes the expression of Adam19. An increased signal can be seen in regions of the finger joints. T7 produces sense transcript and SP6 antisense.
Figure S4.
Figure S4.. Co-localization of ADAM19 WT and PTHR1 on membrane.
ADAM19-WT, ADAM19-MT and PTHR1-WT were transfected individually and ADAM19-WT with PTHR1-WT and ADAM19-MT with PTHR1-WT were cotransfected in HEK 293T cells. The merged immunofluorescence images clearly reveal a colocalization of ADAM19 (stained with anti-FLAG-Alexa-488, in green) and PTHR1 (stained with anti-HA-Cy3, in red) on the membrane while the mutated form of ADAM19-MT shows no fluorescence signal (scale bars 50 μm).
Figure S5.
Figure S5.. Expression analysis of ADAM19 at mRNA level.
Relative mRNA expression of ADAM19 was analyzed in 13 different tissues using fetal heart as calibrator. The highest expression of ADAM19 can be seen in placenta, chondrocytes and in the lungs.
Figure S6.
Figure S6.. Cleavage analysis with different DNA copy numbers from ADAM19 and constant copy number of PTHR1.
For Western blot analysis, HEK 293T cells were transiently transfected with ADAM19-HA-TAG and PTHR1-FLAG-TAG. PTHR1 was detected using an antibody for the FLAG-TAG, ADAM19 was detected using an antibody for HA-TAG. ß-Tubulin served as loading control. The findings demonstrate that WT ADAM19 cleaves PTHR1.
Figure 3.
Figure 3.. ADAM19-shedding detection assay.
For Western blot analysis, HEK-293T cells were transiently transfected for 48 h with ADAM19-HA-tag and PTHR1-FLAG-tag. PTHR1 was detected using antibody directed against the FLAG-tag, the amino acid epitope 52–86, and the amino acid epitope 4–54. ADAM19 was detected using an antibody directed against the HA-tag. (A) β-tubulin served as loading control (A). Verification of cleavage with native receptor and metalloproteases expressed in HEK293T cells for 36 h. Cells were lysed, and receptor proteins were de-glycosylated with PNGase F prior to analysis by SDS–PAGE and Western blot using a polyclonal antiserum directed against the amino acid epitope 573–593 of human PTHR1. (B) ADAM19-E384A is the inactive ADAM19 mutant (B).
Figure 4.
Figure 4.. Fluorescence assay for ADAM19 shedding.
Bar-graph representation of the supernatant-cellular ratio of EYFP fluorescence, tagged at the N-terminus of the PTHR1. For fluorescence detection, HEK-293T cells were transiently transfected, once WT ADAM19 with EYFP-PTHR1 and MT ADAM19 with EYFP-PTHR1. As control, CD4 was co-transfected with EYFP-PTHR1. The data are presented as mean ± SEM; n = 4, t test, ***P < 0.001. (A) The data show that WT ADAM19 cleaved PTHR1, while MT ADAM19 did not (A). Different expression ratios of WT ADAM19 and EYFP-PTHR1 of 3:1, 2:1, 1:1, 1:2, 1:3 and 0:1 were analyzed. The data are presented as mean ± SEM; n = 3, t test; **P < 0.01, *P < 0.05. (B) The data show the PTHR1 cleavage-dependency of ADAM19 (B). Metalloproteinase inhibitor was used to analyze the activity of ADAM19 after suppressing. 1 h after transfection, cells were supplemented with DMEM or with 100 μM Illomastat (Ilo) dissolved in DMEM. As control cells were transfected with EYFP-PTHR1 without ADAM19. (C) The data are presented as mean ± SEM; n = 5, t test; ***P < 0.001, *P < 0.05 (C).
Figure S7.
Figure S7.. Bar-graph representation of the total fluorescence as the sum of the supernatant and the cell values.
(A, B, C) Total fluorescence data from Fig 4A (A), from Fig 4B (B), from Fig 4C (C).
Figure 5.
Figure 5.. Mapping the N-terminal cleavage site by alanine substitution and mass spectrometry.
The EYFP-coupled extracellular domain of the human PTHR1 with amino acid substitutions (sequence with black line) and evaluated cleavage site (red star) is schematically shown. We manipulated amino acids 48 through 79 in segments of eight amino acids each, which were substituted by alanine. (A) The bars indicate the five different eight-amino acid positions which were replaced by alanine, black and blue highlighting indicates alternating exons, red highlighting indicates encoding across a splice junction (A). Bar-graph representation of the supernatant-cellular ratio of EYFP fluorescence (ordinate), with the substitution elements (abscissa). The ratio was measured at the supernatant (shedded EYFP-PTHR1 N-terminus) and the cell suspension (intact N terminus) after allowing ADAM19-mediated shedding for 48 h. Each bar represents shedding ratio of EYFP-PTHR1 with N-terminal mutations of five amino acid residues to alanine. The data are presented as mean ± SEM; n = 4, t test; ***P < 0.001, *P < 0.05. (B) The mutant with alanine at 56–63 was closest to the cleavage site (B). Fragment spectra of ADAM cleavage specific peptides for (left) the c-terminal cleavage product (identifying peptide: “SDKGWTSASTSGKPRK”) and (right) the n-terminal cleavage product (identifying peptide: “EVLQRPASIME”). Acquired and predicted spectra are shown in one graph for each peptide. Identified peptide-fragments are shown in blue (b-ions) and red (y-ions). (C) The bootstrapped spectrum similarity angle distribution is shown next to each sequence and depicts the similarity between acquired and predicted spectrum (C).
Figure S8.
Figure S8.. Confocal microscopy imaging of WT and five different alanine mutant EYFP-PTH1Rs (green) on the plasma membrane of HEK 293 labeled with CellMask DeepRed (red).
Merged images (bottom row) shows the overlap of EYFP-PTH1R (in green) and membrane marker DeepRed (in red) as yellow colorization. The alanine substitutions had no effect on PTHR1 surface expression and receptor internalization (Scale bars 10 μm).
Figure 6.
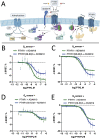
Figure 6.. Effects of ADAM19-mediated cleavage of the PTHR1 on its G-protein related signal transduction.
(A) Schematic representation of cleaved PTHR1 by ADAM19 and the activation of the heterotrimeric G proteins, Gαq and Gαs, effect on ß-arrestin recruitment and cAMP accumulation (A). (B, C, D, E) Activation of Gs or Gq by WT or 56–63A mutant PTHR1 in the presence of ADAM19 after stimulation with PTH (B, C) or PTHrP (D, E). Receptor variants, ADAM19 and bioluminescence resonance energy transfer (BRET) sensors for Gs or Gq (Schihada et al, 2021) were transiently co-expressed in HEK293T cells and changes in BRET were measured after ligand addition. Data are given as relative changes in BRET. A decrease in BRET corresponds to activation of the sensors. Data are from three independent experiments done in duplicates and represent means ± SEM. Data were fitted with a three-parameter non-linear curve fit. Top of the curve (maximum efficacy) is significantly different according to the extra sum of squares F test (<0.0001).
Figure 7.
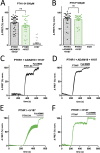
Figure 7.. PTHR1-mediated cAMP accumulation in U2OS cells in absence or presence of ADAM19.
Levels of cAMP accumulation in single cells, measured using the Epac-S-H187 fluorescence resonance energy transfer (FRET) (Klarenbeek et al, 2015) sensor in live cell imaging. (A, B, C, D, E, F) Increase in ΔFRET (CFP/FRET in %) indicates an increase in cAMP (A, B, C, D, E, F). Representative traces of corrected and normalized FRET ratios. (C, D, E, F) U2OS cells were transfected with Epac-S-H187 and PTHR1 with and without co-transfection of ADAM, and were stimulated with 500 pM PTH1-34 (C, E) or PTHrP (D, F). The mean FRET ratio is represented by solid lines, shaded regions indicate the SEM. FRET ratios were normalized relative to the baseline (set as 0%) and the maximum stimulation by 10 μM Forskolin and 100 μM 3-iso-butyl-1 methylxanthine (set as 100%). (C, D, E, F) Representative traces were averaged from n = 8 (C), n = 7 (D), n = 3 (E), and n = 3 (F) cells. (A, B) Grouped analysis of corrected and normalized FRET ratios of all cells stimulated with 500 pM PTH1-34 (A) and PTHrP (B), from a total of n = 96 (A) and n = 76 (B) cells, measured on n = 5 (A) and n = 2 (B) experimental days. Transfection of only Epac-S-H187 was used as a control. (A, B) Statistics: Unpaired t test with Welch’s correction (A) and Mann-Whitney test (B).
Figure S9.
Figure S9.. Control expression for cAMP accumulation experiments (to Fig 7).
(A, B, C, D) YFP direct excitation values (A.U.) obtained from each live cell imaging experiment as a measure for Epac-S-H187 fluorescence resonance energy transfer (FRET) sensor expression, plotted against corrected and normalized FRET ratios (CFP/FRET, %) after stimulation with 500 pM PTH1-34 (A, B) or PTH1rP (C, D).
Figure 8.
Figure 8.. β-arrestin2 recruitment to PTHR1 in U2OS cells in absence or presence of ADAM19.
U2OS cells were transiently transfected with plasmids encoding for ADAM19, PTHR1-Nanoluc, and β-arrestin2-cpVenus (Nemec et al, 2022). (A, B) Arrestin2 recruitment to PTHR1 was measured after addition of PTH (A) or PTHrP (B). Data are from four experiments done in quadruple and represent means ± SEM plus individual experiments are represented as circles. Data were fitted with a three-parameter non-linear curve fit. A corresponding measurement in SaOS cells under PTH addition is shown in Fig S11B. Top of the curve (maximum efficacy) is significantly different according to the extra sum of squares F test (<0.0001).
Figure S10.
Figure S10.. Control expressions for cleavage and ß-arrestin2 recruitment experiments.
(A) Total fluorescence data from Fig 5B (A). (B) Examining β-arrestin2 recruitment in Saos2 cells after PTH stimulation in absence (green) or presence (black) of ADAM19 (B). (B, C, D) Control expressions for the luminescence data from (B, C) and fluorescence data from (B, D).
Figure S11.
Figure S11.. Control expression for signaling assays.
(A, C) Total luminescence data from Fig 8B (A) and Fig 8A (C). (B, D) Total fluorescence data, from Fig 8B (B) and Fig 8B (D). Shown are box plots representing mean + SEM, points represent individual experiments, performed in quadruplicates.
Figure S12.
Figure S12.. Interaction of PTH and PTHrP with the extracellular domain (ECD) of PTH1R.
(A, B) Cartoon representation of the PTH1R ECD of PTH1R in complex with ePTH (PDB 6fj3) (A) or PTHrP (PDB: 7vvl) (B). Interacting residues between peptides and ECD and the disulfide bond between C48 and C117, which tethers helix 1 to the ECD core, are shown as sticks (Arrows). The unstructured loop 1 of the ECD (residues 61–105) is shown as dashed line. ECD, blue; ePTH, yellow; PTHrP, magenta. (C) Sequence comparison between PTH and PTHrP (C). Residues contacting helix 1 are in bold. Variant residues are in orange. Conserved residues are shaded grey. ECD, extracellular domain; TMD, transmembrane domain.
Figure S13.
Figure S13.. Global proteome comparison of PTH1R and PTH1R + ADAM19 expressing cells.
A t test was employed to compare the different experimental groups. The results are presented as Volcano plots with Log2 fold changes in the x-axis and the Log10 transformed P-values in the y-axis. The plot (A) indicates what went up (red) and what went down (blue). The significant proteins were determined based on the Log2FoldChange ≥ 2 and a P-value < 0.5 cut off, indicated by colored nodes. The blue nodes represent proteins that are more abundant in the PTH1R and ADAM19 expressing cell line (upregulated WT cell), while the red nodes indicate proteins (upregulated disease cell) in the PTH1R expressing cell line. Genes upregulated (B) were (red) in WT cell: ATG4A, HSF1; HSF2, RBMS3, GPSM3, SLC2A13, CC2D1A; CC2D1B, DPF1; DPF2; KAT6A, GPAT3; GPAT4, TJP1; TJP2, PLSCR1, GLS2, ATP2B2, PIP4P2, SYS1, TEAD2, ZNF320; ZNF354A; ZNF445; ZNF595; ZNF765; ZNF813, EHMT1; EHMT2, NHLRC3, MANBA; XPNPEP1, KIFAP3; UFL1, POLR2F, ARMC3, PCGF2, ADAM19, HSPA6 Genes upregulated in disease cell: RPS10P5, CCDC154, PKLR, CHMP4B; CHMP4C, MAGEB2; MAGEB4, KHDRBS1; KHDRBS3; MYH16, DNAH5; DNAH8, POLR1A; POLR3A, SLC38A9, NCK1; NCK2, ROR1; ROR2, NPAS2, CDK16; CDK17, SLC37A3, ZNF703, SNCA, ARHGEF17; RAB43, TM2D3, COL1A1; COL2A1, OSTM1, ANKRD10, CDK11A, SNCA; SNCB, KLC1; KLC4, TTC39C, DNMT3B, GNG7, RWDD3, BRD2; BRD3; BRD4, LGR6. Heatmap illustrating the Label free quantification (LFQ) intensity profiles for the significant proteins in the volcano plot. To determine if the observed upregulated proteins are due to the expression of ADAM19 alone we compared the LFQ intensities of these proteins across all the cell lines (PTH1R = PTH1R overexpression, ADAM19 + PTH1R = ADAM19 and PTH1R overexpression, ADAM19 = ADAM19 overexpression and endogenous = no transfection control). The LFQ intensities were log2 transformed and the missing values were imputed. (B) The median LFQ values from the three replicates were then z-scored and represented in the heatmap to visualize the comparison (B).

Similar articles

References

    1. Abecasis GR, Cherny SS, Cookson WO, Cardon LR (2002) Merlin--rapid analysis of dense genetic maps using sparse gene flow trees. Nat Genet 30: 97–101. 10.1038/ng786 - DOI - PubMed
    1. Arai HN, Sato F, Yamamoto T, Woltjen K, Kiyonari H, Yoshimoto Y, Shukunami C, Akiyama H, Kist R, Sehara-Fujisawa A (2019) Metalloprotease-dependent attenuation of BMP signaling restricts cardiac neural crest cell fate. Cell Rep 29: 603–616.e5. 10.1016/j.celrep.2019.09.019 - DOI - PubMed
    1. Borner S, Schwede F, Schlipp A, Berisha F, Calebiro D, Lohse MJ, Nikolaev VO (2011) FRET measurements of intracellular cAMP concentrations and cAMP analog permeability in intact cells. Nat Protoc 6: 427–438. 10.1038/nprot.2010.198 - DOI - PubMed
    1. Cartwright JD, Rosin M, Robertson C (1980) Brachydactyly type E: A report of a family. S Afr Med J 58: 255–257. - PubMed
    1. Che P, Bussell JD, Zhou W, Estavillo GM, Pogson BJ, Smith SM (2010) Signaling from the endoplasmic reticulum activates brassinosteroid signaling and promotes acclimation to stress in Arabidopsis. Sci Signal 3: ra69. 10.1126/scisignal.2001140 - DOI - PubMed

MeSH terms

Substances

Supplementary concepts

LinkOut - more resources