. 2024 Feb 9;40(1):3.
doi: 10.1186/s42826-024-00190-x.

Morin ameliorates myocardial injury in diabetic rats via modulation of inflammatory pathways

Affiliations

Morin ameliorates myocardial injury in diabetic rats via modulation of inflammatory pathways

Vipin Kumar Verma et al. Lab Anim Res. .

Abstract

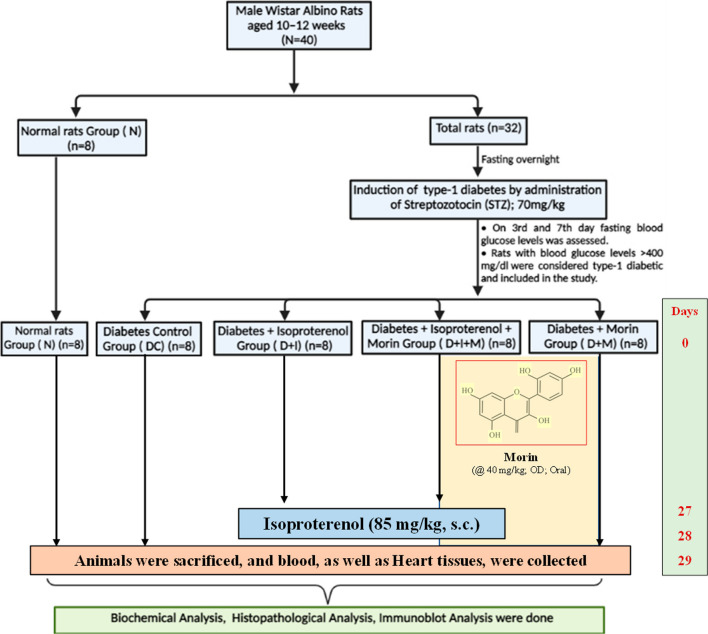
Background: High blood glucose levels in diabetes lead to vascular inflammation which accelerates atherosclerosis. Herein, Morin was orally administered in male Wistar rats, at the dose of 40 mg/kg for 28 days, and on the 27th and 28th day, ISO was administered to designate groups at the dose of 85 mg/kg s.c., to induce myocardial infarction.

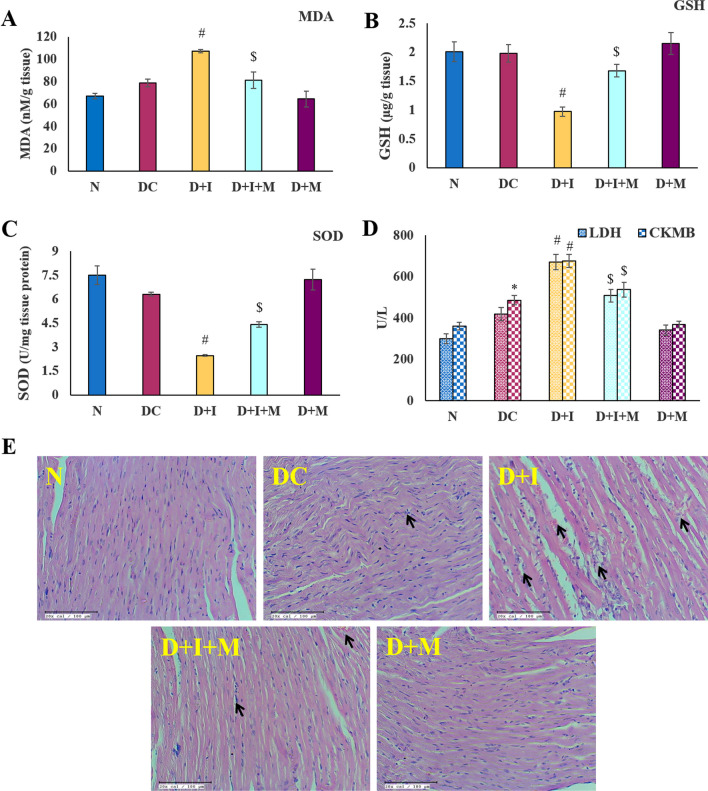
Results: Free radical generation, including ROS, in diabetes following ISO administration, leads to the activation of both intrinsic and extrinsic pathways of apoptosis. Morin significantly (p ≤ 0.05) reduced oxidative stress (GSH, MDA, SOD), cardiac injury markers (CK-MB, LDH), inflammation (TNF, IL-6), and apoptosis (Bax, BCl2, Caspase-3). In addition, it also reduced insulin and blood glucose levels. Akt/eNOS, Nrf2/HO-1, MAPK signaling pathways, and Insulin signal transduction pathways were positively modulated by morin pre-treatment.

Conclusions: Morin attenuated oxidative stress and inflammation and also modified the activity of various molecular pathways to mitigate cardiomyocyte damage during ISO-induced MI in diabetic rats.

Keywords: Diabetes; Isoproterenol; Molecular signaling pathway; Myocardial necrosis.


Conflict of interest statement

The authors declare no conflicts of interest for this publication. The expressed views in this article are of the authors alone.

Figures

Fig. 1
Fig. 1
Schematic representation of study protocol
Fig. 2
Fig. 2
Effect of morin on animal weight, blood glucose and Insulin concentration. A. average weight gain per day in grams [(Present weight – previous weight)/ Number of days)]; B. Fasting blood glucose levels in mg/dl, and C. serum insulin levels in µIU/ml. Statistical analysis was performed using one-way ANOVA followed by Bonferroni multiple comparison tests. All values are expressed as mean ± SEM (n = 6). Error bars with different superscripts are shown as significantly different (P < 0.05) where “*” indicates statistical difference between N vs DC; “#” specify the difference between DC vs D + I and D + M; however “$” shows statistical difference in between D + I vs D + I + M). N: Normal; DC: Diabetes control; D + I: Diabetes + Isoproterenol (ISO); D + I + M: Diabetes + ISO + Morin 40 mg/kg; D + M: Diabetes + Morin 40 mg/kg
Fig. 3
Fig. 3
Effect of morin on biochemical parameters, cardiac-injury markers, and Pathological changes A.MDA (Malonaldehyde) levels in nM per gram heart tissue weight. B. GSK (Reduced glutathione) levels in µg present per gram of rat heart tissue weight. C. SOD (superoxide dismutase) levels in the Unit of SOD present per gram of heart tissue weight. D. LDH (Lactate dehydrogenase) and CK-MB (Creatine Kinase-MB) levels in rat serum in Units present per liter of serum. Statistical analysis was performed using one-way ANOVA followed by Bonferroni multiple comparison tests. All values are expressed as mean ± SEM (n = 6). Error bars with different superscripts are shown as significantly different (P < 0.05) where “*” indicates statistical difference between N vs DC; “#” specify the difference between DC vs D + I and D + M; however “$” shows statistical difference in between D + I vs D + I + M). N: Normal; DC: Diabetes control; D + I: Diabetes + Isoproterenol (ISO); D + I + M: Diabetes + ISO + Morin 40 mg/kg; D + M: Diabetes + Morin 40 mg/kg. E. Effect of morin on histopathological changes in rat models of diabetes and myocardial injury (200x; scale bar 100 μm; n = 3). Arrow represents the myocardial damage as infiltration of immune cells, myocardial membrane damage, and necrosis. a. Normal; b. Diabetes control; c. Diabetes + Isoproterenol (ISO); d. Diabetes + ISO + Morin 40 mg/kg; e. Diabetes + Morin 40 mg/kg
Fig. 4
Fig. 4
Effect of morin on apoptotic pathway proteins A.Representative western blotting images showing expression of apoptotic pathway proteins. Graphical representation of relative densitometric quantification w.r.t. respective loading control and normalized with Normal group. B. Bax dimer and monomer. C. Bcl-2. D. Cleaved-Caspase-3. E. Cytochrome-C. F. p53. G. PARP in rat heart tissue. Statistical analysis was performed using one-way ANOVA followed by Bonferroni multiple comparison tests (n = 3). Error bars with different superscripts are shown as significantly different (P < 0.05) where “*” indicates statistical difference between N vs DC; “#” specify the difference between DC vs D + I and D + M; however “$” shows statistical difference in between D + I vs D + I + M). N: Normal; DC: Diabetes control; D + I: Diabetes + Isoproterenol (ISO); D + I + M: Diabetes + ISO + Morin 40 mg/kg; D + M: Diabetes + Morin 40 mg/kg
Fig. 5
Fig. 5
Effect of Morin on MAPK and inflammatory pathway proteins A.Representative western blots and their densitometric quantification w.r.t. respective loading control. Bars represent the relative intensity of respective protein normalized with Normal group. a. MAPK-ERK/ P-ERK. b. P38/ P-P38. c. JNK/ P-JNK. d. NF-κBp65/ P- NF-κBp65. e. IKKβ/ P-IKKβ. B. Concentration of inflammatory cytokines TNF and IL-6 estimated through ELISA following manufacturer’s protocol. C. Concentration of inflammasome proteins Caspase-1, NLRP-3 and IL-1β proteins. Statistical analysis was performed using one-way ANOVA followed by Bonferroni multiple comparison tests (n = 3). Error bars with different superscripts are shown as significantly different (P < 0.05) where “*” indicates statistical difference between N vs DC; “#” specify the difference between DC vs D + I and D + M; however “$” shows statistical difference in between D + I vs D + I + M). N: Normal; DC: Diabetes control; D + I: Diabetes + Isoproterenol (ISO); D + I + M: Diabetes + ISO + Morin 40 mg/kg; D + M: Diabetes + Morin 40 mg/kg
Fig. 6
Fig. 6
Effect of morin on Insulin signaling pathway proteins, FABP, HMGB and HSP expressions. A. Representative western blot images of different study group animals (n = 3). The bar graph represents the relative band intensity w.r.t. respective loading control and normalized with Normal group. AMPK/ P-AMPK B; AKT/ P-AKT C; eNOS/ GSK-3β D; Cyclin D1 E; FABP and HMGB-1 F; Heat shock proteins (70/ 27/ 20) G. Statistical analysis was performed using one-way ANOVA followed by Bonferroni multiple comparison tests (n = 3). Error bars with different superscripts are shown as significantly different (P < 0.05) where “*” indicates statistical difference between N vs DC; “#” specify the difference between DC vs D + I and D + M; however “$” shows statistical difference in between D + I vs D + I + M). N: Normal; DC: Diabetes control; D + I: Diabetes + Isoproterenol (ISO); D + I + M: Diabetes + ISO + Morin 40 mg/kg; D + M: Diabetes + Morin 40 mg/kg
Fig. 7
Fig. 7
Effect of morin on Nrf-2/HO-1 and AGE-RAGE A. Representative western blot images of Nrf-2/ HO-1 and RAGE of study groups. The bar graphs showing relative band intensity w.r.t. respective loading control normalized with Normal group for Nrf-2/ HO-1 B and RAGE C. The concentration of AGEs were measured from ELISA following manufacturer’s protocol and represented in ug of AGEs present per mg of heart tissues D. Statistical analysis was performed using one-way ANOVA followed by Bonferroni multiple comparison tests (n = 3). Error bars with different superscripts are shown as significantly different (P < 0.05) where “*” indicates statistical difference between N vs DC; “#” specify the difference between DC vs D + I and D + M; however “$” shows statistical difference in between D + I vs D + I + M). N: Normal; DC: Diabetes control; D + I: Diabetes + Isoproterenol (ISO); D + I + M: Diabetes + ISO + Morin 40 mg/kg; D + M: Diabetes + Morin 40 mg/kg

Similar articles

Cited by

References

    1. Saeedi P, Petersohn I, Salpea P, Malanda B, Karuranga S, Unwin N, et al. Global and regional diabetes prevalence estimates for 2019 and projections for 2030 and 2045: results from the International Diabetes Federation Diabetes Atlas. Diabetes Res Clin Pract. 2019;157:107843. doi: 10.1016/j.diabres.2019.107843. - DOI - PubMed
    1. Lee YB, Han K, Kim B, Lee SE, Jun JE, Ahn J, et al. Risk of early mortality and cardiovascular disease in type 1 diabetes: a comparison with type 2 diabetes, a nationwide study. Cardiovasc Diabetol. 2019;18(1):157. doi: 10.1186/s12933-019-0953-7. - DOI - PMC - PubMed
    1. Daffu G, del Pozo CH, O'Shea KM, Ananthakrishnan R, Ramasamy R, Schmidt AM. Radical roles for RAGE in the pathogenesis of oxidative stress in cardiovascular diseases and beyond. Int J Mol Sci. 2013;14(10):19891–19910. doi: 10.3390/ijms141019891. - DOI - PMC - PubMed
    1. David JA, Rifkin WJ, Rabbani PS, Ceradini DJ. The Nrf2/Keap1/ARE Pathway and oxidative stress as a therapeutic target in type II diabetes mellitus. J Diabetes Res. 2017;2017:4826724. doi: 10.1155/2017/4826724. - DOI - PMC - PubMed
    1. Duan J, Guan Y, Mu F, Guo C, Zhang E, Yin Y, et al. Protective effect of butin against ischemia/reperfusion-induced myocardial injury in diabetic mice: involvement of the AMPK/GSK-3β/Nrf2 signaling pathway. Sci Rep. 2017;7:41491. doi: 10.1038/srep41491. - DOI - PMC - PubMed