

Individualized detection of TMPRSS2-ERG fusion status in prostate cancer: a rank-based qualitative transcriptome signature
- PMID: 38331878
- PMCID: PMC10854045
- DOI: 10.1186/s12957-024-03314-8
Individualized detection of TMPRSS2-ERG fusion status in prostate cancer: a rank-based qualitative transcriptome signature
Abstract
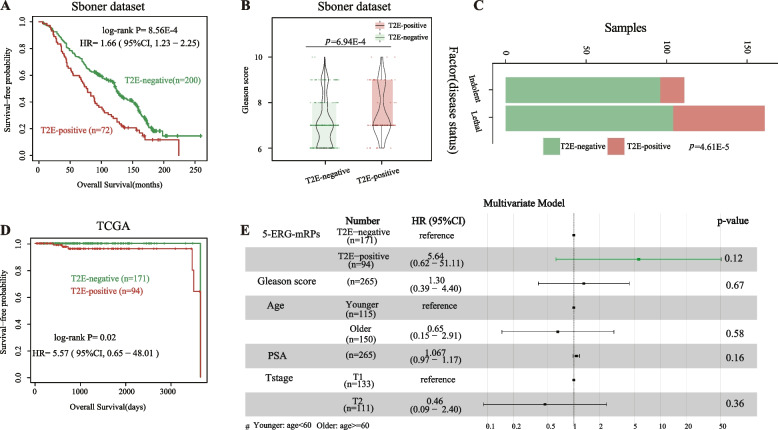
Background: TMPRSS2-ERG (T2E) fusion is highly related to aggressive clinical features in prostate cancer (PC), which guides individual therapy. However, current fusion prediction tools lacked enough accuracy and biomarkers were unable to be applied to individuals across different platforms due to their quantitative nature. This study aims to identify a transcriptome signature to detect the T2E fusion status of PC at the individual level.
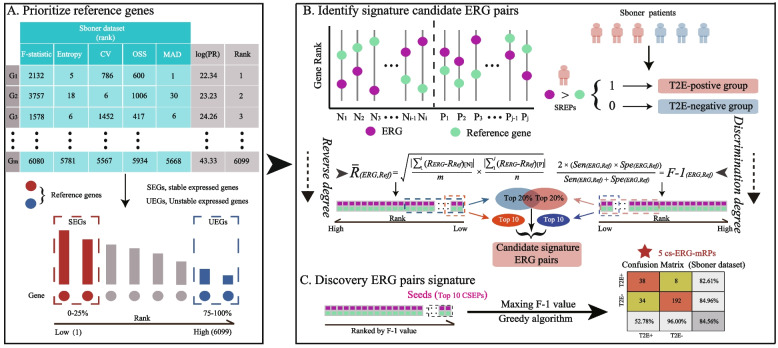
Methods: Based on 272 high-throughput mRNA expression profiles from the Sboner dataset, we developed a rank-based algorithm to identify a qualitative signature to detect T2E fusion in PC. The signature was validated in 1223 samples from three external datasets (Setlur, Clarissa, and TCGA).
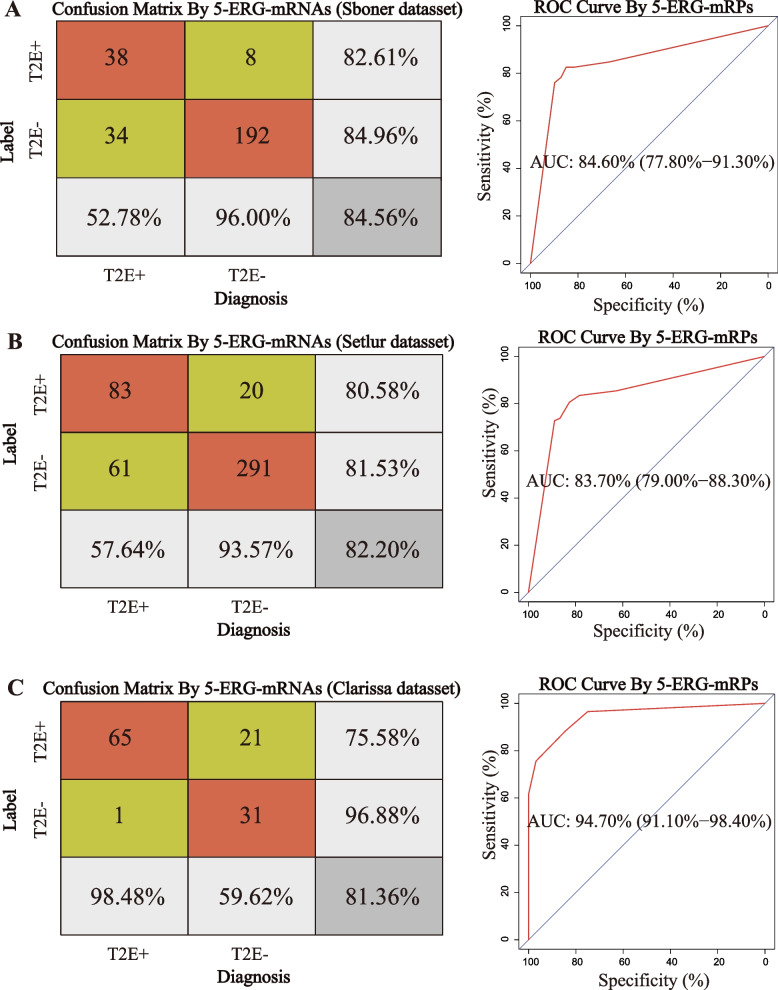
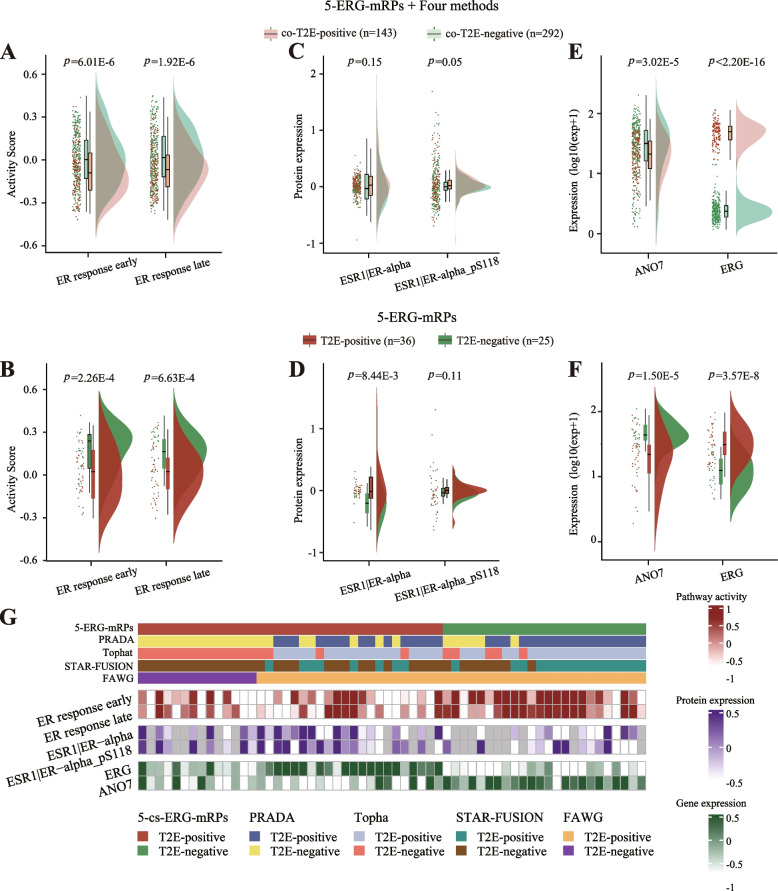
Results: A signature, composed of five mRNAs coupled to ERG (five ERG-mRNA pairs, 5-ERG-mRPs), was developed to distinguish T2E fusion status in PC. 5-ERG-mRPs reached 84.56% accuracy in Sboner dataset, which was verified in Setlur dataset (n = 455, accuracy = 82.20%) and Clarissa dataset (n = 118, accuracy = 81.36%). Besides, for 495 samples from TCGA, two subtypes classified by 5-ERG-mRPs showed a higher level of significance in various T2E fusion features than subtypes obtained through current fusion prediction tools, such as STAR-Fusion.
Conclusions: Overall, 5-ERG-mRPs can robustly detect T2E fusion in PC at the individual level, which can be used on any gene measurement platform without specific normalization procedures. Hence, 5-ERG-mRPs may serve as an auxiliary tool for PC patient management.
Keywords: 5-ERG-mRPs; Cross-platform; Prostate cancer; Qualitative signature; TMPRSS2-ERG fusion.
© 2024. The Author(s).
Conflict of interest statement
The authors declare no competing interests.
Figures
Similar articles
-
Calcium Channel Blocker Use and Risk of Prostate Cancer by TMPRSS2:ERG Gene Fusion Status.Prostate. 2017 Feb;77(3):282-290. doi: 10.1002/pros.23267. Epub 2016 Oct 18. Prostate. 2017. PMID: 27753122 Free PMC article.
-
Insulin-like growth factor 1 receptor affects the survival of primary prostate cancer patients depending on TMPRSS2-ERG status.BMC Cancer. 2017 May 25;17(1):367. doi: 10.1186/s12885-017-3356-8. BMC Cancer. 2017. PMID: 28545426 Free PMC article.
-
TMPRSS2-ERG fusion co-opts master transcription factors and activates NOTCH signaling in primary prostate cancer.Nat Genet. 2017 Sep;49(9):1336-1345. doi: 10.1038/ng.3930. Epub 2017 Aug 7. Nat Genet. 2017. PMID: 28783165
-
Prevalence and clinical application of TMPRSS2-ERG fusion in Asian prostate cancer patients: a large-sample study in Chinese people and a systematic review.Asian J Androl. 2020 Mar-Apr;22(2):200-207. doi: 10.4103/aja.aja_45_19. Asian J Androl. 2020. PMID: 31210145 Free PMC article.
-
ERG protein expression as a biomarker of prostate cancer.Biomark Med. 2013 Dec;7(6):851-65. doi: 10.2217/bmm.13.105. Biomark Med. 2013. PMID: 24266818 Review.
Cited by
-
Overdiagnosis and Overtreatment in Prostate Cancer.Diseases. 2025 May 24;13(6):167. doi: 10.3390/diseases13060167. Diseases. 2025. PMID: 40558578 Free PMC article. Review.
-
Advance in prostate cancer biomarker discovery: bridging detection, prognosis and therapeutics.Discov Oncol. 2025 May 30;16(1):954. doi: 10.1007/s12672-025-02763-1. Discov Oncol. 2025. PMID: 40445561 Free PMC article. Review.
References
-
- Mehdizadeh A, Somi MH, Darabi M, Farajnia S, Akbarzadeh A, Montazersaheb S, Yousefi M, Bonyadi M. Liposome-mediated RNA interference delivery against Erk1 and Erk2 does not equally promote chemosensitivity in human hepatocellular carcinoma cell line HepG2. Artif Cells Nanomed Biotechnol. 2017;45:1612–1619. doi: 10.1080/21691401.2016.1269117. - DOI - PubMed
-
- Valipour B, Abedelahi A, Naderali E, Velaei K, Movassaghpour A, Talebi M, Montazersaheb S, Karimipour M, Darabi M, Chavoshi H, Nozad Charoudeh H. Cord blood stem cell derived CD16(+) NK cells eradicated acute lymphoblastic leukemia cells using with anti-CD47 antibody. Life Sci. 2020;242:117223. doi: 10.1016/j.lfs.2019.117223. - DOI - PubMed
MeSH terms
Substances
Grants and funding
LinkOut - more resources
Full Text Sources
Medical
