. 2024 Feb 8;15(1):1163.
doi: 10.1038/s41467-024-45366-0.

Unraveling the role of the mitochondrial one-carbon pathway in undifferentiated thyroid cancer by multi-omics analyses

Affiliations

Unraveling the role of the mitochondrial one-carbon pathway in undifferentiated thyroid cancer by multi-omics analyses

Seong Eun Lee et al. Nat Commun. .

Abstract

The role of the serine/glycine metabolic pathway (SGP) has recently been demonstrated in tumors; however, the pathological relevance of the SGP in thyroid cancer remains unexplored. Here, we perform metabolomic profiling of 17 tumor-normal pairs; bulk transcriptomics of 263 normal thyroid, 348 papillary, and 21 undifferentiated thyroid cancer samples; and single-cell transcriptomes from 15 cases, showing the impact of mitochondrial one-carbon metabolism in thyroid tumors. High expression of serine hydroxymethyltransferase-2 (SHMT2) and methylenetetrahydrofolate dehydrogenase 2 (MTHFD2) is associated with low thyroid differentiation scores and poor clinical features. A subpopulation of tumor cells with high mitochondrial one-carbon pathway activity is observed in the single-cell dataset. SHMT2 inhibition significantly compromises mitochondrial respiration and decreases cell proliferation and tumor size in vitro and in vivo. Collectively, our results highlight the importance of the mitochondrial one-carbon pathway in undifferentiated thyroid cancer and suggest that SHMT2 is a potent therapeutic target.


Conflict of interest statement

The authors declare no competing interests.

Figures

Fig. 1
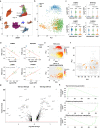
Fig. 1. The serine/glycine metabolic pathway was associated with undifferentiated thyroid cancer.
a Schematic illustration describing the design of our study to verify the role of serine/glycine metabolic pathway (SGP) in thyroid cancer (created with biorender.com). b Volcano plot of differentially expressed metabolites in 17 tumor-normal pairs. A student’s t test (paired, two-sided) was used for statistical analysis. c Scatter plot of PC1 and PC2 from principal-component analysis (PCA) using gene expression of 369 primary tumor samples (348 PTCs, 5 PDTCs, and 16 ATCs). The shape and color of points indicate cancer type (▲, ATC; ●, PDTC; □, PTC) and TDS score, respectively. d Significantly enriched KEGG pathway from GSEA between tumor and normal tissues. The horizontal axis and color represent normalized enrichment score (NES) and p-value, respectively. e Significantly enriched KEGG pathway from GSEA between TDS-high and -low tumors. The horizontal axis and color represent the normalized enrichment score (NES) and p-value, respectively. f Volcano plot comparing expression in 369 primary tumors (348 PTCs, 5 PDTCs, and 16 ATCs) and 263 normal tissues using genes from the top metabolic pathways. Names of SGP genes are annotated. NES and p-value was calculated using fgsea R package. g Volcano plot comparing expression of TDS-high (n = 138) and -low (n = 231) tumors using genes from the top metabolic pathways. Names of SGP genes are annotated. PTC papillary thyroid cancer, PDTC poorly differentiated thyroid cancer, ATC anaplastic thyroid cancer, TDS thyroid differentiation score. Source data are provided as a Source Data file.
Fig. 2
Fig. 2. SHMT2 and MTHFD2 were upregulated and associated with poor prognosis in undifferentiated thyroid cancer.
a Heatmap showing normalized expression of serine/glycine metabolic pathway (SGP) genes in 369 primary tumor samples (348 PTCs, 5 PDTCs, and 16 ATCs). Tumor type were defined by color (green, PTC; brown, PDTC; orange, ATC). TDS was defined by gradient color. b Scatter plot showing Pearson’s correlation between thyroid differentiation score (TDS) and expression of SGP genes in 369 primary tumor samples (348 PTCs, 5 PDTCs, and 16 ATCs). c Scatter plot showing Pearson’s Correlation between tumor size and expression of SGP genes in 369 primary tumor samples (348 PTCs, 5 PDTCs, and 16 ATCs). d Box plots comparing gene expression of SGP genes between TDS-high (n = 138) and -low (n = 231) tumors. The SGP genes are involved in the mitochondrial (SHMT2 and MTHFD2) and cytosolic (SHMT1 and MTHFD1) one carbon pathways, the SSP (PHGDH, PSAT1, and PSPH), mitochondrial serine transporter (SFXN3), cellular serine transporter (SLC1A4 and SLC1A5), and folate transporter (FOLH1). Data were expressed as the mean ± SD. A student’s t test (two-sided) was used for statistical analysis. e Bar plots comparing the proportion of cancer types between low and high groups of SHMT2, MTHFD2, or TDS in primary tumors. Tumor type were defined by color (blue, PTC; light yellow, PDTC; light pink, ATC). A chi-square test (two-sided) was used for statistical analysis. f Bar plots comparing tumor size between low and high groups of SHMT2, MTHFD2, or TDS in primary tumors. A chi-square test (two-sided) was used for statistical analysis. g Bar plots comparing the proportion of tumors with distant metastasis between low and high groups of SHMT2, MTHFD2, or TDS in primary tumors. Blue, without distant metastasis; Red, with distant metastasis. PTC papillary thyroid cancer, PDTC poorly differentiated thyroid cancer, ATC anaplastic thyroid cancer, TPM transcripts per million, Distant meta distant metastasis. A chi-square test (two-sided) was used for statistical analysis. *, p < 0.05; **, p < 0.01; ***, p < 0.001; ****, p < 0.0001; ns, not significant. Source data are provided as a Source Data file.
Fig. 3
Fig. 3. Single-cell RNA sequencing exhibited the association between the mitochondrial one-carbon pathway and thyroid cancer dedifferentiation.
a UMAP plot of all single cells colored by 88,008 cell types. b PCA plot of thyroid cells colored by tissue types. Blue, normal thyroid cells; Green, PTC cells; Orange, ATC cells. In order to achieve balanced cell counts across samples, a total of 100 cells were randomly chosen for each sample. c Violin plots comparing the expression levels of SHMT2, MTHFD2, SHMT1, and PHGDH among different tissue types. Mean values are marked by a red line and are written at the top of each plot. A student’s t test (two-sided) was used for statistical analysis. d Scatter plots showing the relationship between gene expression level (log10 CPM) and thyroid differentiation score (TDS). Each dot represents the mean value of each tissue, and the red lines indicate the fitted linear regression. Blue, normal thyroid cells; Green, PTC cells; Orange, ATC cells. A pearson’s correlation coefficients test (p; two-side) was used for analysis. e PCA plots colored by TDS (upper) and the mean CPM value of SHMT2 and MTHFD2 (lower). F Result of trajectory inference by the RNA velocity algorithm. Black arrows represent the vector from the current transcriptional state to the estimated future state. Orange arrows indicate the summarized direction of regional vectors from TDS-high cells to SHMT2/MTHFD2-high cells. g Volcano plot showing differentially expressed genes between TDS-high SM-low and TDS-low SM-high cells. p-value was calculated using DESeq2 R package. H Representative enrichment plots from GSEA between TDS-high SM-low and TDS-low SM-high cells. PTC papillary thyroid cancer; ATC anaplastic thyroid cancer, CPM count per million, SM mean of SHMT2 and MTHFD2 expression levels; **, p < 0.01; ***, p < 0.001; ns, not significant. Source data are provided as a Source Data file.
Fig. 4
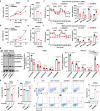
Fig. 4. Down-regulated SHMT2 reduced cell viability and migration in undifferentiated thyroid cancer cells.
a Line plot showing cell viability of shSHMT2-8505C cells compared to shControl-8505C cells in a time-dependent manner. Error bars indicate standard deviations from n = 3 biological replicates. b Bar plot showing reduced cell migration of shSHMT2-8505C cells compared to shControl-8505C cells. Error bars indicate standard deviations from n = 3 biological replicates. c Line and bar plots comparing oxygen consumption rate (OCR) of mitochondrial respiration between shSHMT2-8505C and shControl-8505C cells. Basal respiration (Basal res), ATP production (ATP prod), maximal respiration (Max res), and non-mitochondrial respiration (NMOC) were used as respiratory parameters. Data were expressed as the mean ± SD from n = 5 biological replicates. d Line plot showing cell viability measured during 72 h in shControl-FRO-luc and shSHMT2-FRO-luc cells. Error bars indicate standard deviations from n = 3 biological replicates. e Bar plot comparing cell migration between shControl-FRO-luc and shSHMT2-FRO-luc cells. Error bars indicate standard deviations from n = 3 biological replicates. f Line and bar plots comparing OCR of mitochondrial respiration between shSHMT2-FRO-luc and shControl-FRO-luc cells. Exact p values can be found in the source data file. Data were expressed as the mean ± SD from n = 3 independent experiments. g Western blot images and bar plots comparing OXPHOS protein expression in SHMT2 knock-down 8505 C and FRO-luc cells compared to control cell lines. Error bars indicate standard deviations from n = 4 independent experiments. h Bar plot comparing cell viability of shSHMT2-8505C and shControl-8505C cells with or without 1 mM formate for 24 h. Data were expressed as the mean ± SD from four independent experiments. i Bar plot showing reduced cell viability following SHMT2 reduction in FRO-luc cells and rescue by formate addition. Error bars indicate the standard deviation from four independent experiments. j Scatter and bar plots showing increased apoptotic cell death in shSHMT2-8505C cells with or without 1 mM formate compared to shControl-8505C cells. These experiments are representative of three independent experiments. Data were expressed as the mean ± SD. Oligo oligomycin; CCCP; Rot rotenone; Basal res basal respiration; ATP prod ATP production; Max res maximal respiration; NMOC non-mitochondrial respiration; FRO-luc luciferase-expressing FRO; PI propidium iodide. A student’s t test (two-sided) was used for statistical analysis. *, p < 0.05; **, p < 0.01; ***, p < 0.001; ****, p < 0.0001. Source data are provided as a Source Data file.
Fig. 5
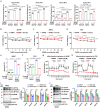
Fig. 5. SHIN2 reduced cell growth and mitochondrial function via SHMT inhibition in vitro.
a Bar plots showing fractional abundance of glycine m + 2, serine m + 1, serine m + 2, and serine m + 3 (n = 4 per group from three independent experiments). bd Line plots showing cell viability after SHIN2 treatment with or without 1 mM formate for 24 h in BCPAP, 8505 C, and FRO cells. Error bars indicate standard deviations from three independent experiments. Black circle, SHIN2; Red square, SHIN2 with formate. e, f Bar plots showing increased apoptosis after 20 µM SHIN2 treatment for 24 h in 8505 C and FRO cells. Error bars indicate standard deviations from n = 3 biological replicates. g, h Line plots showing OCR of mitochondrial respiration after 20 µM SHIN2 treatment for 24 h in 8505 C (g) and FRO (h) cells. These experiments are representative of three independent experiments. Black circle, SHIN2; Red square, SHIN2 with formate. i, j Western blot images and bar plots showing total OXPHOS protein expression after 5–20 µM SHIN2 treatment in 8505 C (i) and FRO (j) cells. Black, DMSO; Green, SHIN2 5 µM; Blue, SHIN2 10 µM; Red, SHIN2 20 µM; OXPHOS, oxidative phosphorylation. All experiments were performed independently at least three times. Data were expressed as the mean ± SD. A student’s t test (two-sided) was used for statistical analysis. *, p < 0.05; **, p < 0.01; ***, p < 0.001; ns, not significant. Exact p values shown in g-j can be found in source data file. Source data are provided as a Source Data file.
Fig. 6
Fig. 6. Inhibition of SHMT2 reduced tumor growth in a xenograft model of undifferentiated thyroid cancer.
a Bioluminescence images and line plot showing tumor volume after injection of shControl/shSHMT2-FRO-luc cells into mice. For in vivo experiments, n = 10 mice per group from three independent experiments. b Line plot showing tumor volume every other day for two weeks after shControl (black circle)/shSHMT2-FRO-luc cells (red square) injection (n = 5 mice per group from three independent experiments). c Bioluminescence images and bar plot showing tumor volume in BALB/c nude mice injected with FRO-luc cells treated with/without SHIN2 (n = 18 mice per group from three independent experiments). These experiments are representative of three independent experiments. Data were expressed as the mean ± SD. A student’s t test (two-sided) was used for statistical analysis. Source data are provided as a Source Data file.

References

    1. Kim J, Gosnell JE, Roman SA. Geographic influences in the global rise of thyroid cancer. Nat. Rev. Endocrinol. 2020;16:17–29. doi: 10.1038/s41574-019-0263-x. - DOI - PubMed
    1. Katoh H, Yamashita K, Enomoto T, Watanabe M. Classification and general considerations of thyroid cancer. Ann. Clin. Pathol. 2015;3:1045.
    1. Van Nostrand D. Radioiodine refractory differentiated thyroid cancer: time to update the classifications. Thyroid. 2018;28:1083–1093. doi: 10.1089/thy.2018.0048. - DOI - PubMed
    1. Yeon EK, et al. Diagnostic performance of a combination of shear wave elastography and b-mode ultrasonography in differentiating benign from malignant thyroid nodules. Clin. Exp. Otorhinolaryngol. 2020;13:186–193. doi: 10.21053/ceo.2019.01235. - DOI - PMC - PubMed
    1. Tae K. Complications of transoral thyroidectomy: overview and update. Clin. Exp. Otorhinolaryngol. 2021;14:169–178. doi: 10.21053/ceo.2020.02110. - DOI - PMC - PubMed

MeSH terms

Substances