. 2024 Feb 8;15(1):1201.
doi: 10.1038/s41467-024-45505-7.

The acidic intrinsically disordered region of the inflammatory mediator HMGB1 mediates fuzzy interactions with CXCL12

Affiliations

The acidic intrinsically disordered region of the inflammatory mediator HMGB1 mediates fuzzy interactions with CXCL12

Malisa Vittoria Mantonico et al. Nat Commun. .

Abstract

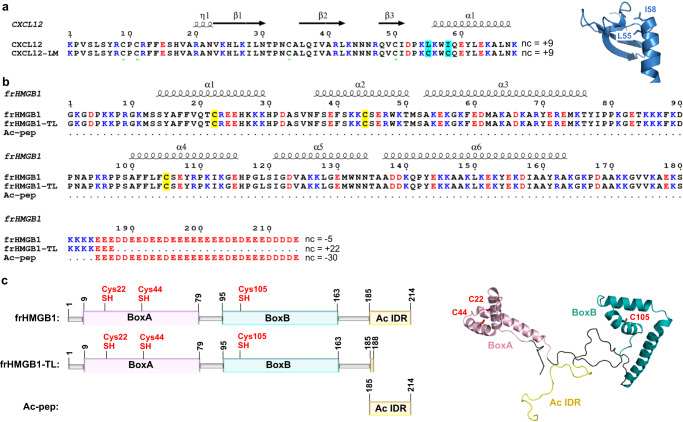
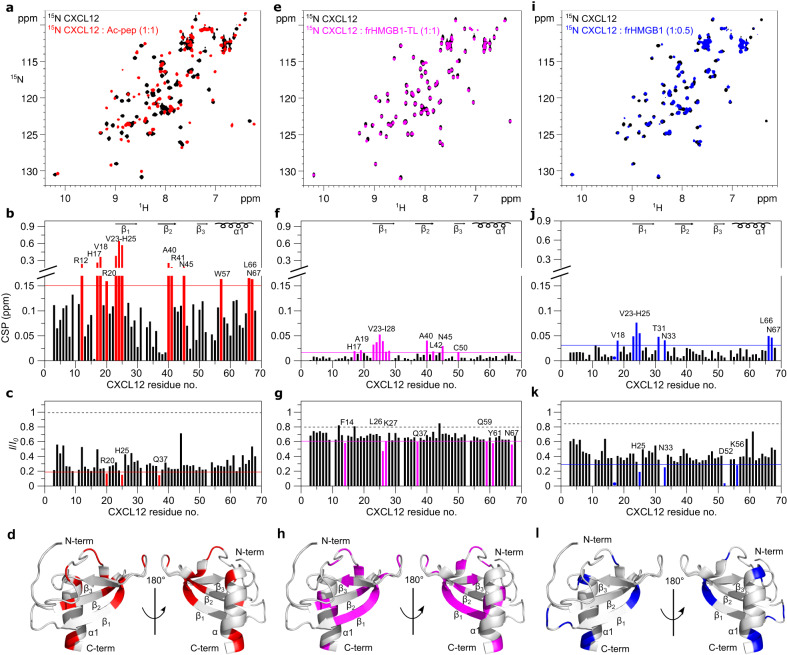
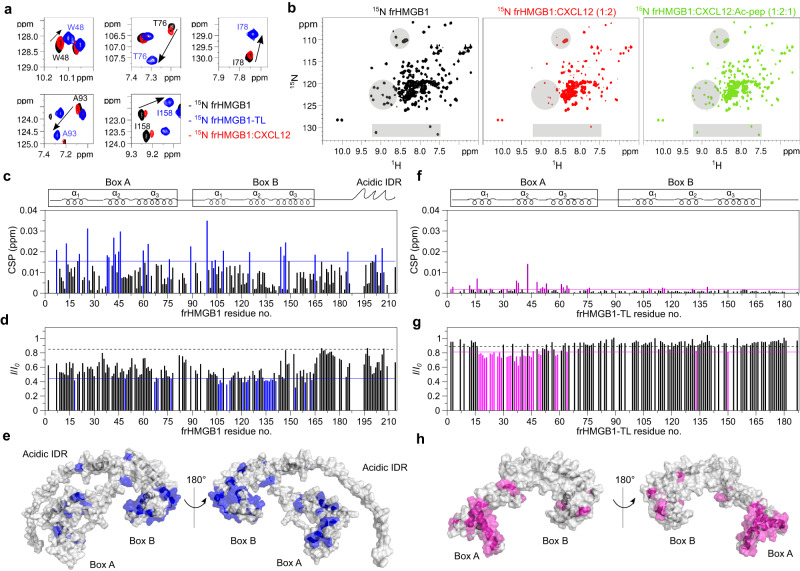
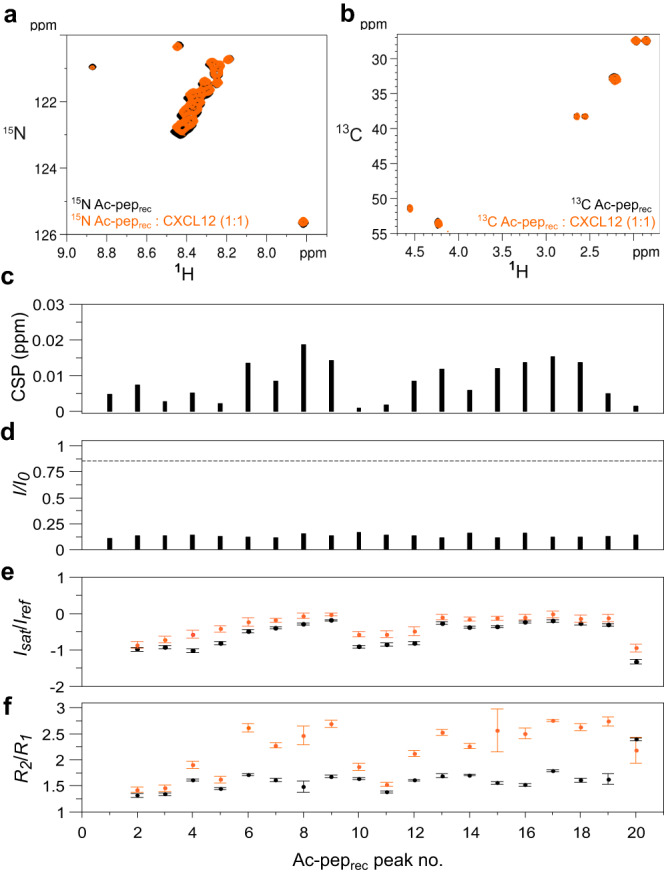
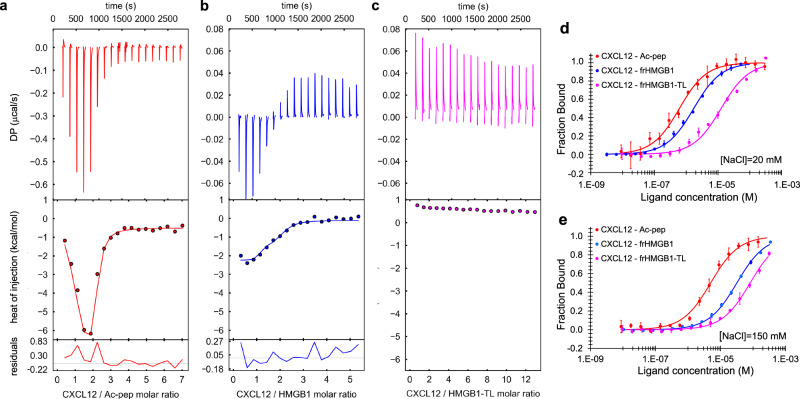
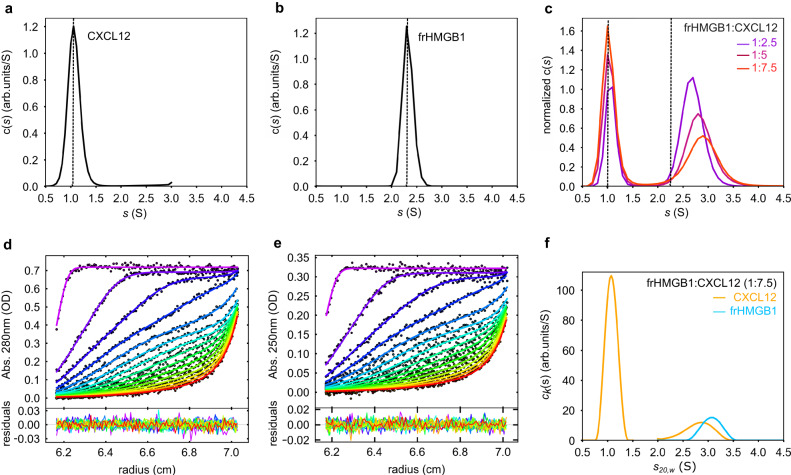
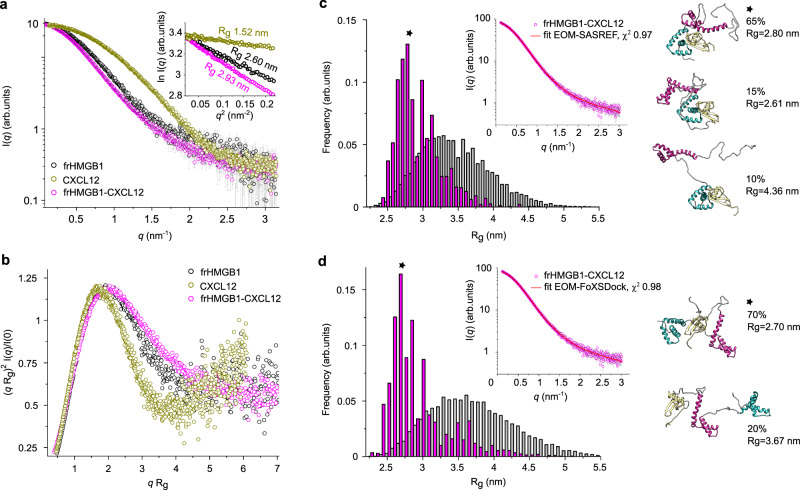
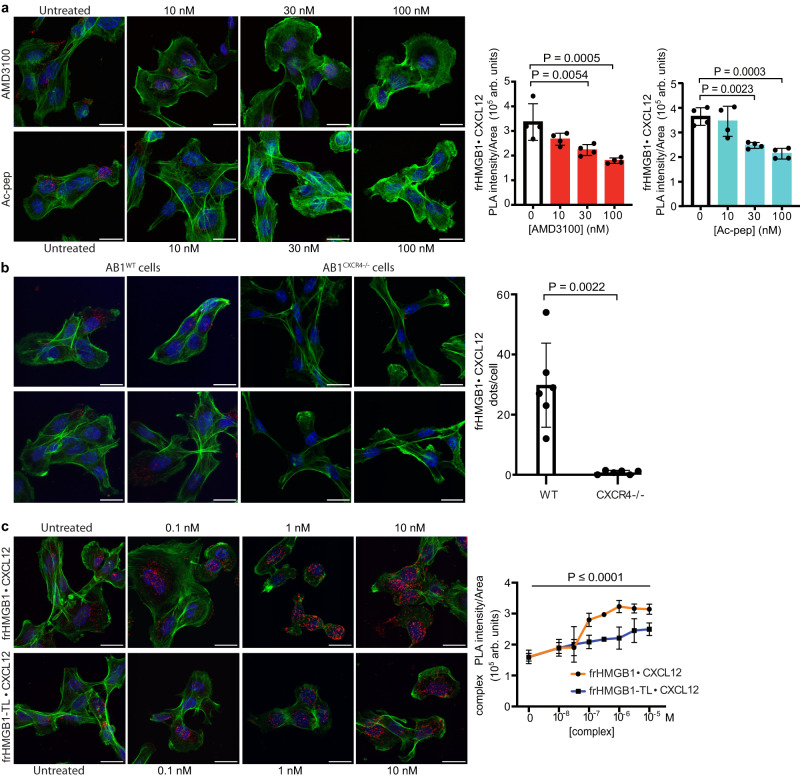
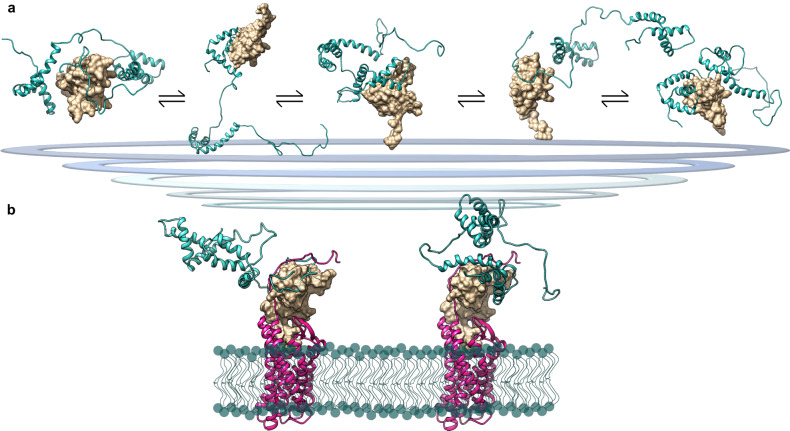
Chemokine heterodimers activate or dampen their cognate receptors during inflammation. The CXCL12 chemokine forms with the fully reduced (fr) alarmin HMGB1 a physiologically relevant heterocomplex (frHMGB1•CXCL12) that synergically promotes the inflammatory response elicited by the G-protein coupled receptor CXCR4. The molecular details of complex formation were still elusive. Here we show by an integrated structural approach that frHMGB1•CXCL12 is a fuzzy heterocomplex. Unlike previous assumptions, frHMGB1 and CXCL12 form a dynamic equimolar assembly, with structured and unstructured frHMGB1 regions recognizing the CXCL12 dimerization surface. We uncover an unexpected role of the acidic intrinsically disordered region (IDR) of HMGB1 in heterocomplex formation and its binding to CXCR4 on the cell surface. Our work shows that the interaction of frHMGB1 with CXCL12 diverges from the classical rigid heterophilic chemokines dimerization. Simultaneous interference with multiple interactions within frHMGB1•CXCL12 might offer pharmacological strategies against inflammatory conditions.


Conflict of interest statement

The authors declare the following competing interests: L.S.C. is an employee and M.E.B. is founder and part-owner of HMGBiotech, a company that provides goods and services related to HMGB proteins. The remaining authors declare no competing interests.

Figures

Fig. 1
Fig. 1. CXCL12 and frHMGB1 constructs.
Amino acid sequence of: (a) CXCL12 and locked monomer CXCL12 mutant L55C/I58C (CXCL12-LM) and (b) frHMGB1, frHMGB1-TL and Ac-pep. Basic and acidic residues are shown in blue and red, respectively, nc indicates the net charge. L55C and I58C are colored in cyan on CXCL12 sequences. C22, C44 and C105 are colored in yellow on HMGB1 sequences. On the top of the alignments the elements of secondary structures are indicated. In (a) on the right is reported the cartoon representation of CXCL12 (pdb code: 2KEE), with L55 and I58 explicitly shown in sticks. c Schematic diagram of the fully reduced form of HMGB1 (frHMGB1), tail-less frHMGB1 (frHMGB1-TL), the acidic peptide (Ac-pep) corresponding to the HMGB1 acidic intrinsically disordered region (Ac IDR). BoxA (pink), BoxB (cyan) and Ac IDR (yellow) are represented with boxes and colored on frHMGB1 structure (AF-P63159). The side chains of fully reduced cysteines are represented in red sticks.
Fig. 2
Fig. 2. Ac-pep, frHMGB1-TL and frHMGB1 interact with CXCL12 dimerization surface.
a Superposition of 1H-15N HSQC spectra of 15N CXCL12 (0.1 mM) without (black) and with (red) Ac-pep (1:1). Bar graph showing (b) residue-specific chemical shift perturbation (CSPs) and c peak intensities ratios (I/I0) of 15N-labeled CXCL12 (0.1 mM) upon addition of Ac-pep (1:1). Residues with CSP > avg + σ0 (corrected standard deviation, red line) and with I/I0 <avg - SD (standard deviation, red line) are labeled and (d) shown in red on CXCL12 (gray cartoon, pdb code: 2KEE). e Superposition of 1H-15N HSQC spectra of 15N CXCL12 (0.1 mM) without (black) and with (magenta) frHMGB1-TL (1:1). Bar graph showing (f) residue-specific CSPs and (g) I/I0 of 15N-labeled CXCL12 (0.1 mM) upon addition of frHMGB1-TL (1:1) of 15N-labeled CXCL12 (0.1 mM). Residues with CSP > avg + σ0 (magenta line) with I/I0 <avg - SD (magenta line) are labeled and (h) shown in magenta on CXCL12. i Superposition of 1H-15N HSQC spectra of 15N CXCL12 (0.1 mM) without (black) and with (blue) frHMGB1 (1:0.5). Bar graph showing (j) residue-specific CSPs and (k) I/I0 of 15N-labeled CXCL12 (0.1 mM) upon addition of frHMGB1 (1:0.5). Residues with CSP > avg + σ0 (blue line) and I/I0 < avg - SD (blue line) are labeled and (l) shown in blue on CXCL12. In the bar graphs α-helices and β-strands are schematically represented on the top, missing residues are prolines, dots indicate residues disappearing upon binding, the dashed black line indicates the expected peak intensity decrease due to the titration dilution effect. Source data are provided as a Source Data file.
Fig. 3
Fig. 3. The frHMGB1•CXCL12 heterocomplex forms via fuzzy interactions.
a Superposition of selected regions of 1H-15N HSQC spectra of 0.1 mM 15N frHMGB1 (corresponding to spy residues W48, T76, I78, A93, I158) without (black) and with 0.2 mM CXCL12 (red) and 0.1 mM 15N frHMGB1-TL (blue). CXCL12 partially competes with intramolecular frHMGB1 interactions and specific amide resonances move (arrow) towards the chemical shift of the corresponding amide in the tailless construct. b 1H-15N HSQC spectra of frHMGB1 (0.1 mM) without (black) and with 0.2 mM CXCL12 (red), and with subsequent addition of 0.1 mM Ac-pep (green). Grey shadowed regions highlight resonances disappearing and reappearing upon addition of CXCL12 and Ac-pep, respectively. Bar graphs showing (c) residue-specific chemical shift perturbation (CSP) and (d) peak intensity ratios (I/I0) of 15N-labeled frHMGB1 (0.1 mM) upon addition of CXCL12 (1:1). Residues with CSP > avg + σ0 (corrected standard deviation, blue line) and I/I0 <avg - SD (standard deviation, blue line) are colored (blue) and (e) mapped on frHMGB1 (grey surface, Aphafold2 model AF- P63159). Bar graph showing (f) residue-specific CSPs and (g) I/I0 of 15N-labeled frHMGB1-TL (0.1 mM) upon addition of CXCL12 (1:1). Residues with CSP > avg + σ0 (magenta line) and I/I0 <avg - SD (magenta line) are colored in magenta and (h) mapped on frHMGB1-TL (grey surface, pdb code: 2YRQ). In the bar-graphs α-helices are schematically represented on the top, missing residues are either prolines, or superimposed residues of the acidic IDR or absent because of exchange with the solvent, the dashed black line indicates the peak intensity decrease due to the titration dilution effect. Source data are provided as a Source Data file.
Fig. 4
Fig. 4. The acidic IDR peptide (15N Ac-peprec) dynamically interacts with CXCL12.
Superposition of (a) 1H-15N HSQC spectra of 15N Ac-peprec (0.1 mM) without (black) and with (orange) CXCL12 (1:1), (b) 1H-15C HSQC spectra of 15N/13C Ac-peprec (0.1 mM) without (black) and with (orange) CXCL12 (1:1). Bar graphs showing (c) chemical shift perturbation (CSPs) and (d) peak intensity ratios (I/I0) of 15N Ac-peprec (0.1 mM) upon addition of CXCL12 (1:1). e Peak intensity ratios of heteronuclear NOE with and without proton saturation (Isat/Iref), error bars were calculated by error propagation from the standard deviation (SD) of the average value of the noise in the saturated Inoise,sat and non saturated reference Inoise,ref spectra. f Ratios of R2 and R1 relaxation rates of 15N Ac-peprec (0.1 mM) without (black) and with CXCL12 (1:1) (orange). Data of one representative experiment performed on n = 2 biologically independent samples are presented as mean values +/− SD. Error bars are derived from relaxation data as described in methods. Amide resonances were not sequence specifically assigned and peaks were attributed arbitrary numbers. Source data are provided as a Source Data file.
Fig. 5
Fig. 5. The acidic IDR of frHMGB1 interacts with CXCL12 via long-range electrostatic interactions.
ITC measurements of CXCL12 titrated into (a) Ac-pep (red), (b) frHMGB1 (blue) and (c) frHMGB1-TL (magenta) (20 mM TrisHCl at pH 7.5, 50 mM NaCl). The upper, middle and lower panels show, respectively, the ITC sequential heat pulses (DP, differential power) for binding, the integrated data corrected for heat of dilution and the residuals. Data in (a, b) were globally fitted. Data in c could not be fitted because the heat of reaction was too small to be fitted with a nonlinear least-squares method. Data represents peak integration of ITC signal. One representative curve (n = 2) for each titration is shown. Normalized variation of fluorescence of 5,6-FAM-labelled Ac-pep upon addition of CXCL12 (red) and normalized variation of MST signal of labeled CXCL12 in the presence of frHMGB1 (blue) and of frHMGB1-TL (magenta), with (d) 20 mM NaCl and with (e) 150 mM NaCl. Data are presented as mean values +/− SD of n = 3 independent replicates. The thermodynamic parameters and Kds are summarized in Table 1. Source data are provided as a Source Data file.
Fig. 6
Fig. 6. frHMGB1 and CXCL12 form a transient 1:1 heterocomplex.
Sedimentation coefficient distributions c(s) of (a) free CXCL12 (38.2 µM) and (b) frHMGB1 (15.6 µM), scanned by absorbance at 280 nm. c Overlay of normalized c(s) showing the interaction between frHMGB1 (7.8 µM) and increasing concentrations of CXCL12 (colors). The dotted lines indicate the sedimentation coefficients of the free components. d, e Global multi-signal sedimentation velocity analysis to determine the stoichiometry of frHMGB1:CXCL12 complex, with 7.7 µM frHMGB1 and 43 µM CXCL12. The raw sedimentation signals of frHMGB1:CXCL12 mixture acquired at different time points with (d) absorbance at 280 nm, and (e) absorbance at 250 nm with the corresponding signal profiles as a function of radius in centimeters. The time-points of the boundaries are indicated in rainbow colors, progressing from purple (early scans) to red (late scans). Only every 3rd scan used in the analysis are shown. Residuals of the fit are shown at the bottom. f Decomposition into the component (k) sedimentation coefficient distributions, ck(s), for CXCL12 (yellow line) and frHMGB1 (cyan line). Source data are provided as a Source Data file.
Fig. 7
Fig. 7. SAXS studies of free frHMGB1, CXCL12 and of frHMGB1•CXCL12.
a I(q) versus q experimental SAXS profiles for CXCL12 (gold), frHMGB1 (black) and frHMGB1•CXCL12 complex (magenta). The curves are shifted by an arbitrary offset for better comparison. Error bars represent an estimate of the experimental error σ on the intensity recorded for each value of q as assigned by data reduction software. In the inset, the Guinier regions used to estimate the radii of gyration (Rg, nm). b Dimensionless Kratky plots for the data presented in (a). Analysis of SAXS data by EOM on frHMGB1•CXCL12 models obtained using (c) SASREF and (d) FoXSDock with distributions of the selected ensemble conformers (magenta bars) and the initial pools of structures (grey bars) as a function of Rg in nm. In the insets, I(q) versus q (magenta squares) with the EOM fitting (red lines with the corresponding χ2 values) for the frHMGB1•CXCL12 complex. Representative structures of the most populated EOM ensembles are shown in cartoon, with BoxA, BoxB, acidic IDR and CXCL12 coloured in cyan, magenta, grey and gold, respectively. For each ensemble, the frequency-weighted size average (the asterisks indicate the most populated fractions) and Rg values are indicated. Source data are provided as a Source Data file.
Fig. 8
Fig. 8. The acidic IDR modulates frHMGB1•CXCL12 binding to CXCR4 on AB1 cells.
a Representative confocal microscopy images of Proximity Ligation Assays (PLAs) performed on the frHMGB1•CXCL12 complex on the surface of AB1 malignant mesothelioma cells. Cells were either untreated or treated with AMD3100 or Ac-pep (light blue bars) for 1 h at 37 °C/5% CO2 at three different concentrations (10, 30, or 100 nM). PLA signal was quantified as described in the Methods section. Mean ± SD are indicated; n = 4 FOV (field of view) per concentration. One-way ANOVA was performed comparing AMD3100 (red) and Ac-pep (light blue) treated cells to untreated cells (white); AMD3100 versus untreated: **P = 0.0054; ***P = 0.0005; Ac-pep versus untreated: **P = 0.0023, ***P = 0.0003. Data are presented as arbitrary units (arb. units). Scale bar; 20 μm. b Representative confocal microscopy images of PLAs performed on the frHMGB1•CXCL12 complex on the surface of either wild type (WT) or Cxcr4 knockout (Cxcr4−/−) AB1 malignant mesothelioma cells. PLA signal was quantified as number of dots per cell in FOV. Statistical analysis; two-tailed, non-parametric Mann–Whitney test. Mean ± SD are indicated; n = 6 FOV per condition. Data are presented as arbitrary units (arb. units). Scale bar; 20 μm. c PLA signal quantification on the surface of ligand-stripped AB1 cells exposed at 4 °C to increasing concentrations of either frHMGB1•CXCL12 or frHMGB1-TL•CXCL12 equimolar heterocomplexes. Data are presented as arbitrary units (arb. units). Mean ± SD are indicated; n = 4 FOV per concentration. The difference between frHMGB1•CXCL12 (orange) and frHMGB1-TL•CXCL12 (blue) heterocomplexes is statistically significant (P < 0.0001) by two-way ANOVA. Sidak’s multiple comparisons test revealed statistically significant differences between frHMGB1•CXCL12 and frHMGB1-TL•CXCL12 at the following concentrations; 10−7 M: P = 0.0004, 10−6.5 M, P = 0.0003, 10−6 M: P < 0.0001, 10−5.5 M: P = 0.0013, and 10−5 M: P = 0.0032. In all panels, nuclei are in blue (Hoechst 33342), phalloidin is in green, and the frHMGB1•CXCL12 PLA signal is red. Scale bar; 20 μm. Source data are provided as a Source Data file.
Fig. 9
Fig. 9. Model of frHMGB1•CXCL12 fuzzy complex.
a Representative EOM models of the fuzzy interactions between frHMGB1 (cyan cartoon) and CXCL12 (gold surface). b Explicative representations of possible different frHMGB1•CXCL12 conformations bound to CXCR4. Two SAXS-EOM frHMGB1•CXCL12 models have been superimposed on the theoretical model of CXCL12 in complex with CXCR4, with CXCR4 in magenta, CXCL12 in gold surface and frHMGB1 in cyan; the lipid bilayer is represented with cyan spheres and lines.

References

    1. Zlotnik A, Yoshie O. The chemokine superfamily revisited. Immunity. 2012;36:705–716. doi: 10.1016/j.immuni.2012.05.008. - DOI - PMC - PubMed
    1. Hughes CE, Nibbs RJB. A guide to chemokines and their receptors. FEBS J. 2018;285:2944–2971. doi: 10.1111/febs.14466. - DOI - PMC - PubMed
    1. Drurya LJ, et al. Monomeric and dimeric CXCL12 inhibit metastasis through distinct CXCR4 interactions and signaling pathways. Proc. Natl Acad. Sci. USA. 2011;108:17655–17660. doi: 10.1073/pnas.1101133108. - DOI - PMC - PubMed
    1. Miller MC, Mayo KH. Chemokines from a structural perspective. Int. J. Mol. Sci. 2017;18:2088. doi: 10.3390/ijms18102088. - DOI - PMC - PubMed
    1. Veldkamp CT, Peterson FC, Pelzek AJ, Volkman BF. The monomer-dimer equilibrium of stromal cell-derived factor-1 (CXCL 12) is altered by pH, phosphate, sulfate, and heparin. Protein Sci. 2005;14:1071–1081. doi: 10.1110/ps.041219505. - DOI - PMC - PubMed