. 2024 Feb 8;15(1):1210.
doi: 10.1038/s41467-024-45121-5.

Compromised transcription-mRNA export factor THOC2 causes R-loop accumulation, DNA damage and adverse neurodevelopment

Affiliations

Compromised transcription-mRNA export factor THOC2 causes R-loop accumulation, DNA damage and adverse neurodevelopment

Rudrarup Bhattacharjee et al. Nat Commun. .

Abstract

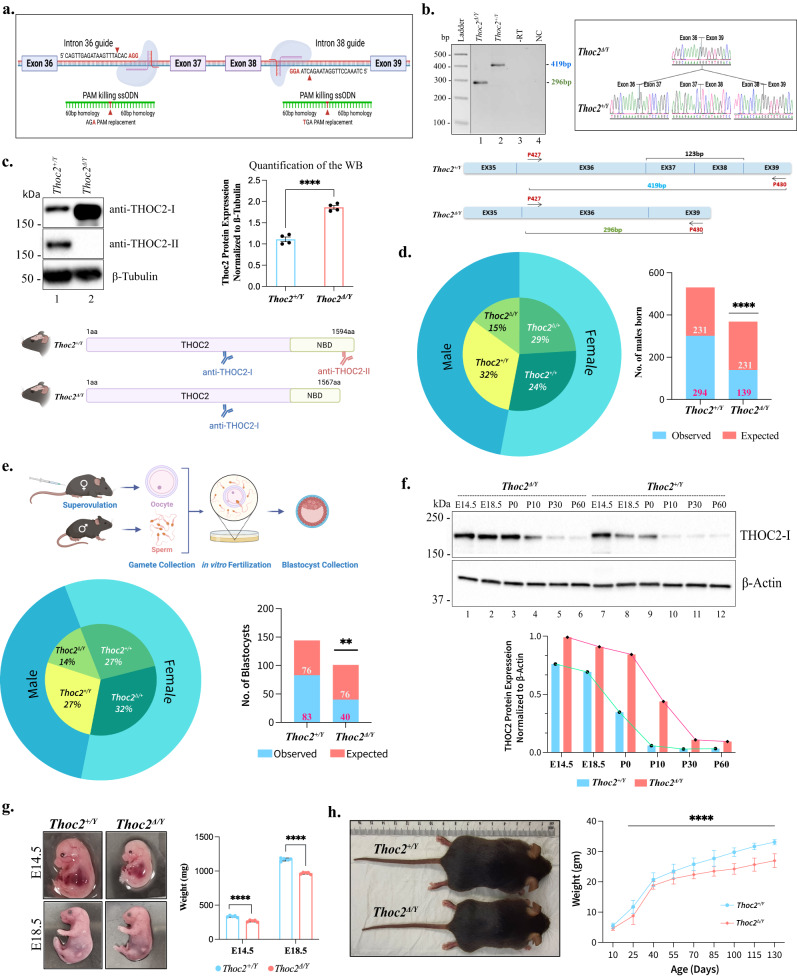
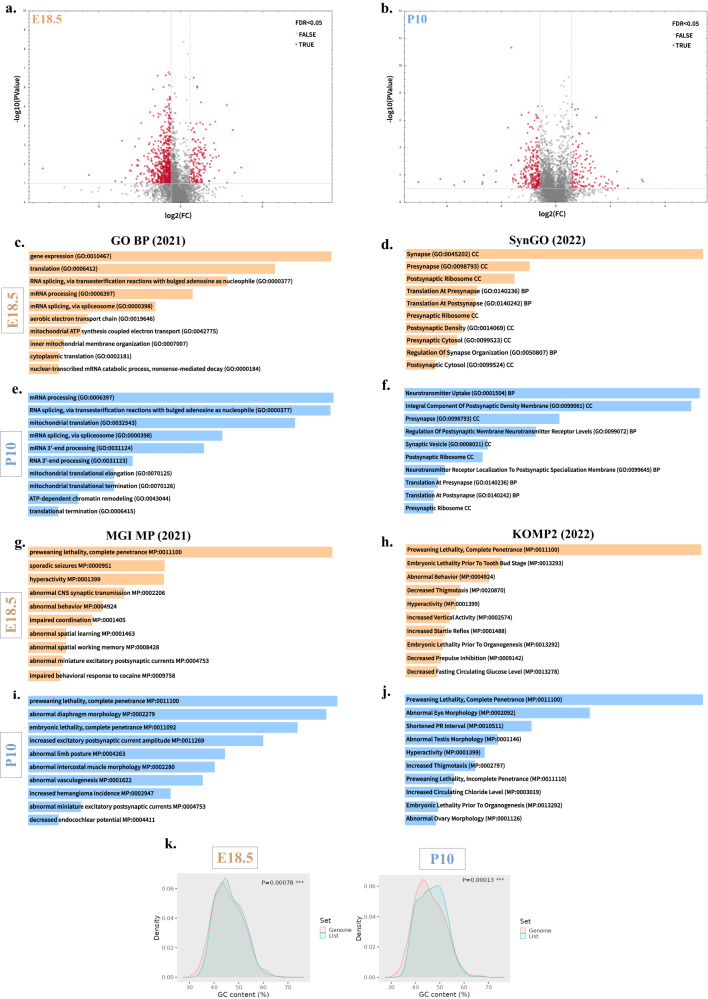
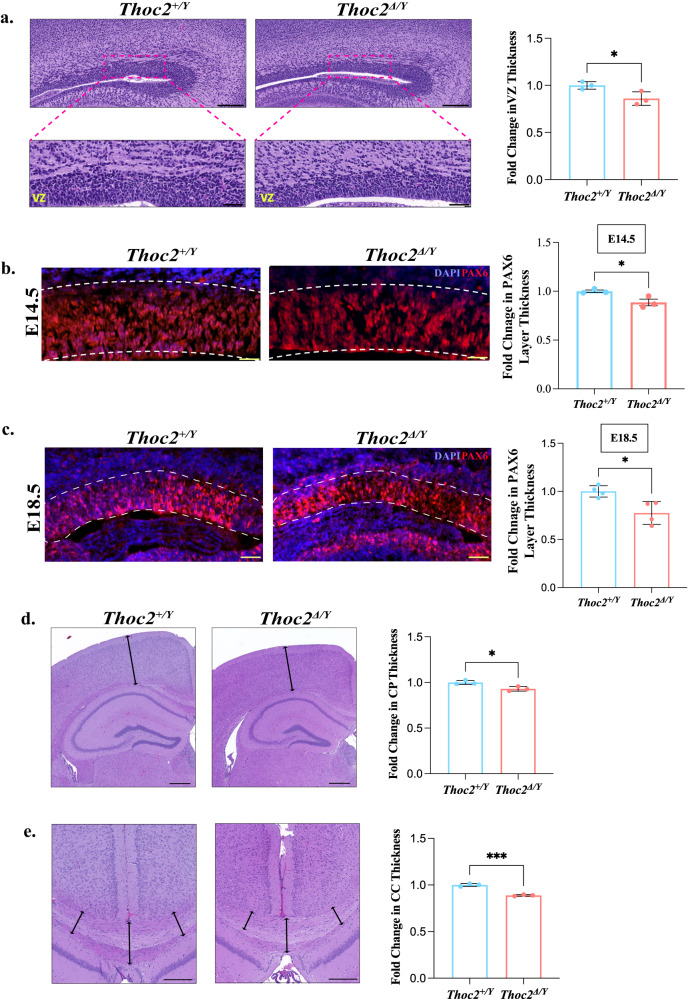
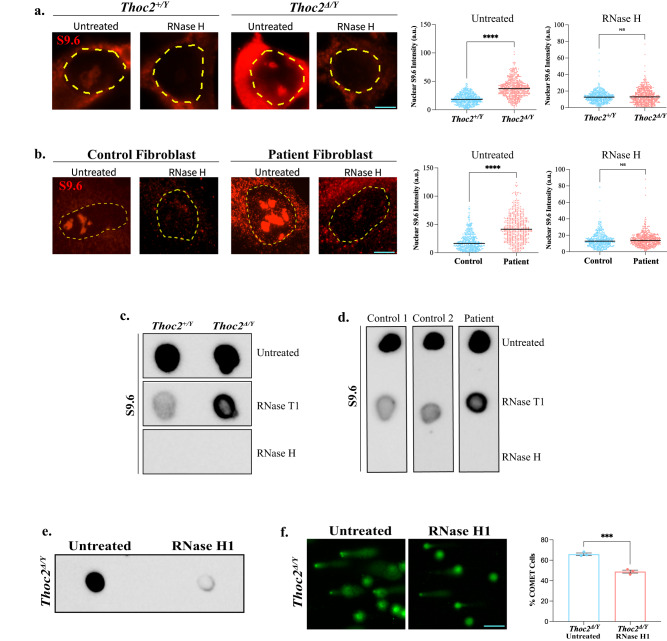
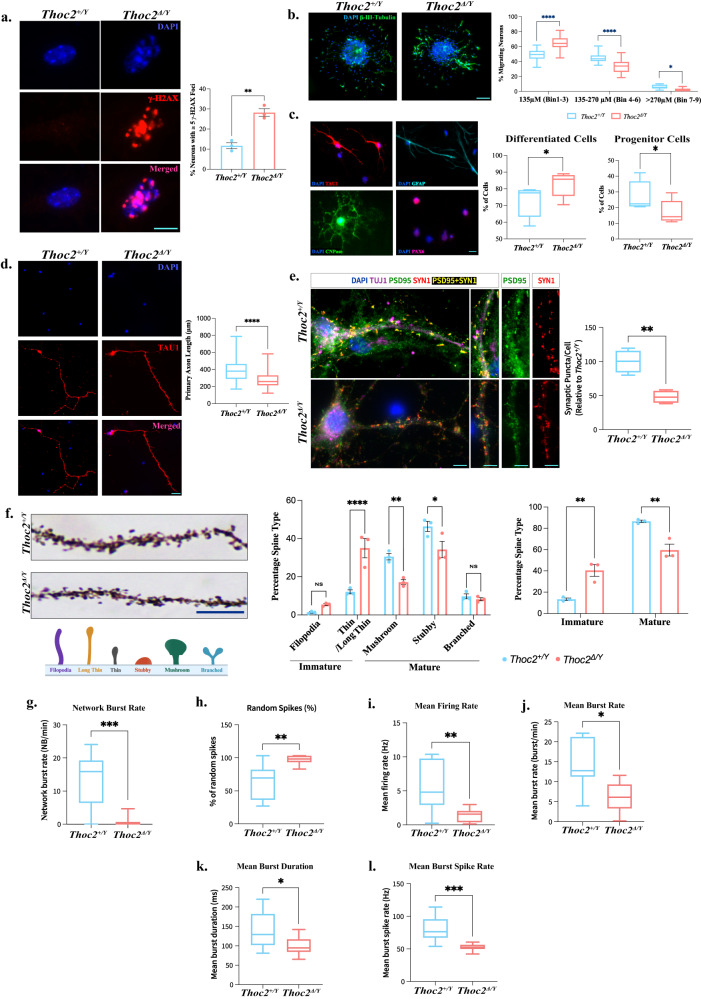
We implicated the X-chromosome THOC2 gene, which encodes the largest subunit of the highly-conserved TREX (Transcription-Export) complex, in a clinically complex neurodevelopmental disorder with intellectual disability as the core phenotype. To study the molecular pathology of this essential eukaryotic gene, we generated a mouse model based on a hypomorphic Thoc2 exon 37-38 deletion variant of a patient with ID, speech delay, hypotonia, and microcephaly. The Thoc2 exon 37-38 deletion male (Thoc2Δ/Y) mice recapitulate the core phenotypes of THOC2 syndrome including smaller size and weight, and significant deficits in spatial learning, working memory and sensorimotor functions. The Thoc2Δ/Y mouse brain development is significantly impacted by compromised THOC2/TREX function resulting in R-loop accumulation, DNA damage and consequent cell death. Overall, we suggest that perturbed R-loop homeostasis, in stem cells and/or differentiated cells in mice and the patient, and DNA damage-associated functional alterations are at the root of THOC2 syndrome.


Conflict of interest statement

The authors declare no competing interests.

Figures

Fig. 1
Fig. 1. Generation of Thoc2 exon 37-38 deletion mouse model.
a Schematic diagram of CRISPR/Cas9 gene editing strategy for deleting exon 37 and 38 of the mouse Thoc2 gene. b Reverse transcription-PCR DNA of Thoc2+/Y (419 bp) and Thoc2Δ/Y (296 bp) brain RNAs (left panel) with representative image of Sanger sequencing traces (right panel) showing deletion of exon 37-38 coding sequence in the Thoc2Δ/Y mRNA. Black line indicates that the lanes between the marker and PCR samples were deleted to generate this figure (n = 4 independent experiments). c Western blot showing THOC2 protein in Thoc2+/Y and Thoc2Δ/Y mouse brains. The schematic shows binding location of the two antibodies. β-Tubulin was used as loading control. Quantification of THOC2 protein levels in Thoc2+/Y and Thoc2Δ/Y mouse brains are also shown (n = 4 experiments); ****p = 0.00004; two-tailed unpaired student’s t test. d Pie chart showing the percentage of different genotypes born in the Thoc2 mouse colony. Observed and expected number of Thoc2+/Y and Thoc2Δ/Y mice born in the colony based on the monogenic pattern of Mendelian inheritance. ****p < 0.0001; χ2 test. e Pie chart showing the percentage of different genotypes among the blastocysts analysed. Observed and expected number of Thoc2+/Y and Thoc2Δ/Y blastocysts are graphed. **p = 0.0081; χ2 test. A schematic presentation of the in vitro fertilization experimental approach is shown. f Western blot and a graph showing THOC2 protein in Thoc2+/Y and Thoc2Δ/Y mouse brains at different embryonic (E14.5, E18.5) and post-natal (P0, P10, P30, P60) stages. β-Actin was used as loading control. THOC2 protein levels normalized to β-Actin were graphed (n = 3 independent experiments). g Thoc2+/Y and Thoc2Δ/Y E14.5 and E18.5 embryos (n = 5 embryos per genotype, per embryonic stage) and h Thoc2+/Y and Thoc2Δ/Y adult mice (n = 50 Thoc2+/Y and n = 42 Thoc2Δ/Y mice); ****p < 0.0001; two-way ANOVA, Bonferroni’s multiple comparison test. All the data (except for d, e) presented are mean values ± SEM. Source data are provided as a Source Data file. Schematics in figures a, c, e were created with BioRender.com.
Fig. 2
Fig. 2. Thoc2Δ/Y mice display multiple neurobehavioral deficits.
a Morris Water Maze test for measuring spatial learning and reference memory. Graphs showing latency to find escape platform over 5 days of learning trial (left) and the time taken to find the escape platform on the probe day (right); **p = 0.0050; ***p = 0.0003. b Barnes Maze test for assessing learning and memory function. Graphs showing latency to escape into the box over three days of trial (left) and time taken to escape into the box on the probe day (right) (n = 13 mice per genotype); *p = 0.02. For a, b two-way ANOVA, Bonferroni’s multiple comparison test on the trial day graphs and two-tailed unpaired student’s t test on probe day graphs. c Y-Maze spontaneous alteration test for assessing working memory. Graphs showing percentage of alterations between novel arm and previously visited arm, total number of arm entries and total number of alterations; *p = 0.047; unpaired two-tailed student’s t test. d Open Field test assessing the general locomotor activity. Graphs showing time spent in different zones of the field (left) and total distance travelled in cm (right); two-way ANOVA, Bonferroni’s multiple comparison test and **p = 0.006; two-tailed unpaired student’s t test. e Beam walking test for assessing fine motor co-ordination. Graphs showing time taken by the mice to cross the beam (left) and number of foot slips (right); ****p < 0.0001. f Pasta handling task to assess fine motor-control. Graphs showing time taken to consume one pasta (upper left), number of times pasta has been dropped while eating (upper right), number of times mice adjusted their grip of the pasta (lower left) and number of atypical behaviours (lower right); ***p = 0.0004. g Adhesive removal test for assessing sensorimotor function. Graphs showing time taken by mice to contact the adhesive attached to its paw (upper) and to remove the adhesive from paw after contacting it (lower); *p = 0.012. For eg unpaired two-tailed student’s t test. Except b, all experiments were performed with n = 14 mice per genotype and the data presented are mean values ± SEM. NS non-significant. Source data are provided as a Source Data file. Schematics in figures ag were created with BioRender.com.
Fig. 3
Fig. 3. Thoc2Δ/Y embryonic and adult mice brains show significantly dysregulated transcriptome.
Volcano plots showing up and downregulated genes in embryonic (E14.5) (a), (E18.5) (b) and post-natal day 10 (P10) (c) Thoc2Δ/Y brains with cut-off p-value < 0.01 (Quasi-likelihood F-test, two sided). GO BP enrichment analyses shown as ReviGO plots for significant DEGs in E14.5 (d), E18.5 (e), and P10 (f) Thoc2Δ/Y mice brains (Fisher’s one-tailed hypergeometric tests with Bonferroni correction). g, ShinyGO graphs showing comparison of percentage GC content between mouse genome and DEGs from E14.5 (left), E18.5 (middle) and P10 (right) Thoc2Δ/Y mice brains (one-sided hypergeometric test for false discovery rate). GO gene ontology, BP biological process, DEG differentially expressed genes. Source data are provided as a Source Data file.
Fig. 4
Fig. 4. Thoc2Δ/Y embryonic and adult mice brains show significantly dysregulated proteome.
Volcano plots showing up- and downregulated proteins in a, embryonic (E18.5) and b, post-natal day 10 (P10) Thoc2Δ/Y mice brains (Unpaired Student’s t test (two-tailed) for testing differential abundance). The up- and down-regulated proteins have FC > 1.5, and FDR of <0.05 cutoff. GO enrichment analyses of significantly dysregulated proteins in E18.5 (c, d) and P10 (e, f) Thoc2Δ/Y mice brains performed using Enrichr web-tool. Ontological enrichment analysis using MGI and KOMP2 mouse phenotype databases for significantly dysregulated proteins in E18.5 (g, h) and P10 (i, j) Thoc2Δ/Y mice brains using Enrichr web-tool. For cj The top 10 enriched GO terms are shown. The length of the horizontal axis represents the enrichment p value for the functional clustering. k ShinyGO graphs showing comparison of percentage GC content between mouse genome and genes associated with the significantly dysregulated proteins in E18.5 and P10 Thoc2Δ/Y mice brains (One-sided hypergeometric test for false discovery rate). FC Fold Change, FDR False Discovery Rate, GO Gene Ontology, BP Biological Process, SynGO Synaptic Gene Ontology, MGI Mouse Genome Informatics, MP Mammalian Phenotype, KOMP2 Knockout Mouse Phenotyping Program 2. Source data are provided as a Source Data file.
Fig. 5
Fig. 5. Altered cytoarchitecture in Thoc2Δ/Y mouse brain.
a H&E staining of E18.5 embryonic brain coronal sections. The boxed VZ area is shown in a magnified view in the lower panel. VZ: Ventricular Zone. Scale bar: upper panels, 200 µm; lower panels, 50 µm. Graph showing quantitative measurement of VZ thickness. Thoc2+/Y to Thoc2Δ/Y fold change is plotted from mean values ± SEM (n = 3 embryos per genotype); *p = 0.04. Immunofluorescent staining for PAX6 in E14.5 (n = 3) (b) and E18.5 (n = 4) (c) embryonic brain coronal sections. VZ is marked with white dotted lines. Scale Bar: b 50 µm; c 200 µm. Graph showing quantitative measurement of VZ region as PAX6+ layer thickness. Thoc2+/Y to Thoc2Δ/Y fold change plotted from mean values ± SEM; *p = 0.03 (b) and 0.02 (c). d Representative images of H&E staining of adult (30 days) mouse brain coronal sections used for cortical plate (CP) thickness measurement. Scale Bar: 250 µm. Graphs showing quantitative measurement of CP thickness. Thoc2+/Y to Thoc2Δ/Y fold change plotted using mean values ± SEM (n = 3 mice per genotype); *p = 0.022. e Representative images of H&E staining of adult (30 days) mouse brain coronal sections used for measurement of corpus callosum (CC) thickness at hippocampal level. Scale Bar: 100 µm. Graph showing quantitative measurement of CC thickness. Thoc2+/Y to Thoc2Δ/Y fold change plotted using mean values ± SEM (n = 3 mice per genotype); ***p = 0.0003. Two-tailed unpaired student’s t tests were used in all figures. Source data are provided as a Source Data file.
Fig. 6
Fig. 6. Perturbed cell cycle kinetics, increased cell death and elevated levels of DNA damage in Thoc2Δ/Y mice.
a Representative flow cytometry plots showing gating for Hoechst-stained NSCs at different stages of cell cycle. Graph showing percentage of cells at different stages of cell cycle; n = 5 embryos per genotype and 3 independent experiments; ****p < 0.0001; two-way ANOVA, Bonferroni’s multiple comparison test. b Representative images of TUNEL-stained nuclei (cells stained green). Scale Bar 100 µm. Quantification of TUNEL positive cells between Thoc2Δ/Y (n = 6) and Thoc2+/Y (n = 5) NSCs; **p = 0.0011; two-tailed unpaired student’s t test. c Representative scatter plots showing gating for Annexin V positive and negative NSCs. Graph showing percentage of viable (Annexin V−) and apoptotic (Annexin V+) cells; n = 4 embryos per genotype and 3 independent experiments; ***p = 0.0001; two-way ANOVA, Bonferroni’s multiple comparison test. d Representative western blot showing γ-H2AX and H2AX proteins in Thoc2Δ/Y and Thoc2+/Y NSCs. β-Tubulin was used as loading control. Graph showing γ-H2AX and H2AX levels relative to housekeeping β-Tubulin protein quantified from the western blots; n = 3 embryos per genotype; NS non-significant; ***p = 0.0006; two-way ANOVA, Bonferroni’s multiple comparison test. e, Representative images of alkaline comet assay of Thoc2+/Y and Thoc2Δ/Y NSCs. Box plot showing comet tail moment quantified from Thoc2+/Y and Thoc2Δ/Y NSCs (Scale Bar 50 µm); n = 4 embryos per genotype; ****p = 0.000003; two-tailed unpaired student’s t test. f Western blot showing γ-H2AX and H2AX proteins in Thoc2+/Y and Thoc2Δ/Y embryonic brain (E14.5 and E18.5). β-Tubulin was used as loading control. Graph showing γ-H2AX and H2AX levels relative to housekeeping β-Tubulin protein from western blots; n = 2 embryos and 3 independent experiments); **p = 0.004; *P = 0.046; two-way ANOVA, Bonferroni’s multiple comparison test. g, Representative images of alkaline comet assay on control fibroblast and THOC2 exon 37-38 deletion patient fibroblasts (Scale Bar 50 µm). Box plot showing comet tail moment quantified from control and THOC2 exon 37-38 deletion patient fibroblasts; n = 3 independent experiments; ****p < 0.0001; two-tailed unpaired student’s t test. All the data presented are mean values ± SEM. Source data are provided as a Source Data file.
Fig. 7
Fig. 7. R-loop accumulation and DNA damage in Thoc2Δ/Y NSCs and THOC2 ex37- 38 deletion patient fibroblasts.
Representative immunofluorescent images of untreated or RNase H treated Thoc2+/Y and Thoc2Δ/Y NSCs (a) and control and THOC2 exon 37-38 deletion patient fibroblasts (b) stained with anti-RNA:DNA Hybrid S9.6 antibody (Sigma, MABE1095). Scatter plot showing quantitative measurement of mean nuclear S9.6 fluorescence intensity using Fiji software (at least 300 cells scored per condition over 4 independent experiments); NS non-significant; ****p < 0.0001; MannWhitney U test with the black line indicating median value. a.u, arbitrary units. Scale Bar 5 µm. c Representative images of dot blot assays performed on gDNA from untreated or RNase T1/H treated Thoc2+/Y and Thoc2Δ/Y NSCs using anti-RNA:DNA Hybrid S9.6 antibody; n = 4 donor embryos per genotype for NSCs. d Representative images of dot blot assays performed on gDNA of untreated or RNase T1/H treated control and THOC2 ex37-38 deletion patient fibroblasts using anti-RNA:DNA Hybrid S9.6 antibody; n = 3 independent experiments for control and patient fibroblasts. Representative image of e, dot blot assay and f, alkaline comet assay, performed on untreated and RNase H1 lentivirus transduced Thoc2Δ/Y NSCs (Scale Bar 100 µm). n = 2 embryos and 3 independent experiments. Percentage of cells showing comet tail were quantified for f; ***p = 0.0009; two-tailed unpaired student’s t test. Data presented are mean values ± SEM. Source data are provided as a Source Data file.
Fig. 8
Fig. 8. Structural and functional impairments in Thoc2Δ/Y neurons.
Representative immunofluorescent images of a nuclei of Thoc2+/Y and Thoc2Δ/Y primary neurons stained with DNA damage marker, γ-H2AX (red) at day in vitro 14 in cultures. Graph showing number of neurons with ≥5 γ-H2AX nuclear foci; n = 3 embryos per genotype; **p = 0.0023. b Neuronal migration from adhered neurospheres from Thoc2+/Y and Thoc2Δ/Y E18.5 embryonic brains. Neurons were stained using anti-βIII-tubulin antibody (green) and the nuclei with DAPI (blue). Scale Bar: 100 μm; n = 4 embryos per genotype; at-least 20 neurospheres scored per replicate; *p = 0.032; ****p < 0.0001. c Different cell types (stained with cell specific markers) after 72 h of differentiation in vitro from Thoc2+/Y NSCs are shown. Scale Bar: 50 μm. Percentage of progenitor cells and additive differentiated cells were shown in box plots (n = 4 embryos per genotype; at-least 120 cells counted per replicate); *p = 0.04. d Thoc2+/Y and Thoc2Δ/Y primary neurons stained with an axonal marker TAU1 (red). Scale Bar: 20 μm. Box plots shows primary axon length; n = 4 embryos per genotype; ****p < 0.0001. e Thoc2+/Y and Thoc2Δ/Y primary neurons stained with neural βIII-tubulin (purple), postsynaptic PSD95 (green), and presynaptic SYN1(red) markers. PSD95_SYN1 colocalized synaptic puncta are in yellow. Scale Bar: 20 µm. Box plot showing number of excitatory synaptic puncta per neuron; n = 4 embryos per genotype; at-least 15 neurons scored per replicate; **p = 0.0033; ae two-tailed unpaired student’s t test, data presented as mean values ± SEM. f Left panel: representative images of dendrites from Golgi-Cox stained Thoc2+/Y and Thoc2Δ/Y mice brains (age 30 day) and a schematic diagram showing the different types of spines. Scale Bar: 5 µm. Right panel: graphs showing quantification of different spine types and overall mature and immature spines between Thoc2+/Y and Thoc2Δ/Y mice; n = 3 mice per genotype; Total 1852 spines for Thoc2+/Y and 2055 spines for Thoc2Δ/Y mice were analysed; *p = 0.011; **p = 0.0046; ****P = 0.000008; ns: not significant; two-way ANOVA, Bonferroni’s multiple comparison test. Quantitative measurement of g, network burst rate (***p = 0.0005) and h, percentage of random spikes (**p = 0.0023) and il, other neural network parameters; *p = 0.01; **p = 0.002; ***p = 0.0006. gl, n = 4 embryos per genotype; Kolmogorov–Smirnov test. Source data are provided as a Source Data file. Schematic in f was created with BioRender.com.
Fig. 9
Fig. 9. Summary of the key results of studies presented here.
Schematic showing major molecular, cellular, and phenotypic consequences of Thoc2 exon 37-38 deletion in the Thoc2Δ/Y mice. The figure was created with BioRender.com.

References

    1. Amberger JS, Bocchini CA, Schiettecatte F, Scott AF, Hamosh A. OMIM.org: online mendelian inheritance in man (OMIM(R)), an online catalog of human genes and genetic disorders. Nucleic Acids Res. 2015;43:D789–D798. doi: 10.1093/nar/gku1205. - DOI - PMC - PubMed
    1. Ozlu C, Bailey RM, Sinnett S, Goodspeed KD. Gene transfer therapy for neurodevelopmental disorders. Dev. Neurosci. 2021;43:230–240. doi: 10.1159/000515434. - DOI - PubMed
    1. Kumar R, et al. THOC2 mutations implicate mRNA-export pathway in X-linked intellectual disability. Am. J. Hum. Genet. 2015;97:302–310. doi: 10.1016/j.ajhg.2015.05.021. - DOI - PMC - PubMed
    1. Kumar R, et al. Severe neurocognitive and growth disorders due to variation in THOC2, an essential component of nuclear mRNA export machinery. Hum. Mutat. 2018;39:1126–1138. doi: 10.1002/humu.23557. - DOI - PMC - PubMed
    1. Kumar R, et al. Expanding clinical presentations due to variations in THOC2 mRNA nuclear export factor. Front. Mol. Neurosci. 2020;13:12. doi: 10.3389/fnmol.2020.00012. - DOI - PMC - PubMed