. 2024 Feb 8;15(1):1203.
doi: 10.1038/s41467-024-45350-8.

Targeting DNA2 overcomes metabolic reprogramming in multiple myeloma

Affiliations

Targeting DNA2 overcomes metabolic reprogramming in multiple myeloma

Natthakan Thongon et al. Nat Commun. .

Abstract

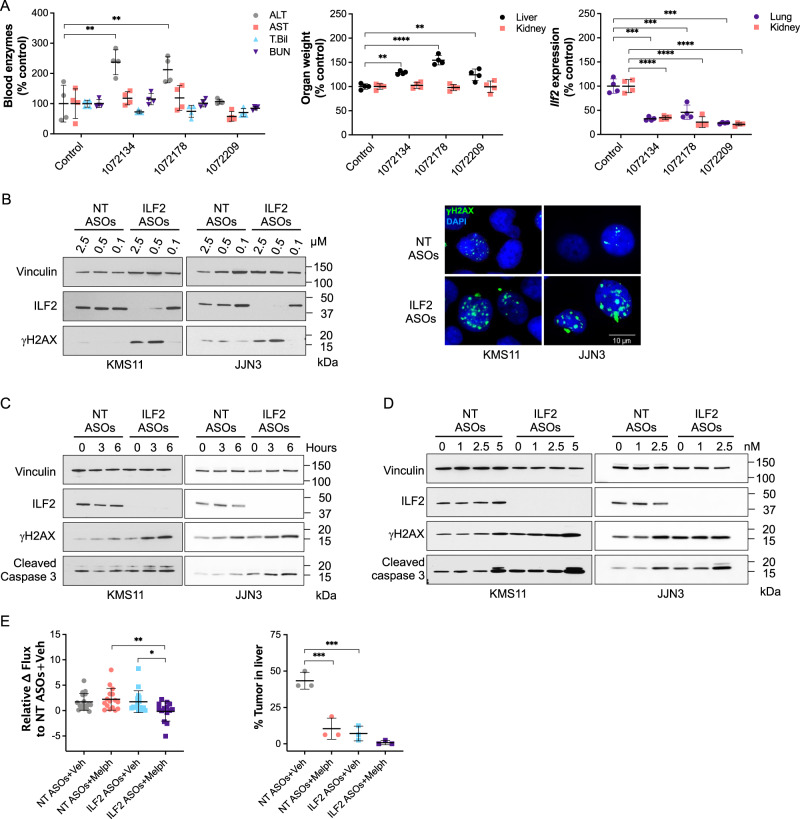
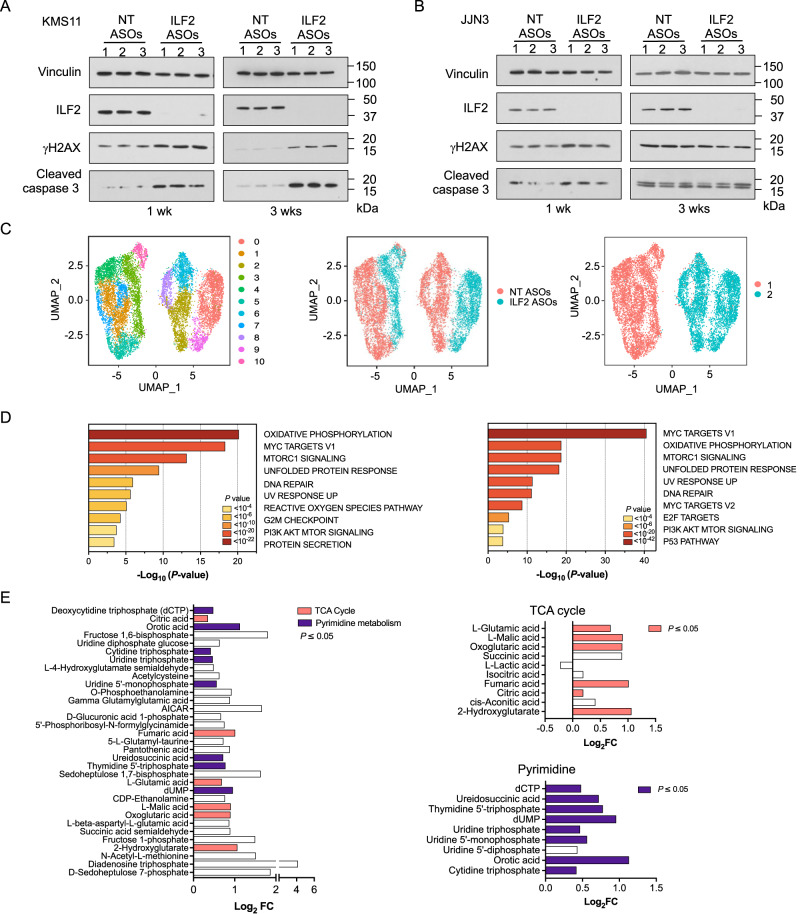
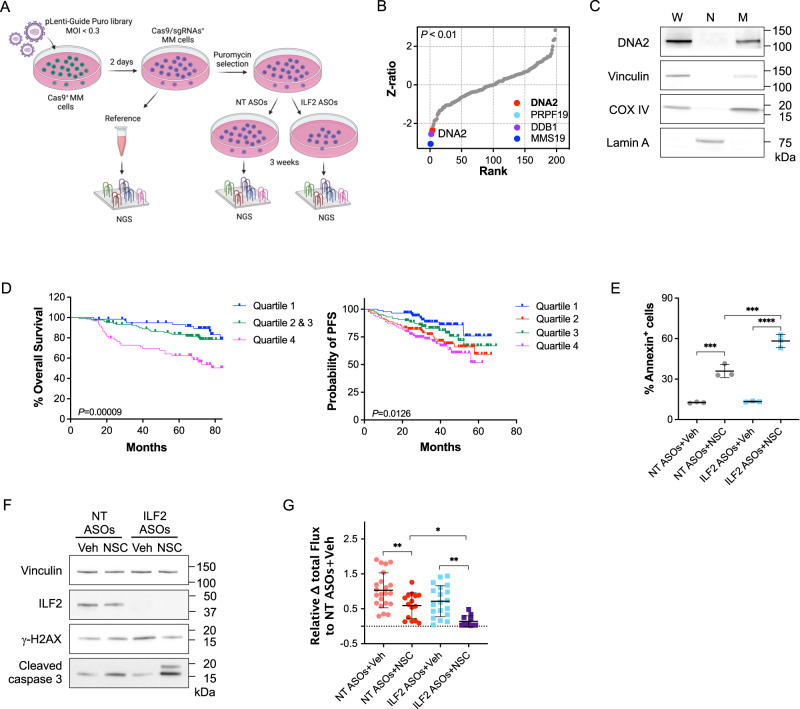
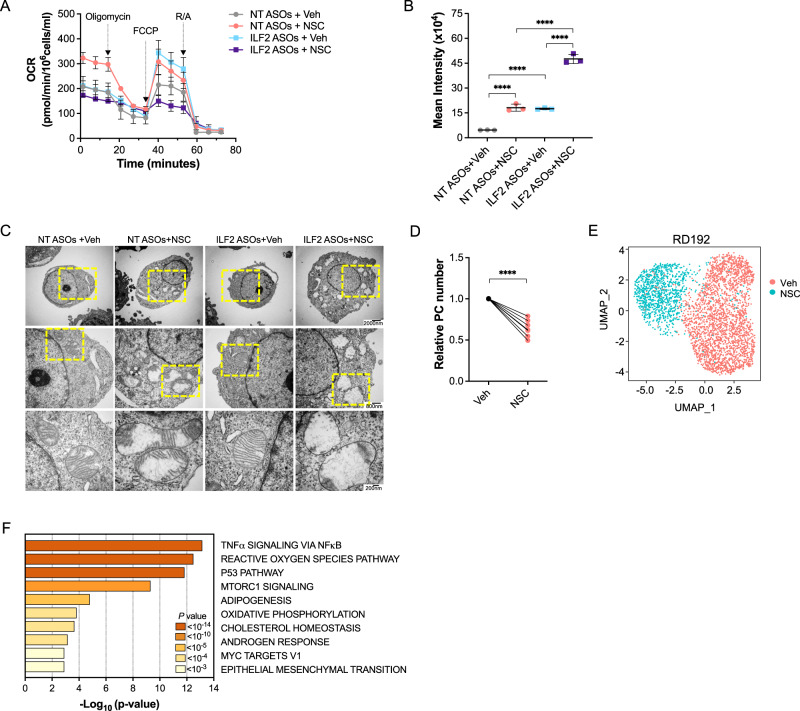
DNA damage resistance is a major barrier to effective DNA-damaging therapy in multiple myeloma (MM). To discover mechanisms through which MM cells overcome DNA damage, we investigate how MM cells become resistant to antisense oligonucleotide (ASO) therapy targeting Interleukin enhancer binding factor 2 (ILF2), a DNA damage regulator that is overexpressed in 70% of MM patients whose disease has progressed after standard therapies have failed. Here, we show that MM cells undergo adaptive metabolic rewiring to restore energy balance and promote survival in response to DNA damage activation. Using a CRISPR/Cas9 screening strategy, we identify the mitochondrial DNA repair protein DNA2, whose loss of function suppresses MM cells' ability to overcome ILF2 ASO-induced DNA damage, as being essential to counteracting oxidative DNA damage. Our study reveals a mechanism of vulnerability of MM cells that have an increased demand for mitochondrial metabolism upon DNA damage activation.


Conflict of interest statement

The authors declare no competing interests.

Figures

Fig. 1
Fig. 1. ILF2 ASOs induce DNA damage activation and enhance MM cells’ sensitivity to DNA-damaging agents.
A Left, levels of alanine aminotransaminase (ALT), aspartate aminotransaminase (AST), total bilirubin (T. Bil), and blood urea nitrogen (BUN) in the peripheral blood of Balb/c mice treated with phosphate-buffered saline (control; n = 4) or one of 3 different ASOs targeting Ilf2 (n = 4 per each ASO). **P < 0.01; control vs 1072134: P = 0.0018; control vs 1072178: P = 0.0078. Middle, relative weights of the liver and kidneys in each mouse. ****P < 0.0001; **P < 0.01; control vs 1072178: P < 0.0001; control vs 1072134: P = 0.0011; control vs 1072209: P = 0.004. Right, relative Ilf2 expression in the kidneys and lungs of the mice. Statistically significant differences were detected using one-way ANOVA (****P < 0.0001; ***P < 0.001). The mean ± S.D. is shown. B Left, Western blot analysis of ILF2 and γH2AX in KMS11 (left) and JJN3 (right) cells treated with NT or ILF2 ASOs at the indicated concentrations for 1 week. Vinculin was used as the loading control. Right, anti-γH2AX immunofluorescence in KMS11 (left) and JJN3 (right) cells treated with NT or ILF2 ASOs (0.5 and 1 μM, respectively) for 1 week. Green indicates γH2AX; blue, DAPI. Scale bars represent 10 μm. Two biological replicates were performed. C Western blot analysis of ILF2, γH2AX, and cleaved caspase 3 in KMS11 (left) and JJN3 (right) cells treated with NT or ILF2 ASOs (0.5 and 1 μM, respectively) for 1 week prior to exposure to 10 μM melphalan for 0, 3, and 6 h. Vinculin was used as the loading control. Two biological replicates were performed. D Western blot analysis of ILF2, γH2AX, and cleaved caspase 3 in KMS11 (left) and JJN3 (right) cells treated with NT or ILF2 ASOs (0.5 and 1 μM, respectively) for 1 week prior to receiving bortezomib for 48 h at the indicated concentrations. Vinculin was used as a loading control. Three biological replicates were performed. E Left, differences in the luciferase signal in NSG mice engrafted with GFP+Luc+ KMS11 cells after receiving NT or ILF2 ASOs for 1 week and NT or ILF2 ASOs with vehicle (Veh) or in combination with melphalan (Melph) every other day for 5 more days. Data are expressed as the mean bioluminescence activity relative to that of the NT ASOs+Veh group from each mouse [Δ flux of luciferase signal (photons/second, p/s)] ±S.D. (NT ASOs+Veh, n = 17; NT ASOs+Melph, n = 16; ILF2 ASOs+Veh, n = 16; ILF2 ASOs+Melph; n = 14 from 2 independent experiments). Statistically significant differences were detected by one-way ANOVA (**P < 0.01; *P < 0.05; NT ASOs+Melph vs ILF2 ASOs+Melph: P = 0.0072; ILF2 ASOs+Veh vs ILF2 ASOs+Melph: P = 0.0465). Right, tumor burden in the liver of the xenografts at day 12 of treatment. Data are expressed as percentages calculated by dividing the tumor area by the total area of the liver. The mean ± S.D. for 3 representative mice per group are shown. Statistically significant differences were detected by one-way ANOVA (***P < 0.001; NT ASOs+Veh vs NT ASOs+Melph: P = 0.0003; NT ASOs+Veh vs ILF2 ASOs+Veh: P = 0.0001). Source data are provided as a Source Data file.
Fig. 2
Fig. 2. Metabolic reprogramming mediates MM cells’ resistance to DNA damage activation.
A Western blot analysis of ILF2, γH2AX, and cleaved caspase 3 in KMS11 cells treated with NT or ILF2 ASOs (0.5 μM) for 1 week (wk; left) or 3 weeks (right). Vinculin was used as a loading control. Every experiment was performed in triplicate (1–3). B Western blot analysis of ILF2, γH2AX, and cleaved caspase 3 in JJN3 cells treated with NT or ILF2 ASOs (1 μM) for 1 week (wk; left) or 3 weeks (right). Vinculin was used as a loading control. Every experiment was performed in triplicate (1–3). C Uniform manifold approximation and projection (UMAP) of scRNA-seq data displaying pooled (n = 2 independent experiments) single JJN3 cells after 3 weeks of NT ASO (n = 7041 cells) or ILF2 ASO (n = 4462 cells) treatment. Different colors represent the cluster (left), sample origin (middle) and the 2 identities of the main clusters (right). Cluster 10 which included basal apoptotic cells was removed from the pathway enrichment analysis shown in Fig. 2D. D Pathway enrichment analysis of the significantly upregulated genes in ILF2 ASO–treated cells compared with NT ASO–treated cells in the major clusters 1 (left) and 2 (right) shown in Fig. 2C (adjusted P ≤ 0.05). The top 10 Reactome gene sets are shown. E Log2 fold change (FC) of all significant metabolites that were significantly enriched in JJN3 cells treated with ILF2 ASOs for 3 weeks compared with cells treated with NT ASOs (left). The significant metabolites in the tricarboxylic acid cycle pathway (top right, P = 0.016), and the pyrimidine pathway (bottom right, P < 0.001) are highlighted in pink and violet, respectively (right) (n = 2 independent replicates per group; adjusted P ≤ 0.05). A detailed description of the statistical analysis is included in “Methods” section. Source data are provided as a Source Data file.
Fig. 3
Fig. 3. DNA2 is essential for maintaining MM cells’ survival after DNA damage–induced metabolic reprogramming.
A Schematic of the CRISPR/Cas9 screening. Stable Cas9+ JJN3 or Cas9+ KMS11 cells were transduced with a library of pooled sgRNAs targeting 196 genes involved in several DNA repair pathways. A portion of cells was collected as a reference sample after 48 h of transduction. Cells were continuously cultured under puromycin selection and treated with NT or ILF2 ASOs for 3 weeks. ILF2 sensitizer genes were identified using deep sequencing of the sgRNA barcodes and the drugZ algorithm to assess differences in the representation of all sgRNAs between NT ASO– and ILF2 ASO–treated cells across the 3 independent sets of experiments. MOI, multiplicity of infection; NGS, next-generation sequencing. B Ranking of the DNA repair genes whose sgRNAs were significantly depleted in ILF2 ASO–treated JJN3 cells as compared with NT ASO–treated cells. The inset shows genes on the top ranks (adjusted P < 0.01); DNA2; P = 0.00931. C Western blot analysis of DNA2 in whole-cell lysates (W), nuclei (N), and mitochondria (M) isolated from JJN3 cells. Vinculin, Lamin A, and COX IV were used as the loading controls for W, N, and M, respectively. Two biological replicates were performed. D Left, Kaplan–Meier plots for overall survival according to DNA2 expression in MM PCs as evaluated by RNA-Seq analysis. Shown are the median overall survival durations of patients who were enrolled in clinical trials of velcade in combination with revlimid and dexamethasone followed by autologous transplantation (n = 41; log-rank P = 8.758 × 10–5). Right, Kaplan–Meier plots of progression-free survival (PFS) according to DNA2 expression in MM PCs as evaluated by microarray analysis. Shown are the median PFS durations of patients who were enrolled in the Arkansas Total Therapy 2 and 3 trials and received high-dose chemotherapy followed by autologous transplantation (n = 351; P = 0.0126). A detailed description of the statistical analysis is included in “Methods” section. E Frequencies of apoptotic (annexin V-positive) JJN3 cells after 3 weeks of exposure to NT or ILF2 ASOs (1 μM) followed by 48 h of treatment with vehicle (Veh) or 2 μM NSC. Data are expressed as the mean ± S.D. from one representative experiment performed in triplicate. Statistically significant differences were detected using two-way ANOVA (****P < 0.0001; ***P < 0.001; NT ASOs+Veh vs NT ASOs+NSC: P = 0.0002; NT ASOs+NSC vs ILF2 ASOs+NSC: P = 0.0003; ILF2 ASOs+Veh vs ILF2 ASOs+NSC: P < 0.0001). F Western blot analysis of ILF2, γH2AX, and cleaved caspase 3 in JJN3 cells treated with NT or ILF2 ASOs (1 μM) for 3 weeks prior to receiving NT or ILF2 ASOs alone (Veh) or in combination with 1 μM NSC for 48 h. Vinculin was used as a loading control. G Differences in the luciferase signal in NSG mice engrafted with ILF2 ASO–resistant GFP+Luc+ JJN3 cells after receiving NT or ILF2 ASOs alone (NT or ILF2+Veh) or in combination with NSC every day for 7 days. Data are expressed as the mean bioluminescence activity relative to that of the NT ASOs+Veh group [Δ flux of luciferase signal (photons/second, p/s] ± S.D). For each mouse (NT ASOs+Veh, n = 22; NT ASOs+NSC, n = 15; ILF2 ASOs+Veh, n = 19; ILF2 ASOs+NSC, n = 11; n = 3 independent experiments). Statistically significant differences were detected using one-way ANOVA (**P < 0.01; *P < 0.05; NT ASOs+Veh vs NT ASOs+NSC: P = 0.0098; NT ASOs+NSC vs ILF2 ASOs+NSC: P = 0.0328; ILF2 ASOs+Veh vs ILF2 ASOs+NSC: P = 0.0021). Source data are provided as a Source Data file.
Fig. 4
Fig. 4. DNA2 is essential for activated OXPHOS in MM cells.
A Oxygen consumption rates (OCRs) in JJN3 cells treated with NT or ILF2 ASOs (1 µM) for 3 weeks prior to receiving ASOs alone or in combination with 1 µM NSC for 72 h. Each data point is the mean ± S.D. of replicates (NT ASOs+Veh, n = 5; NT ASOs+NSC, n = 5; ILF2 ASOs+Veh, n = 4; ILF2 ASOs+NSC, n = 5). FCCP, carbonyl cyanide-p-trifluoromethoxy-phenylhydrazone; R/A, rotenone/antimycin; Veh, vehicle. Data are expressed as the mean ± S.D. from one representative experiment. Experiments were performed in biological duplicates. B ROS production in JJN3 cells treated with NT or ILF2 ASOs (1 μM) for 3 weeks prior to receiving 1 µM NSC for 48 h. Data are expressed as the mean ± S.D. from one representative experiment performed in triplicate. Statistically significant differences were detected using two-way ANOVA (****P < 0.0001; NT ASOs+Veh vs NT ASOs+NSC: P < 0.0001; NT ASOs+Veh vs ILF2 ASOs+Veh: P < 0.0001; NT ASOs+NSC vs ILF2 ASOs+NSC: P < 0.0001; ILF2 ASOs+Veh vs ILF2 ASOs+NSC: P < 0.0001). C Representative transmission electron micrographs showing the mitochondrial ultrastructure of JJN3 cells treated with NT or ILF2 ASOs (1 μM) for 3 weeks prior to receiving 1 µM NSC for 48 h. Scale bars: 7500X, 2000 nm (top); 20,000X, 800 nm (middle); 50,000X, 200 nm (bottom). D Numbers of live PCs isolated from the BM of MM patients with PI-based therapy failure (n = 7) after treatment with vehicle (Veh) or 2 µM NSC for 48 h over a layer of mesenchymal cells. Data were normalized to each sample’s vehicle (Veh)-treated control. Statistical significance was calculated using a paired 2-tailed Student t test (****P < 0.0001). E UMAP of scRNA-seq data displaying PCs from one MM patient (RD192) with 1q21 amplification, whose disease failed PI-based therapy. Cells were treated for 48 h with vehicle (Veh) or 2 µM NSC over a layer of mesenchymal cells. Different colors represent the sample origins. F Pathway enrichment analysis of genes that were significantly upregulated in all 3 NSC-treated MM PC samples shown in Fig. 4E, and Supplementary Fig. 4I, J compared with those treated with vehicle (Veh). The top 10 Hallmark gene sets are shown. Source data are provided as a Source Data file.

Update of

References

    1. Shapiro YN, et al. Lifestyle considerations in multiple myeloma. Blood Cancer J. 2021;11:172. doi: 10.1038/s41408-021-00560-x. - DOI - PMC - PubMed
    1. Goldman-Mazur S, Kumar SK. Current approaches to management of high-risk multiple myeloma. Am. J. Hematol. 2021;96:854–871. doi: 10.1002/ajh.26161. - DOI - PubMed
    1. Pawlyn C, Morgan GJ. Evolutionary biology of high-risk multiple myeloma. Nat. Rev. Cancer. 2017;17:543–556. doi: 10.1038/nrc.2017.63. - DOI - PubMed
    1. Kumar SK, et al. Risk of progression and survival in multiple myeloma relapsing after therapy with IMiDs and bortezomib: a multicenter international myeloma working group study. Leukemia. 2012;26:149–157. doi: 10.1038/leu.2011.196. - DOI - PMC - PubMed
    1. Shah V, et al. Prediction of outcome in newly diagnosed myeloma: a meta-analysis of the molecular profiles of 1905 trial patients. Leukemia. 2018;32:102–110. doi: 10.1038/leu.2017.179. - DOI - PMC - PubMed