. 2024 Feb 8;15(1):1173.
doi: 10.1038/s41467-024-45241-y.

Drug repurposing screen identifies lonafarnib as respiratory syncytial virus fusion protein inhibitor

Affiliations

Drug repurposing screen identifies lonafarnib as respiratory syncytial virus fusion protein inhibitor

Svenja M Sake et al. Nat Commun. .

Abstract

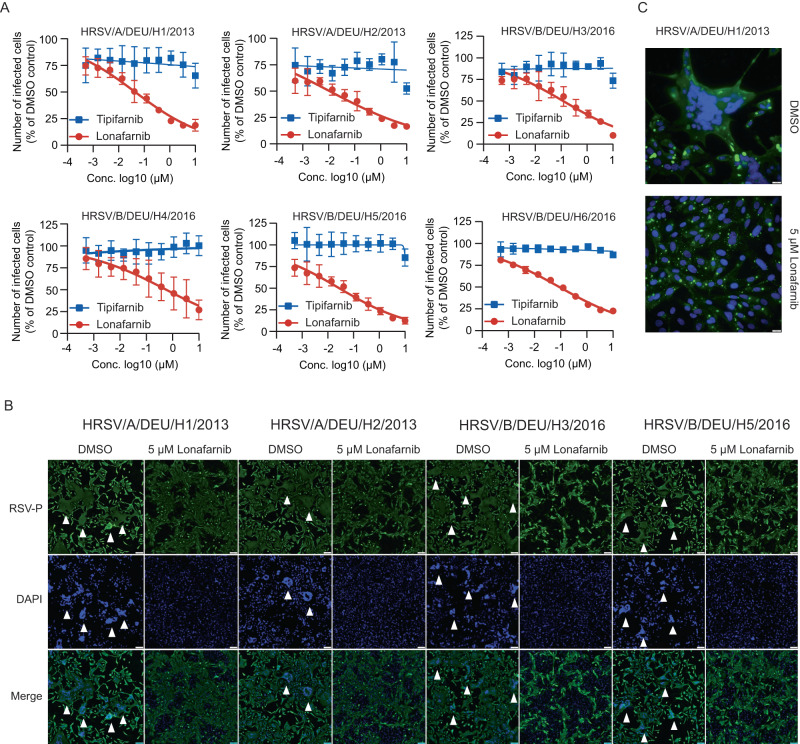
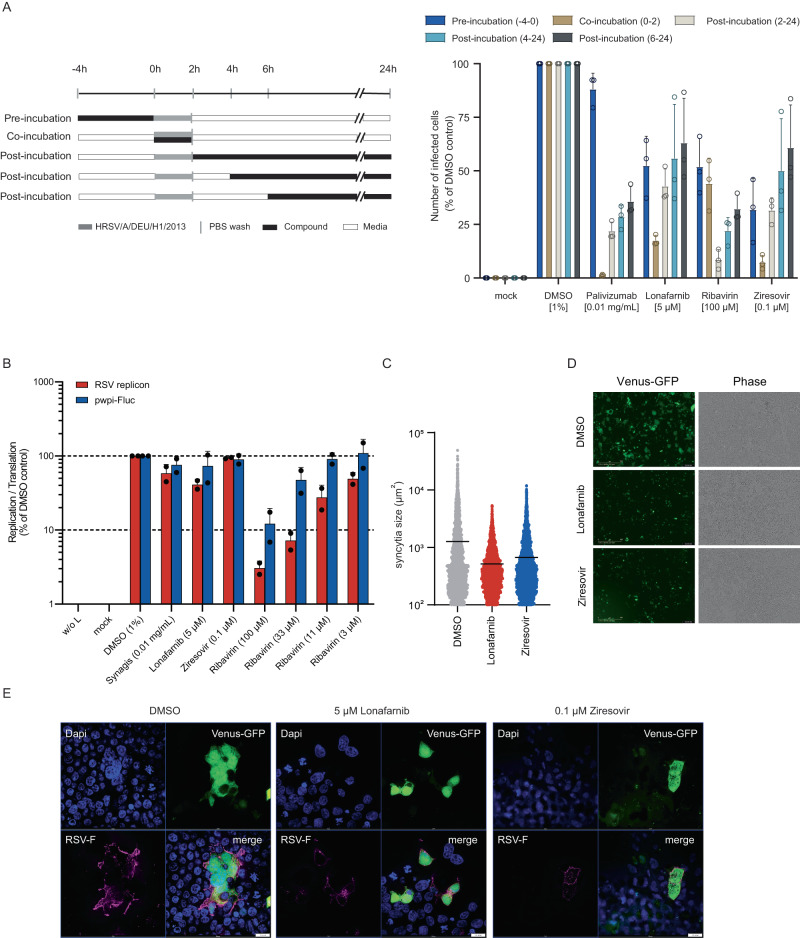
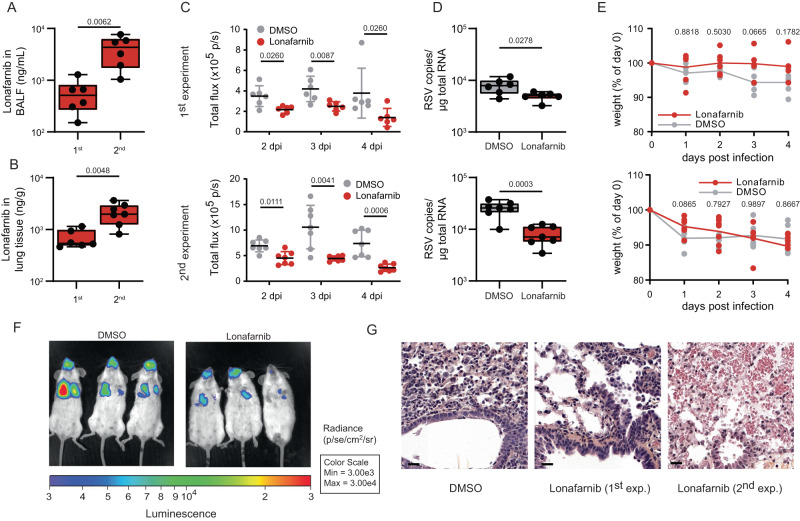
Respiratory syncytial virus (RSV) is a common cause of acute lower respiratory tract infection in infants, older adults and the immunocompromised. Effective directly acting antivirals are not yet available for clinical use. To address this, we screen the ReFRAME drug-repurposing library consisting of 12,000 small molecules against RSV. We identify 21 primary candidates including RSV F and N protein inhibitors, five HSP90 and four IMPDH inhibitors. We select lonafarnib, a licensed farnesyltransferase inhibitor, and phase III candidate for hepatitis delta virus (HDV) therapy, for further follow-up. Dose-response analyses and plaque assays confirm the antiviral activity (IC50: 10-118 nM). Passaging of RSV with lonafarnib selects for phenotypic resistance and fixation of mutations in the RSV fusion protein (T335I and T400A). Lentiviral pseudotypes programmed with variant RSV fusion proteins confirm that lonafarnib inhibits RSV cell entry and that these mutations confer lonafarnib resistance. Surface plasmon resonance reveals RSV fusion protein binding of lonafarnib and co-crystallography identifies the lonafarnib binding site within RSV F. Oral administration of lonafarnib dose-dependently reduces RSV virus load in a murine infection model using female mice. Collectively, this work provides an overview of RSV drug repurposing candidates and establishes lonafarnib as a bona fide fusion protein inhibitor.


Conflict of interest statement

SMS, SH, JR, TFS and TP disclose that they are authoring a patent application “LONAFARNIB FOR USE IN THE TREATMENT OF VIRAL INFECTIONS” describing lonafarnib as antiviral compound that inhibits RSV infection (21152993.8-1132). The authors declare no competing interests and no restrictions on the publication of data.

Figures

Fig. 1
Fig. 1. Identification of drug repurposing candidates.
A Screening and validation procedure. B HEp-2 cells were infected with rHRSV-A-GFP in presence of 5 µM compound. 48 hours later, infection and cell viability were quantified via GFP and MTT readouts. Dotted lines indicate primary hit criteria and dots represent means of two technical replicates. C HEp-2 cells were infected with HRSV-A-Luc at MOI 0.01 and treated with the indicated compound concentrations. 24 hours later, supernatant was transferred onto new cells for a second round of infection. Luminescence was quantified 24 hours post inoculation of both infection rounds. Cell viability was measured via MTT readout in treated, but uninfected cells. Mean ± SD of three independent experiments. Known RSV inhibitors (F protein: presatovir; N protein: RSV604, IMPDH inhibitors (AVN944, mycophenolic acid), HSP90 inhibitors (radiciol, HSP990). 4-Sulfocalix[6]arene Hydrate (4SC6AH, unknown target). Source data are provided as a Source Data file.
Fig. 2
Fig. 2. Lonafarnib but not tipifarnib inhibits RSV infection.
A HEp-2 cells were infected with rHRSV-A-Luc and treated with lonafarnib (n = 4) or tipifarnib (n = 3). Luciferase activity was measured and is expressed relative to the signal detected in DMSO treated infected cells. Mean ± SD of 3-4 independent experiments. MTT assay done n = 3 times. B HEp-2 cells were infected with a clinical isolate HRSV/A/DEU/H1/2013 in presence of 1 µM compound or DMSO control. At 6 dpi, monolayers were stained with crystal violet. Representative pictures of three independent experiments are shown. C Plaque number and mean plaque sizes were quantified using an ELISpot reader. Lonafarnib and tipifarnib were used at 1, 0.2 and 0.04 µM. Mean ± SD and individual results of three independent experiments. P values from one-way repeated measures ANOVA with Dunnett´s multiple comparison correction compared to DMSO are given. n.d., not determined due to absence of plaques. Huh7-hNTCP cells were transfected with HDV production constructs and treated with given compounds (0.1 and 1 µM). 10 days post transfection, translation of the HDV viral genome in the transfected cells was confirmed by immunofluorescence for the HD-Ag (D) (magnification: 10×). Production of HDV progeny was determined by inoculation of Huh7-hNTCP cells and staining of HD-Ag; scale bar: 200 µm. E Mean ± SD and individual results of two experiments are given. F Huh-7.5 F-luc cells were infected with hCoV-229E-Rluc in presence of indicated compound concentrations. 48 hours later, infection and cell viability were measured by luciferase assays. Means ± SD and nonlin. fit from n = 4 independent experiments is given. Source data are provided as a Source Data file.
Fig. 3
Fig. 3. Effect of lonafarnib on clinical RSV isolates.
A Dose-response curve of lonafarnib against 6 RSV isolates. HEp-2 cells were infected with RSV isolates with MOI of 1 (or 5 for HRSV/B/DEU/H6/2016) together with different concentrations of compounds. RSV infectivity was determined 24 h later by RSV-P protein staining and flow cytometry. Mean ± SD of three to ten biological replicates were given. (n = 6 for H1; n = 3 for H2, H5 and H6; n = 4 for H3; n = 10 for H4) (B, C) HEp-2 cells were inoculated with HRSV/A/DEU/H1/2013, HRSV/A/DEU/H2/2013, HRSV/B/DEU/H3/2016, or HRSV/B/DEU/H5/2016 4 h prior to treatment with 5 µM lonafarnib or DMSO for 48 h. Cells were stained for RSV-P protein expression (green) and nuclear DNA (blue) (10× magnification) (B). Pictures from one of three independent experiments are given. Arrowheads highlight RSV induced syncytia. Scale bar: 100 µm. C Close-up pictures (40× magnification) of treated HEp-2 cells infected with HRSV/A/DEU/H1/2013. Scale bar: 20 µm. Representative pictures from one of two independent experiments are given. Source data are provided as a Source Data file.
Fig. 4
Fig. 4. Lonafarnib selects for RSV cross-resistance to entry inhibitors.
A rHRSV-A-GFP virus populations were sequenced after 10 passages and compared to the initial sequence. Lines depict reads numbers across the genome; open circles non-coding, filled circles coding mutations. Amino acid exchanges with a frequency ≥ 5 % (dotted line) are labeled. B HEp-2 cells were infected at an MOI of 1 and infected cells quantified by flow cytometry. Symbols show results from three independent experiments. C HEp-2 cells were infected with the indicated virus population at an MOI of 1 and treated with 1 % DMSO, 10 µM lonafarnib, 0.1 µM presatovir or 10 µM BMS-433771. GFP-positive cells were quantified by flow cytometry. Mean ± SD and individual values of three independent experiments and p values are given. Statistical analysis was done by a 2way ANOVA with Sidák´s multiple comparison test in relation to DMSO control. D HEp-2 cells were transduced with lentiviral pseudoparticles in presence of DMSO or lonafarnib (5 µM and 0.5 µM). Mean ± SD and individual results of two to five independent experiments (n = 5 for DMSO- and mock-treated RSVwt and K272E, n = 4 for lonafarnib-treated RSVwt and K272E and for all K394R, n = 2 for VSV-G pseudotypes) and p values. One-way repeated measures ANOVA with Dunnett´s multiple comparison test in relation to DMSO control. No statistics were calculated for the null-hypothesis (no glycoprotein). E HEp-2 cells were infected with lentiviral RSV F pseudotypes harboring the resistance mutations and lonafarnib (10 µM, 5 µM, 2 µM, 0.5 µM, 0.25 µM) or 1% DMSO. Mean ± SD and individual values of n = 3 independent experiments are given. P values from two-way ANOVA and Dunnett´s multiple comparison test in relation to DMSO control. F Surface plasmon resonance analyses of a prefusion RSV-F protein with lonafarnib (left) or tipifarnib (right) at concentrations of 1.56–100 µM (in duplicate) over an immobilized RSV subtype A pre-fusion F protein. In contrast to tipifarnib, lonafarnib shows significant and concentration-dependent binding responses to F protein. Binding kinetics and affinity were calculated by global fitting of the association and dissociation curves. Source data are provided as a Source Data file.
Fig. 5
Fig. 5. Lonafarnib targets the fusion protein of HRSV.
A Time-of-addition assay of lonafarnib. HEp-2 cells were infected with HRSV/A/DEU/H1/2013 (MOI of 1) for 2 hours. Compounds were added as indicated. 24 hours later cells were harvested for intracellular staining of RSV-P and flow cytometry. Mean ± SD of three biological replicates were given. B Replicon assay. BSR-T7/5 cells transfected with either RSV replicon plasmids or system control plasmid pWPI-Fluc were treated with compounds containing media 4 hours post transfection, and luciferase activity was measured 3 days post compound treatment. Mean ± SD of two biological replicates were given. CE Lonafarnib reduces cell-cell fusion induced by the RSV F protein. 293 T cells were transfected with a Venus-GFP and an RSV-F expression plasmid 6 h before treatment of cells with the solvent control DMSO (gray), 5 µM lonafarnib (red) or 0.1 µM ziresovir (blue). C, D 48 h post transfection, pictures were taken (10-fold magnification). All syncytia ( > 100 µm2) from four pictures per well of two wells per condition from a total of two independent experiments were analyzed using Fiji software. Means and symbols representing n = 11,803 syncytia examined over 2 independent experiments. D Representative pictures used to analyze (C). Scale bar: 400 µm. E 293 T cells were seeded on glass cover slips and co-transfected with a Venus-GFP and an RSV-F expression plasmid 6 h prior to treatment of cells with solvent control DMSO, 5 µM lonafarnib or 0.1 µM ziresovir. 72 h later cells were stained for RSV F protein (magenta) and DNA (blue) (100× magnification). Representative images from 2 independent experiments are given. Scale bar: 100 pixel equal to 10 µm. Source data are provided as a Source Data file.
Fig. 6
Fig. 6. Structure of RSV F in complex with lonafarnib.
Top (A) and side views (B) of lonafarnib bound to RSV F. Each F protomer is a colored differently (red, pink and blue), and hydrophobic side chains interacting with lonafarnib are shown with transparent molecular surfaces. In (B) one RSV F protomer is removed for clarity. One inhibitor molecule binds to each symmetry-related RSV-F protomer with an occupancy of 0.33, but for clarity only one inhibitor is shown as ball-and-stick model with carbon atoms colored in gray, nitrogen atoms in blue, oxygen atoms in red, and bromine atoms in dark red. C Stereo image of the top view including a polder map contoured at 3.0 sigma, around the ligand. D Zoomed-out view of the F-protein homotrimer in complex with lonafarnib (sticks and transparent gray surface) highlighting residues, which undergo resistance-conferring mutations upon lonafarnib exposure (T335 and T400; space filling-models).
Fig. 7
Fig. 7. Lonafarnib inhibits RSV infection in differentiated human lung cells.
A HEp-2 cells were inoculated with rHRSV-A-Luc (MOI of 0.01) together with given compounds. 24 h later, luminescence was quantified and the theoretical additive effects were calculated. The mean difference of the theoretical and measured combined effect of three independent experiments are shown. B A549 cells were infected with rHRSV-A-GFP at an MOI of 0.01. 24 h later, cells were washed and supplemented with compound-containing media. RSV infection efficiency was determined at 48 h, 72 h, 96 h, 120 h post inoculation (i.e. 24 h to 96 h post addition of compounds) by measuring the number of infected cells using flow cytometry. Data were normalized to the highest number of infected cells as observed in the DMSO-treated specimen at 120 h post inoculation. Mean ± SD of three biological repeats were shown. Statistical analysis was done by 2way ANOVA and Dunnett´s multiple comparison test compared to DMSO data (p values). C, D Differentiated BCi-NS1.1 cells were grown as ALI cultures and treated (C) prophylactically or (D) therapeutically with the indicated compound concentrations. C One hour after compound treatment from the basal side, cells were infected with rHRSV-A-GFP from the apical side in presence of the indicated compound concentration for one hour. Apical compound treatment was repeated twice daily for one hour, basal treatment was repeated once daily for 24 hours. RSV RNA in supernatant (upper; mean ± SD of one to four technical replicates of one experiment; n = 4 for 24 h, n = 3 for 48 h, n = 2 for 72 h, n = 1 for 96 h) and cell lysates (lower graph; mean ± SD of one replicate measured in duplicates of one experiment) was quantified. D Differentiated BCi-NS1.1 cells were inoculated with HRSV/A/DEU/H1/2013 (MOI 0.1) 24 h before treatment from the basolateral side. Apical washes were collected 72 h and 96 h later and a LDH toxicity analysis was performed. Viral genome copies were analyzed by qRT-PCR. Means of two independent experiments with 2 (square) or 3 (circles) transwells (i.e. technical replicates). Statistics were calculated in regard to DMSO treated cells using a 2-way ANOVA with Dunnett´s multiple comparison test. Source data are provided as a Source Data file.
Fig. 8
Fig. 8. Lonafarnib reduces RSV infection in mice.
AE BALB/c mice were perorally treated with 60 mg/kg lonafarnib (1st experiment N = 6; 2nd experiment N = 7) or vehicle. Two hours later, mice were infected with a recombinant RSV luciferase reporter virus or mock infected. Drug treatment was repeated twice daily, subsequently. (A/B) Lonafarnib concentration in BALF (A) and the lung tissue (B) was quantified at 4 dpi. Note that for one mouse in the 2nd experiment there was no BALF available. (A/B) Boxes represent 25th to 75th percentiles including the median and whiskers go from minimum to maximum values. Dots represent individual mice. Two-tailed unpaired t-test. (C). Total bioluminescence in nose and lung for each animal. Each dot represents one animal. A Mann and Whitney (Houston) test was used. Data are presented as the mean ± standard error of the mean (SEM). D Viral load in lung tissue at 4 dpi as quantified by qRT-PCR. Dots represent individual mice (1st experiment N = 6; 2nd experiment N = 7). Boxes represent 25th to 75th percentiles plus median and whiskers go from minimum to maximum values. Two-tailed unpaired t-test. E Mice bodyweight in percent of the respective starting weight. Dots represent individual mice. Two-way ANOVA followed by Sidak’s multiple comparison test. For CE, top row 1st and bottom row is 2nd experiment. F Exemplary pictures of bioluminescence for (C). G HES staining of mice lung treated with either DMSO or lonafarnib. Scale bar: 20 µm. Representative pictures of 2 independent experiments are given (n = 2). Source data are provided as a Source Data file.

Similar articles

Cited by

References

    1. Liu L, et al. Global, regional, and national causes of under-5 mortality in 2000-15: an updated systematic analysis with implications for the Sustainable Development Goals. Lancet. 2016;388:3027–3035. doi: 10.1016/S0140-6736(16)31593-8. - DOI - PMC - PubMed
    1. Mazur NI, et al. Lower respiratory tract infection caused by respiratory syncytial virus: current management and new therapeutics. Lancet Respir. Med. 2015;3:888–900. doi: 10.1016/S2213-2600(15)00255-6. - DOI - PubMed
    1. Lange M, et al. Non-Appearance of the RSV Season 2020/21 During the COVID-19 Pandemic-Prospective, Multicenter Data on the Incidence of Respiratory Syncytial Virus (RSV) Infection. Dtsch Arztebl Int. 2021;118:561–562. - PMC - PubMed
    1. Haapanen M, Renko M, Artama M, Kuitunen I. The impact of the lockdown and the re-opening of schools and day cares on the epidemiology of SARS-CoV-2 and other respiratory infections in children—A nationwide register study in Finland. EClinicalMedicine. 2021;34:100807. doi: 10.1016/j.eclinm.2021.100807. - DOI - PMC - PubMed
    1. Bardsley M, et al. Epidemiology of respiratory syncytial virus in children younger than 5 years in England during the COVID-19 pandemic, measured by laboratory, clinical, and syndromic surveillance: a retrospective observational study. Lancet Infect Dis. 2023;23:56–66. doi: 10.1016/S1473-3099(22)00525-4. - DOI - PMC - PubMed