

Temporal variations in the gut microbial diversity in response to high-fat diet and exercise
- PMID: 38332014
- PMCID: PMC10853223
- DOI: 10.1038/s41598-024-52852-4
Temporal variations in the gut microbial diversity in response to high-fat diet and exercise
Abstract
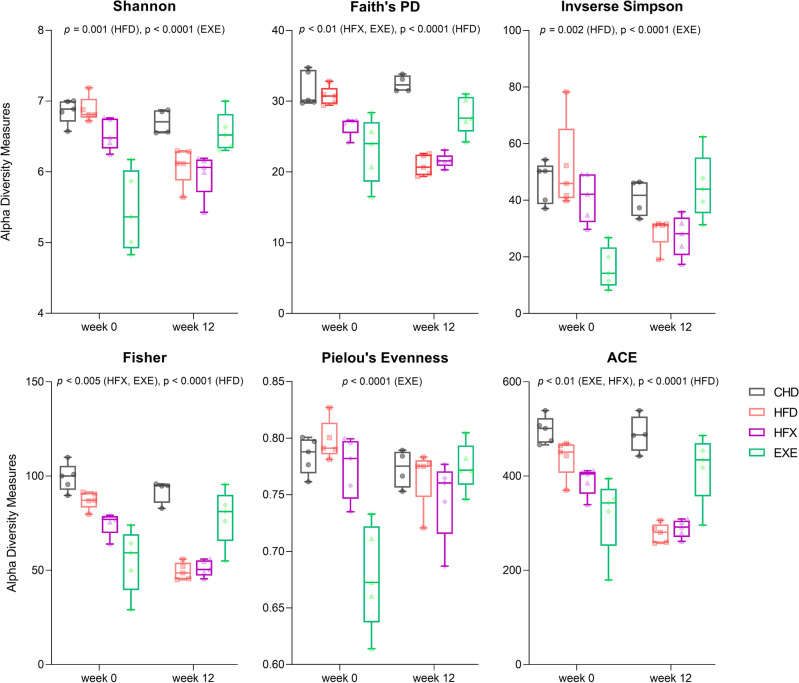
High-fat diet-induced obesity is a pandemic caused by an inactive lifestyle and increased consumption of Western diets and is a major risk factor for diabetes and cardiovascular diseases. In contrast, exercise can positively influence gut microbial diversity and is linked to a decreased inflammatory state. To understand the gut microbial variations associated with exercise and high-fat diet over time, we conducted a longitudinal study to examine the effect of covariates on gut microbial diversity and composition. Young mice were divided into four groups: Chow-diet (CHD), high-fat diet (HFD), high-fat diet + exercise (HFX), and exercise only (EXE) and underwent experimental intervention for 12 weeks. Fecal samples at week 0 and 12 were collected for DNA extraction, followed by 16S library preparation and sequencing. Data were analyzed using QIIME 2, R and MicrobiomeAnalyst. The Bacteroidetes-to-Firmicutes ratio decreased fivefold in the HFD and HFX groups compared to that in the CHD and EXE groups and increased in the EXE group over time. Alpha diversity was significantly increased in the EXE group longitudinally (p < 0.02), whereas diversity (Shannon, Faith's PD, and Fisher) and richness (ACE) was significantly reduced in the HFD (p < 0.005) and HFX (p < 0.03) groups over time. Beta diversity, based on the Jaccard, Bray-Curtis, and unweighted UniFrac distance metrics, was significant among the groups. Prevotella, Paraprevotella, Candidatus arthromitus, Lactobacillus salivarius, L. reuteri, Roseburia, Bacteroides uniformis, Sutterella, and Corynebacterium were differentially abundant in the chow-diet groups (CHD and EXE). Exercise significantly reduced the proportion of taxa characteristic of a high-fat diet, including Butyricimonas, Ruminococcus gnavus, and Mucispirillum schaedleri. Diet, age, and exercise significantly contributed to explaining the bacterial community structure and diversity in the gut microbiota. Modulating the gut microbiota and maintaining its stability can lead to targeted microbiome therapies to manage chronic and recurrent diseases and infections.
© 2024. The Author(s).
Conflict of interest statement
The authors declare no competing interests.
Figures


Similar articles
-
Diet Is a Stronger Covariate than Exercise in Determining Gut Microbial Richness and Diversity.Nutrients. 2022 Jun 16;14(12):2507. doi: 10.3390/nu14122507. Nutrients. 2022. PMID: 35745235 Free PMC article.
-
Exercise and/or Genistein Do Not Revert 24-Week High-Fat, High-Sugar Diet-Induced Gut Microbiota Diversity Changes in Male C57BL/6J Adult Mice.Microorganisms. 2022 Nov 10;10(11):2221. doi: 10.3390/microorganisms10112221. Microorganisms. 2022. PMID: 36363813 Free PMC article.
-
Antibiotics-induced perturbations in gut microbial diversity influence metabolic phenotypes in a murine model of high-fat diet-induced obesity.Appl Microbiol Biotechnol. 2019 Jul;103(13):5269-5283. doi: 10.1007/s00253-019-09764-5. Epub 2019 Apr 24. Appl Microbiol Biotechnol. 2019. PMID: 31020379
-
Exercise and/or Genistein Treatment Impact Gut Microbiota and Inflammation after 12 Weeks on a High-Fat, High-Sugar Diet in C57BL/6 Mice.Nutrients. 2020 Nov 6;12(11):3410. doi: 10.3390/nu12113410. Nutrients. 2020. PMID: 33172007 Free PMC article.
-
Gut dysbiosis, inflammation and type 2 diabetes in mice using synthetic gut microbiota from diabetic humans.Braz J Biol. 2021 Aug 6;83:e242818. doi: 10.1590/1519-6984.242818. eCollection 2021. Braz J Biol. 2021. PMID: 34378656
Cited by
-
Sex Differences in Cardiovascular Diseases: Exploring the Role of Microbiota and Immunity.Biomedicines. 2024 Jul 24;12(8):1645. doi: 10.3390/biomedicines12081645. Biomedicines. 2024. PMID: 39200110 Free PMC article. Review.
-
Higher physical activity levels are related to faecal microbiota diversity and composition in young adults.Biol Sport. 2025 Jan;42(1):123-135. doi: 10.5114/biolsport.2025.139850. Epub 2024 Jun 4. Biol Sport. 2025. PMID: 39758173 Free PMC article.
-
Effects of a Balanced Diet and Probiotics on Blood Biomarkers and Gut Microbiota in the Elderly: A Community-Based Intervention Study.Nutrients. 2025 Jun 4;17(11):1933. doi: 10.3390/nu17111933. Nutrients. 2025. PMID: 40507202 Free PMC article. Clinical Trial.
-
A droplet microfluidic strategy for cultivation, investigation, and high-throughput isolation of mouse gut microbiome bacteria.Appl Environ Microbiol. 2025 Aug 20;91(8):e0069525. doi: 10.1128/aem.00695-25. Epub 2025 Jul 10. Appl Environ Microbiol. 2025. PMID: 40637405 Free PMC article.
-
Ruminococcus gnavus in the gut: driver, contributor, or innocent bystander in steatotic liver disease?FEBS J. 2025 Mar;292(6):1252-1264. doi: 10.1111/febs.17327. Epub 2024 Nov 26. FEBS J. 2025. PMID: 39589934 Free PMC article. Review.
References
-
- WHO European Regional Obesity Report 2022, (2022).
MeSH terms
Grants and funding
LinkOut - more resources
Full Text Sources
Miscellaneous
