. 2024 Feb 8;15(1):962.
doi: 10.1038/s41467-024-45279-y.

Trophoblast stem cell-based organoid models of the human placental barrier

Affiliations

Trophoblast stem cell-based organoid models of the human placental barrier

Takeshi Hori et al. Nat Commun. .

Abstract

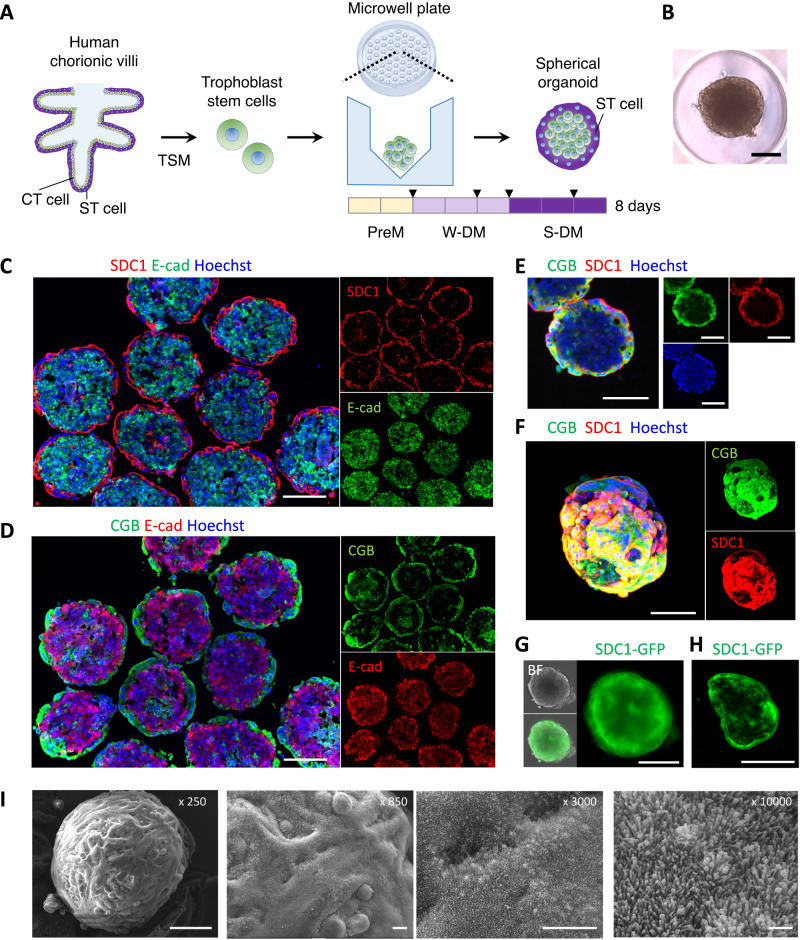
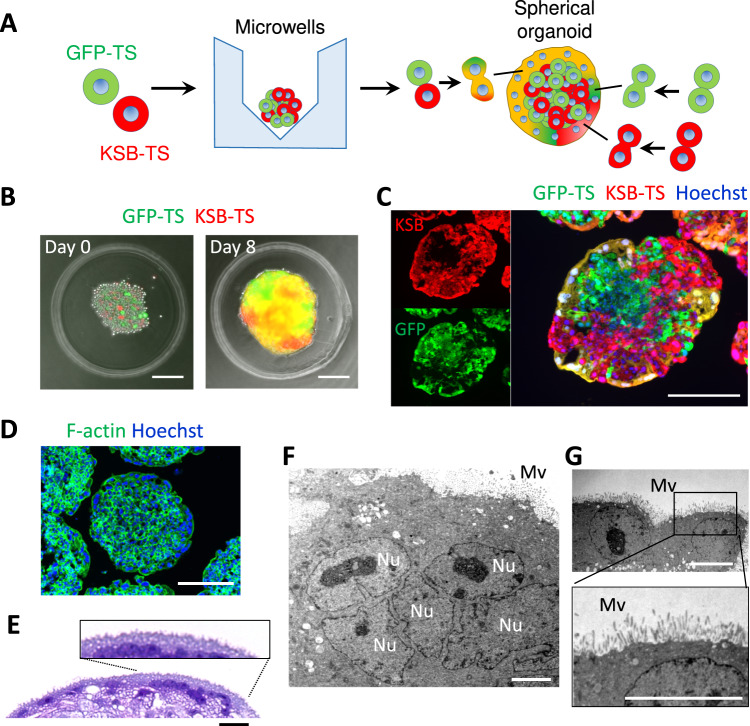
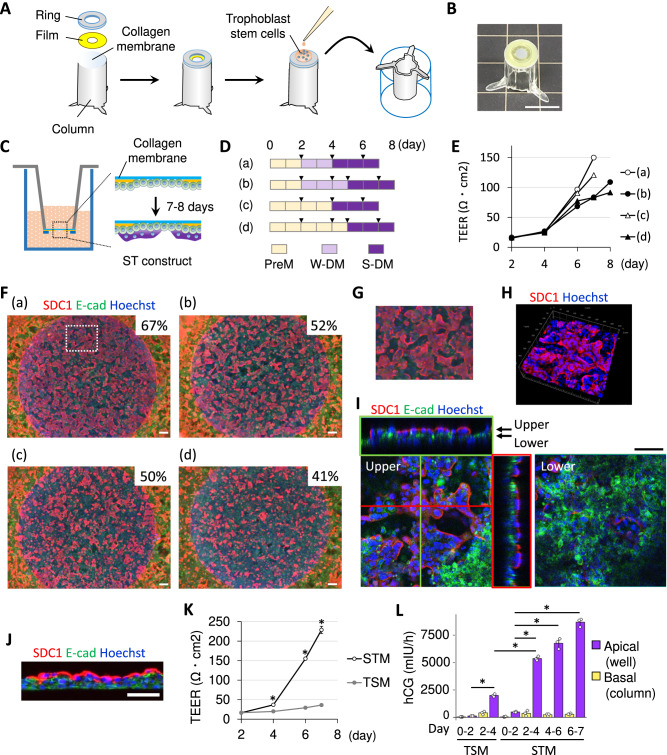
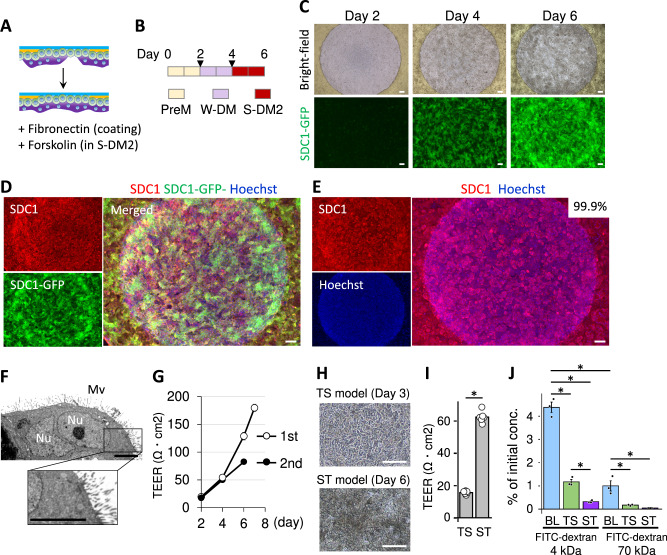
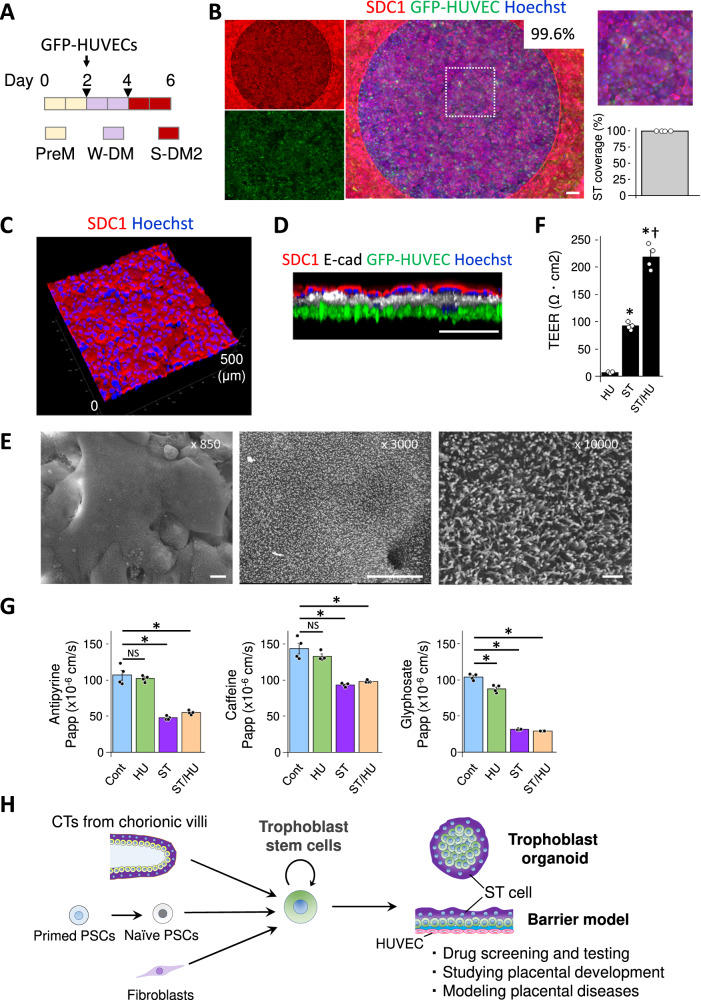
Human placental villi have essential roles in producing hormones, mediating nutrient and waste exchange, and protecting the fetus from exposure to xenobiotics. Human trophoblast organoids that recapitulate the structure of villi could provide an important in vitro tool to understand placental development and the transplacental passage of xenobiotics. However, such organoids do not currently exist. Here we describe the generation of trophoblast organoids using human trophoblast stem (TS) cells. Following treatment with three kinds of culture medium, TS cells form spherical organoids with a single outer layer of syncytiotrophoblast (ST) cells that display a barrier function. Furthermore, we develop a column-type ST barrier model based on the culture condition of the trophoblast organoids. The bottom membrane of the column is almost entirely covered with syndecan 1-positive ST cells. The barrier integrity and maturation levels of the model are confirmed by measuring transepithelial/transendothelial electrical resistance (TEER) and the amount of human chorionic gonadotropin. Further analysis reveals that the model can be used to derive the apparent permeability coefficients of model compounds. In addition to providing a suite of tools for the study of placental development, our trophoblast models allow the evaluation of compound transfer and toxicity, which will facilitate drug development.


Conflict of interest statement

TMDU has filed a patent application covering the protocol and methods for the generation of human trophoblast organoids. T.H. and H.K. own stock as members of a recently established company, HPS Inc., and they potentially would receive compensation from the company. The remaining authors declare no competing interests.

Figures

Fig. 1
Fig. 1. Generation of apical-out spherical trophoblast organoids.
A The procedure for generation of the apical-out spherical trophoblast organoids. Triangular marks indicate medium exchange. A microwell plate was designed using SolidWorks 2019 (Dassault Systèmes SolidWorks Corporation) and Materialise MiniMagics23.5 (Materialise). B An image of a spherical trophoblast organoid in a microwell. CE Immunostaining of syndecan 1 (SDC1), the beta subunit of the human chorionic gonadotropin (CGB), or E-cadherin (E-cad) in cross-sections of spherical trophoblast organoids. Images were obtained using BZ-X800/810 (Keyence). F Confocal images of a 3D structure of the organoid. The organoids of day 8 were fixed, permeabilized, and stained with antibodies for SDC1 and CGB. A series of confocal z-stack images were obtained using a Zeiss LSM 700 confocal microscope (Carl Zeiss), and a 3D image was reconstructed. G Epifluorescence and bright-field (BF) images of the organoid derived from SDC1-GFP (green fluorescent protein) TS cells that will express 7xGFP11 when the SDC1 promoter is activated and express GFP1-10 continuously (refer to Supplementary Fig. S7A, B). H A fluorescence image of a cross-section of the organoids derived from SDC1-GFP TS cells. I Scanning electron microscopy images of a trophoblast organoid. The scale bars indicate 200 μm (BH), 100 μm (I, ×250), 10 μm (I, ×850 and ×3000), or 1 μm (I, ×10000). CT cytotrophoblast, ST syncytiotrophoblast, TSM trophoblast stem cell medium, PreM pre-culture medium, W-DM weak differentiation medium, S-DM strong differentiation medium. BI Images from the organoids of day 8. Section samples were stained with antibodies in more than triplicates in over three independent experiments.
Fig. 2
Fig. 2. Analysis of the fusion of ST cells in apical-out spherical trophoblast organoids.
A The procedure for generation of the trophoblast organoids using a mixture of GFP-TS cells and kusabira-orange (KSB)-TS cells. B An image of a trophoblast organoid in a microwell. C Fluorescence images of a cross-section of the organoids generated from a mixture of GFP-TS cells and KSB-TS cells. D Staining with phalloidin-FITC and Hoechst. E Staining with hematoxylin and eosin (H&E). F Transmission electron microscopy images of the spherical organoids. The scale bars indicate 200 μm (BD), 15 μm (E), 5 μm (F), or 10 μm (G). Images were taken using BZ-X800/810 (BE) and JEM-1400Flash (F and G). ST syncytiotrophoblast, Nu nucleus, Mv microvilli on the surface of the organoids. BG Images from the organoids of day 8.
Fig. 3
Fig. 3. Consideration for modeling the ST barrier.
A A schematic diagram of fabrication of a column insert and cell seeding. B An image of the column insert. C Schematic of ST barrier formation. D Culture schedules for ST barrier models. Triangular marks indicate medium exchange. E Transepithelial/transendothelial electrical resistance (TEER) values for the barrier models. FJ Immunofluorescence staining images of SDC1 and E-cadherin. F Percentage of the area covered with SDC1-expressing cells in the circular collagen membrane in each sample was determined using ImageJ version 1.47t (National Institutes of Health) (N = 1). G A partially magnified image of Fig. 3F(a). TS cells on the column device were cultured in PreM for 2 days, W-DM for 2 days, and S-DM for 3 days. H A 3D structure and (I) cross-sections in ST barrier models analyzed using a Zeiss LSM 700 confocal microscope (Carl Zeiss). A sample that is shown in Fig. 3F(a) was analyzed. J Immunostaining of a frozen section of the ST barrier models. K TEER levels for the ST or TS models. TS cells were seeded at 1.2 ×10⁶ cells/mL ×40 μL/column on day 0 in this experiment (N = 7, STM; N = 3, TSM). *P < 0.05, Student’s t test (STM vs. TSM). STM, The three kinds of medium shown in Fig. 3D(a). TSM, trophoblast stem cell medium. Data are shown as mean ± SE. L Levels of secreted hCG (N = 3). *P < 0.05, Tukey’s multiple comparison test. Data are shown as mean ± SE. The scale bars indicate 1 cm (B), 200 μm (F), or 100 μm (I and J). F, G, J Images were taken using BZ-X800/810. N refers to replicates (biologically independent samples).
Fig. 4
Fig. 4. Enhancement of ST coverage in the barrier models.
A Schematic of additional factors for ST barrier formation. B A culture schedule for the improved ST barrier model. Triangular marks indicate medium exchange. C SDC1 expression levels visualized using SDC1-GFP TS cells in the improved culture condition. D Immunostaining for SDC1 and fluorescence of SDC1-GFP in SDC1-GFP TS cells. E Immunostaining for SDC1 and fluorescence of Hoechst in TS cells (CT27 line). F Transmission electron microscopy images of the barrier models. G TEER levels for the previous 7-day culture model of Fig. 3D(a) (1st) and the improved 6-day culture model (2nd). Data are shown as mean ± SE (N = 4). HJ FITC-dextran permeability assay. Images of TS models and ST models (H), and TEER levels of both models (I, N = 6). J Percentage of transfer of FITC-dextran (4 kDa and 70 kDa) from the apical (well) to the basal (column). TS trophoblast stem cells, ST syncytiotrophoblast, BL blank (only collagen membrane). Data are shown as mean ± SE, which are percentages of concentrations against initial concentrations of FITC-dextran (N = 3). *P < 0.05, Tukey’s multiple comparison test. The scale bars indicate 200 μm (CE, and H),or 5 μm (F). Images were taken using BZ-X800/810 (CE), JEM-1400Flash (F), or Olympus CKX53 (H). D, E Images from the barrier models of day 6. Nu nucleus, Mv microvilli on the surface of the organoids. G, I, J N refers to replicates (biologically independent samples).
Fig. 5
Fig. 5. ST/HUVEC co-culture barrier models and translocation of drugs.
A The strategy of co-culture for ST/HUVEC models. Triangular marks indicate medium exchange. B ST/HUVEC models were generated according to the strategy shown in Fig. 5A. Immunostaining of SDC1. The right panel shows a partially magnified image taken using BZ-X800/810. The average ST coverage was 99.6 ± 0.0973% (mean ± SE, N = 4). ST/HUVEC models in a perspective view (C) and in a side view (D) by confocal microscopy with TCS SP8 (Leica). E Scanning electron microscopy images of a ST/HUVEC barrier model. F TEER measurements in each barrier model (N = 4). *P < 0.05, Dunnett’s test. †P < 0.05, Student’s t test (ST vs. ST/HUVEC). Data are shown as mean ± SE. G The permeability of reference compounds in control (Cont, collagen membrane), HUVEC (HU), ST, and ST/HUVEC (ST/HU) models (N = 4). *P < 0.05, Dunnett’s test. Data are shown as mean ± SE. H Potential applications of human trophoblast organoids and ST barrier models. The scale bars indicate 200 μm (B), 200 μm (D), 10 μm (E, ×850 and ×3000), or 1 μm (E, ×10,000). Data of ST or ST/HUVEC models were obtained from the models of day 6. F, G N refers to replicates (biologically independent samples).

Similar articles

Cited by

References

    1. Gude NM, Roberts CT, Kalionis B, King RG. Growth and function of the normal human placenta. Thromb. Res. 2004;114:397–407. doi: 10.1016/j.thromres.2004.06.038. - DOI - PubMed
    1. Costa, J., et al. The Role of the 3Rs for Understanding and Modeling the Human Placenta. J. Clin. Med.10, 3444 (2021). - PMC - PubMed
    1. Wick P, et al. Barrier capacity of human placenta for nanosized materials. Environ. Health Perspect. 2010;118:432–436. doi: 10.1289/ehp.0901200. - DOI - PMC - PubMed
    1. Grafmueller S, et al. Bidirectional Transfer Study of Polystyrene Nanoparticles across the Placental Barrier in an ex Vivo Human Placental Perfusion Model. Environ. Health Perspect. 2015;123:1280–1286. doi: 10.1289/ehp.1409271. - DOI - PMC - PubMed
    1. Karttunen V, et al. Criteria and challenges of the human placental perfusion - Data from a large series of perfusions. Toxicol. Vitr. 2015;29:1482–1491. doi: 10.1016/j.tiv.2015.06.001. - DOI - PubMed